Daily Cocoa Market Report (1 Dec 2025): US Cocoa Futures Rebound While UK Market Pauses After Rally


- US cocoa futures closed higher on Monday while UK futures retreated slightly, despite both markets rallying sharply on Friday.
- Farmers across key growing regions reported that last week’s combination of strong rainfall and bright sunshine has helped strengthen trees and support the development of pods destined for the February–March harvest.
- Ivory Coast cumulative arrivals reached 718,000 tons as of Sunday, compared with 618,000 tons at the same point last week.
Supply Outlook
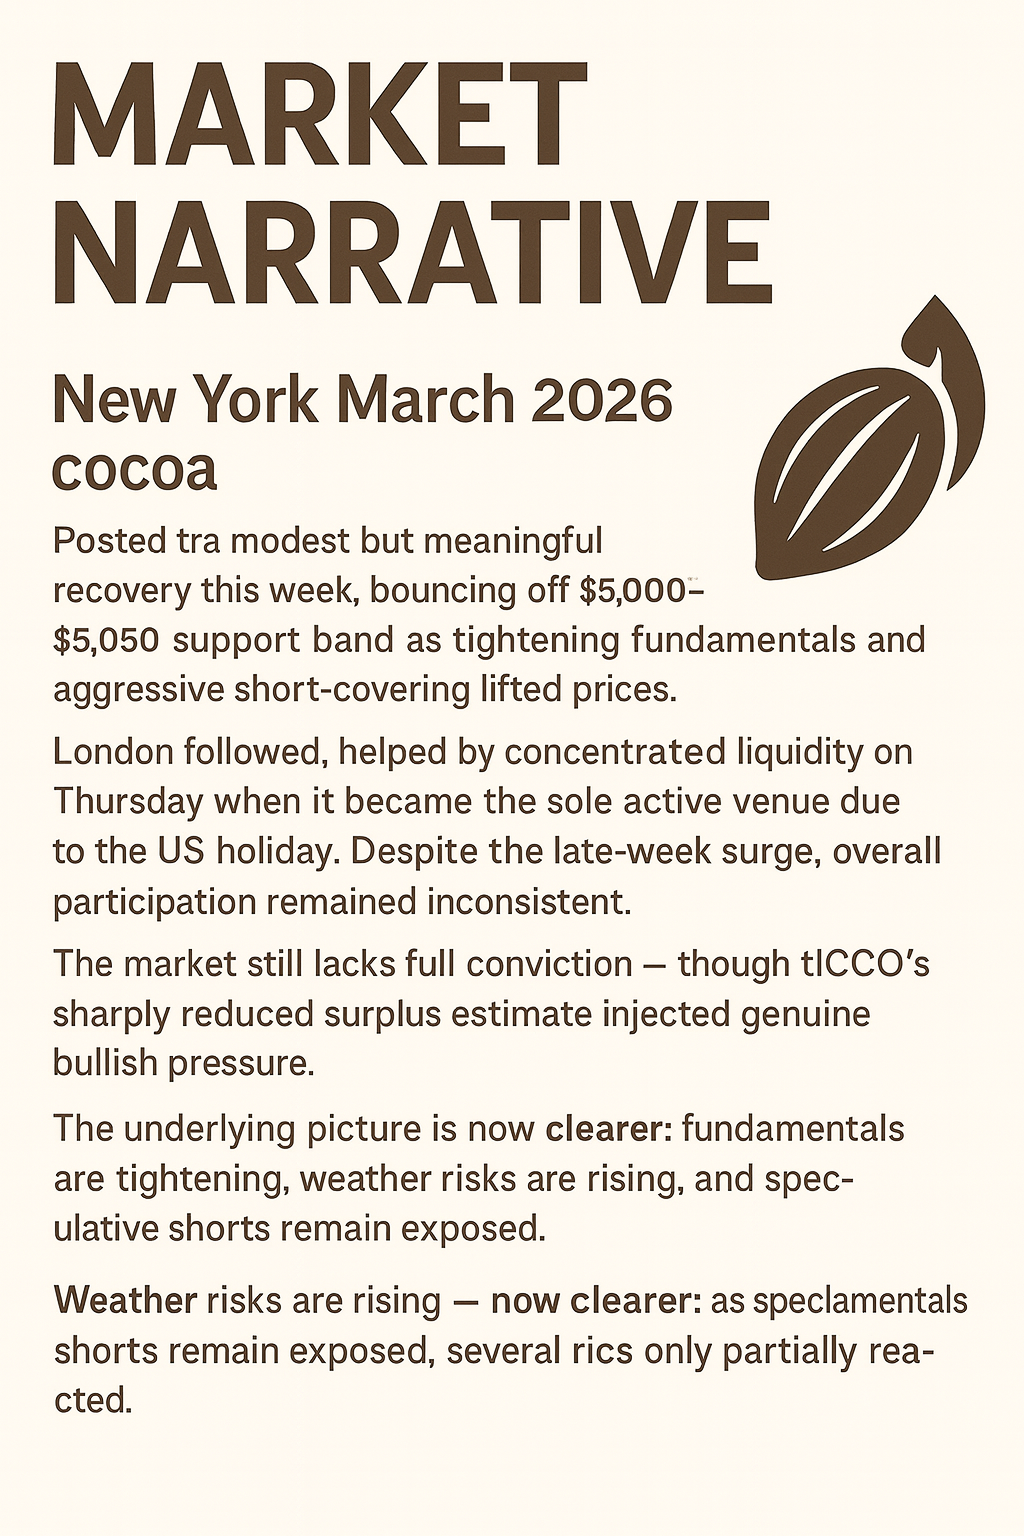
The latest ICCO update shows a 49,000-ton global surplus for 2024/25, far smaller than the 98,000-ton surplus traders surveyed by Reuters had expected back in September. CRA has taken an even more aggressive stance, slashing its outlook by 33,000 tons and now projecting an 8,000-ton deficit for the same season. It also cut its 2025/26 surplus forecast by 20,000 tons, leaving a still-large but less comfortable 265,000-ton surplus.
Weather
Recent weather patterns in Ivory Coast have been unusually favourable for cocoa production. Farmers across key growing regions reported that last week’s combination of strong rainfall and bright sunshine has helped strengthen trees and support the development of pods destined for the February–March harvest. The main crop is currently in its traditional dry-season window, but many growers say the moisture has improved conditions enough to raise expectations for steady output into December and January. Producers also noted that trees appear healthier ahead of the seasonal harmattan winds, which typically bring drier air and can reduce pod quality if too intense. Some regions received rainfall well above their five-year norms, leading farmers to predict good harvest volumes if the rains remain consistent through December. Weekly temperatures ranged from 27°C to just above 30°C, broadly in line with seasonal averages.
Source: Reuters
Futures Performance
London (ICE Europe)
Comparing Monday (1 Dec) vs Friday (28 Nov)
| Contract | Close# 1 Dec | Close# 28 Nov | Change | Volume (Mon) |
|---|---|---|---|---|
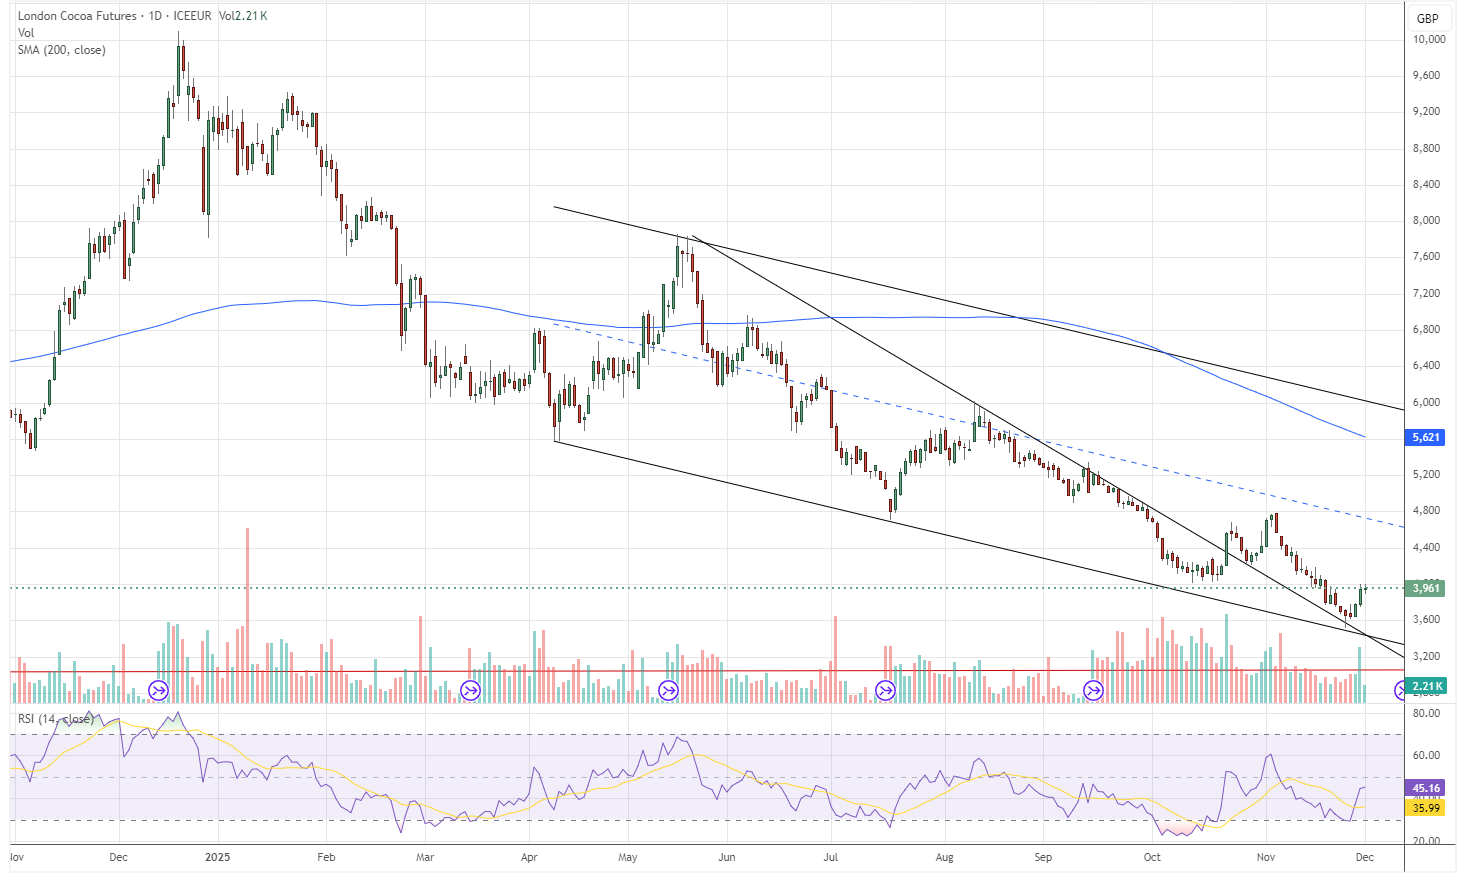
| Dec-25 | 3,966 | 3,998 | -32 | 2,206 |
| Mar-26 | 4,093 | 4,117 | -24 | 11,712 |
| May-26 | 4,096 | 4,134 | -38 | 5,537 |
| Jul-26 | 4,113 | 4,145 | -32 | 3,890 |
| Sep-26 | 4,108 | 4,141 | -33 | 1,869 |
London paused after Friday’s explosive move, pulling back modestly but holding above key breakout levels. Volume rose (27,222 vs 28,995), showing ongoing real participation. With UK stocks rising to 619,844 tons, the physical side remains heavy, but speculative shorts are still stretched — keeping upside volatility alive.
New York (ICE US)
Comparing Monday (1 Dec) vs Friday (28 Nov)
| Contract | Close# 1 Dec | Close# 28 Nov | Change | Volume (Mon) |
|---|---|---|---|---|
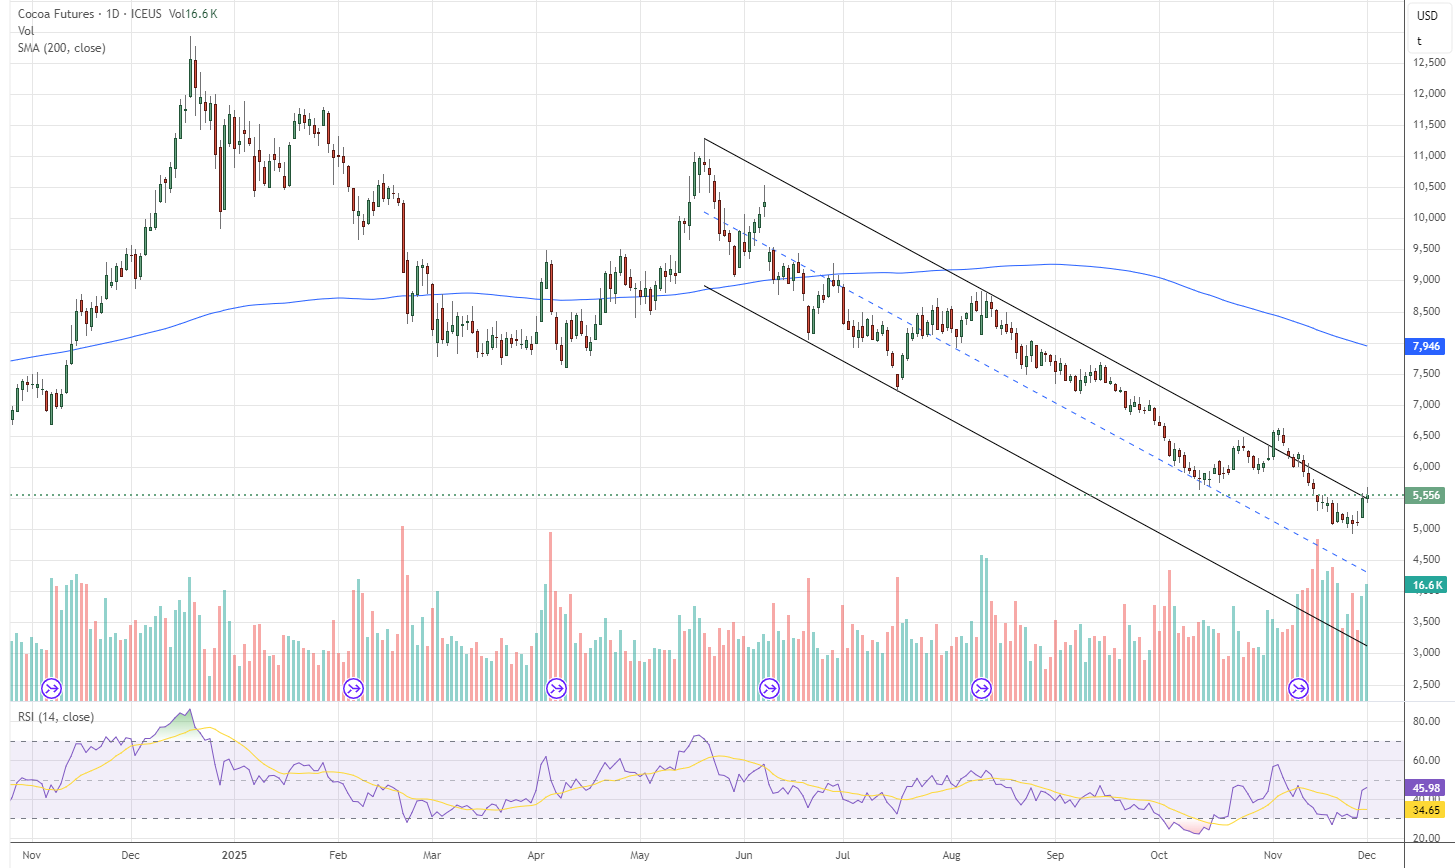
| Dec-25 | 5,456 | 5,404 | +52 | 0 |
| Mar-26 | 5,556 | 5,504 | +52 | 17,609 |
| May-26 | 5,586 | 5,511 | +75 | 8,639 |
| Jul-26 | 5,592 | 5,529 | +63 | 3,591 |
| Sep-26 | 5,580 | 5,511 | +69 | 2,006 |
NY extended Friday’s breakout, with strength led by the back months. Volume jumped to 32,569, confirming that Friday’s rally was not a one-day anomaly. US stocks fell to 1,698,135 tons, adding subtle bullish weight.
Volume, Open Interest & COT
New York
- Volume (Mon): 32,569 (vs 26,360 Fri)
- OI: Monday’s OI not yet posted; last confirmed reading 120,883 Fri
Surging volume with rising prices means fresh participation — but Friday’s nearly flat OI (+75) still implies most of the rally was short-covering. Monday’s higher volume should bring the first signs of whether new longs are finally entering.
London
- Volume (Mon): 27,222 (vs 28,995 Fri)
- OI: Not yet posted (last confirmed: 173,469)
London’s inability to add OI on Friday remains the important signal: the rally continues to be driven by shorts exiting, not new longs positioning. Monday volume was respectable, but the market still lacks commitment from speculative buyers.
COT Summary
The latest UK cocoa COT report shows a market still heavily dominated by commercial hedgers, who hold roughly 40% of total open interest on both the long and short side, reflecting the ongoing need for risk-management amid volatile supply conditions. Swap dealers remain modest participants, representing about 5% of longs and 13% of shorts, mainly facilitating structured hedging rather than directional trading. The most important group — Managed Money — continues to display a strongly bearish stance: funds hold 31,064 longs against 29,696 shorts, but the real weight lies in the fact that speculative shorts have been steadily rising in recent weeks, driving the market’s oversold positioning. Other reportables (small institutional traders) hold relatively neutral exposure, while non-reportables (retail/speculative small traders) remain lightly positioned with a slight net-short bias. Overall, the structure signals a market where commercials are hedging aggressively, funds are leaning short, and speculative pressure remains skewed toward the downside, setting the stage for continued volatility and the potential for sudden short-covering rallies if weather or arrivals shift unexpectedly.
“US COT data for the current period is still unavailable because the CFTC has not yet released the latest supplemental report, which is often delayed due to internal processing, data verification, or reporting backlogs.
Ivory Coast Port Arrivals
- Ivory Coast arrivals: 718,000 tons as of Nov 30, down 2.3% YoY
- Weekly deliveries: 100,000 tons (up from 92,000 YoY)
- Weather: Rains remain above average across key regions; supportive for Feb–Mar main crop pods; risks of Harmattan still not yet active
Arrivals, however, are materially stronger year-on-year and significantly ahead of last week’s pace. Ivory Coast cumulative arrivals reached 718,000 tons as of Sunday, compared with 618,000 tons at the same point last week, and compared with 735,000 tons on the same Monday last season. For context, last season’s previous-week arrivals stood at just 643,000 tons, meaning this year’s crop flow is tracking higher than last year’s early-season performance despite weather uncertainties. This reinforces that supply stress is uneven — the fundamental tightness is driven more by forward deficits, not immediate arrivals collapse.
Stocks (Certified)
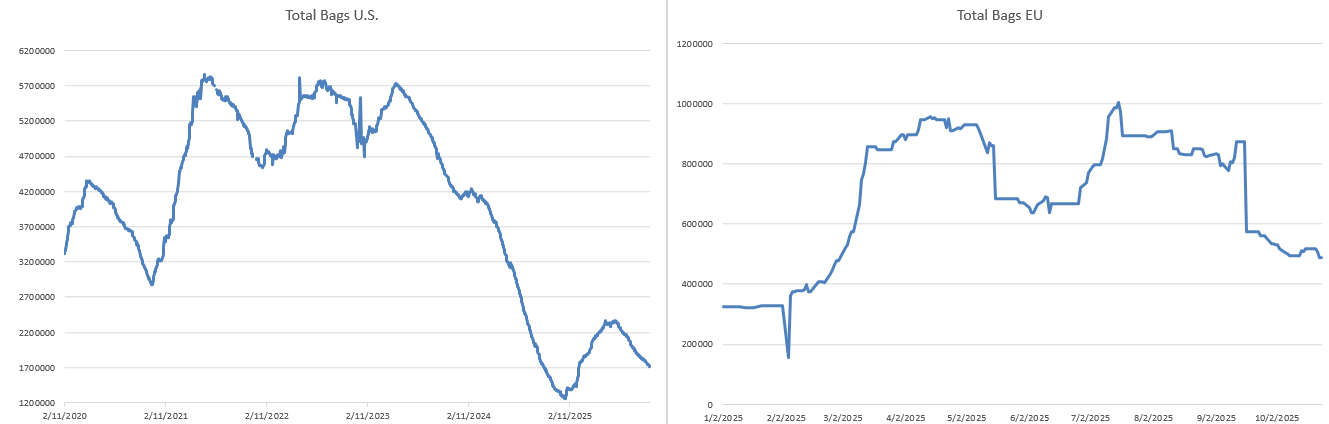
- US: 1,698,135 tons (down from 1,711,039)
- UK: 619,844 tons (up sharply from 605,000)
UK certified stocks continue to rise because European demand for exchange-deliverable cocoa remains softer and buyers are still relying more on off-exchange physical supply channels, leaving more bags to flow into the London system. In contrast, US certified stocks keep falling as processing demand is stronger relative to available exchange-grade beans, and US grinders are drawing down inventories faster than fresh cocoa is arriving. The structural gap between the two markets reflects both regional processing dynamics and quality availability: Europe is receiving more beans meeting certification standards, while the US is consuming through its stockpile with limited replenishment.
Key Drivers Today
- If Monday’s OI (when published) shows longs entering, the rally continues.
- If OI drops again, expect a fade — typical of short-covering exhaustion.
- Watch UK Mar-26 around 4,100; losing that level will trigger algo selling.
- NY Mar-26 support sits at 5,500; still firmly bullish above that.
Intraday Expectation for 2/12/2025
Cocoa is showing a short-term uptrend on the 5-minute chart, with price holding above the key moving averages, but momentum is clearly weakening: RSI is near overbought, Stochastics have turned down, MACD is flattening, and OBV is no longer rising—suggesting the intraday rally is losing strength and a pullback toward 5480–5450 is likely. On the 1-hour chart, cocoa has made a legitimate bounce after weeks of decline and has reclaimed the 10/20/50 MAs, but it has now run directly into the 200-period MA, which is a major resistance zone around 5600–5750. Momentum here is also fading, with RSI rolling over, Stochastics giving a bearish crossover, and MACD flattening out, all pointing to a possible short-term rejection and consolidation between 5380 and 5450. On the daily chart, the broader trend is still clearly down, with cocoa trapped inside a large descending channel stretching from the May 2024 ATH down to the current 5500 zone. However, the recent bounce off the lower boundary of the channel is the first meaningful attempt at a bottom in months: Stochastics have crossed bullish from oversold, MACD is turning upward, and RSI is stabilizing around mid-range. Despite this early strength, the long-term bearish structure remains intact unless cocoa can break decisively above 6000–6500. In short, the market is trying to reverse, but the bounce is fragile, momentum is weakening on the lower timeframes, and the larger downtrend still dominates.
If you notice any discrepancies in these figures or have extra information, please email hello@cocoaintel.com or leave a comment – corrections and additional insights are always welcome.