Daily Cocoa Market Report (28 Nov 2025): Cocoa Futures Surge on ICCO Deficit Cut and Short-Covering Rally
Cocoa futures surged driven by weather delays, tightening supply signals, and aggressive short-covering. Volumes jumped across both exchanges, confirming real participation while ICCO’s revised deficit outlook keeps the market on edge.


Cocoa rallied sharply on Friday as traders responded to tightening fundamentals and aggressive short-covering. ICCO’s updated quarterly report added fuel, cutting the 2024/25 global cocoa surplus estimate to 49,000 MT (down from 142,000 MT) and trimming global production projections. With the US market open again after Thanksgiving and liquidity returning, futures surged across both exchanges. London led the move, driven by weather anxiety, arrival delays, and persistent short positioning. The rally was broad, decisive, and fundamentally justified — the strongest single-day performance of the week.
Policy & Industry Developments
No new regulatory developments today. Markets continued to evaluate the implications of the EU’s one-year EUDR delay, but Friday’s rally was driven overwhelmingly by ICCO’s major supply downgrade, overshadowing policy considerations.
The November 2025 ICCO bulletin reveals a cocoa market still stuck in a severe structural deficit, with only marginal signs of improvement. The 2023/24 season closes with world production edged up to 4.365 million tonnes compared to the previous 4.369 million estimate—essentially flat—while 2024/25 output is now projected at 4.698 million tonnes, a sizable year-on-year gain of +7.6% (+333,000 tonnes). However, grindings are moving in the opposite direction: 2023/24 grindings were revised slightly upward to 4.810 million tonnes, but demand is now forecast to fall to 4.602 million tonnes in 2024/25, a -4.3% contraction driven by weak processing margins, high input costs, and constrained factory throughput. Despite improved production, the structural imbalance remains: the 2023/24 deficit of -489,000 tonnes narrows dramatically to only -49,000 tonnes in 2024/25, but a deficit is still a deficit—meaning the market continues drawing down stocks rather than rebuilding them. End-of-season inventories rise only modestly from 1.275 to 1.324 million tonnes (+49,000 tonnes or +3.8%), far from enough to repair the multi-year depletion. Meanwhile, the stocks-to-grindings ratio rises from 26.5% to 28.8%, which eases near-term tightness but remains historically low for a market emerging from back-to-back deficits. In essence, ICCO’s revised figures paint a market that is “less catastrophic but still undersupplied”: supply is recovering faster than expected, demand is softening due to cost pressures, yet global stockpiles remain fragile and inadequate for resilience. This reinforces a medium-term bullish undertone—any weather disruption, pest issue, or logistical bottleneck in West Africa could quickly push the market back into an even deeper deficit.
Certified Stock Position
| Region | 26 Nov 2025 | 28 Nov 2025 | Change |
|---|---|---|---|
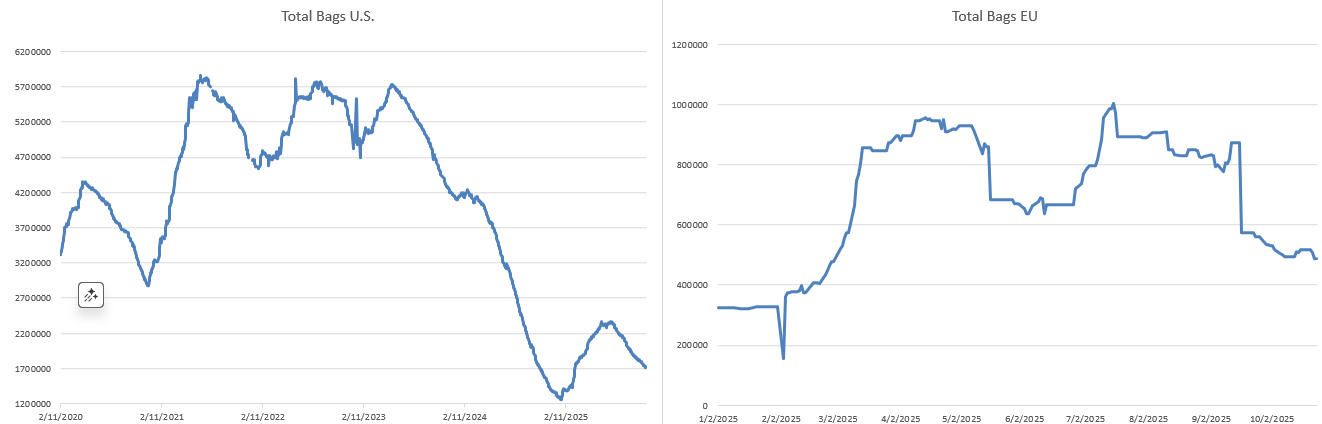
| US | 1,709,185 | 1,711,039 | +1,854 |
| UK | 576,875 | 605,000 | +28,125 |
A small US stock build (+1,854 bags) — directionally irrelevant and still within normal noise. The major development is the sharp UK stock jump of 28,125 bags, reflecting a surge in certified inflows into the London system. While not enough to shift the structural deficit narrative, the increase temporarily cushions near-term availability in Europe. Overall impact: mildly bearish for the day, but overshadowed by larger global supply concerns.
Futures Performance — ICE US (New York)
| Contract | Close# 28 Nov | Close# 26 Nov | Change vs Prev Day | Volume (28 Nov) |
|---|---|---|---|---|
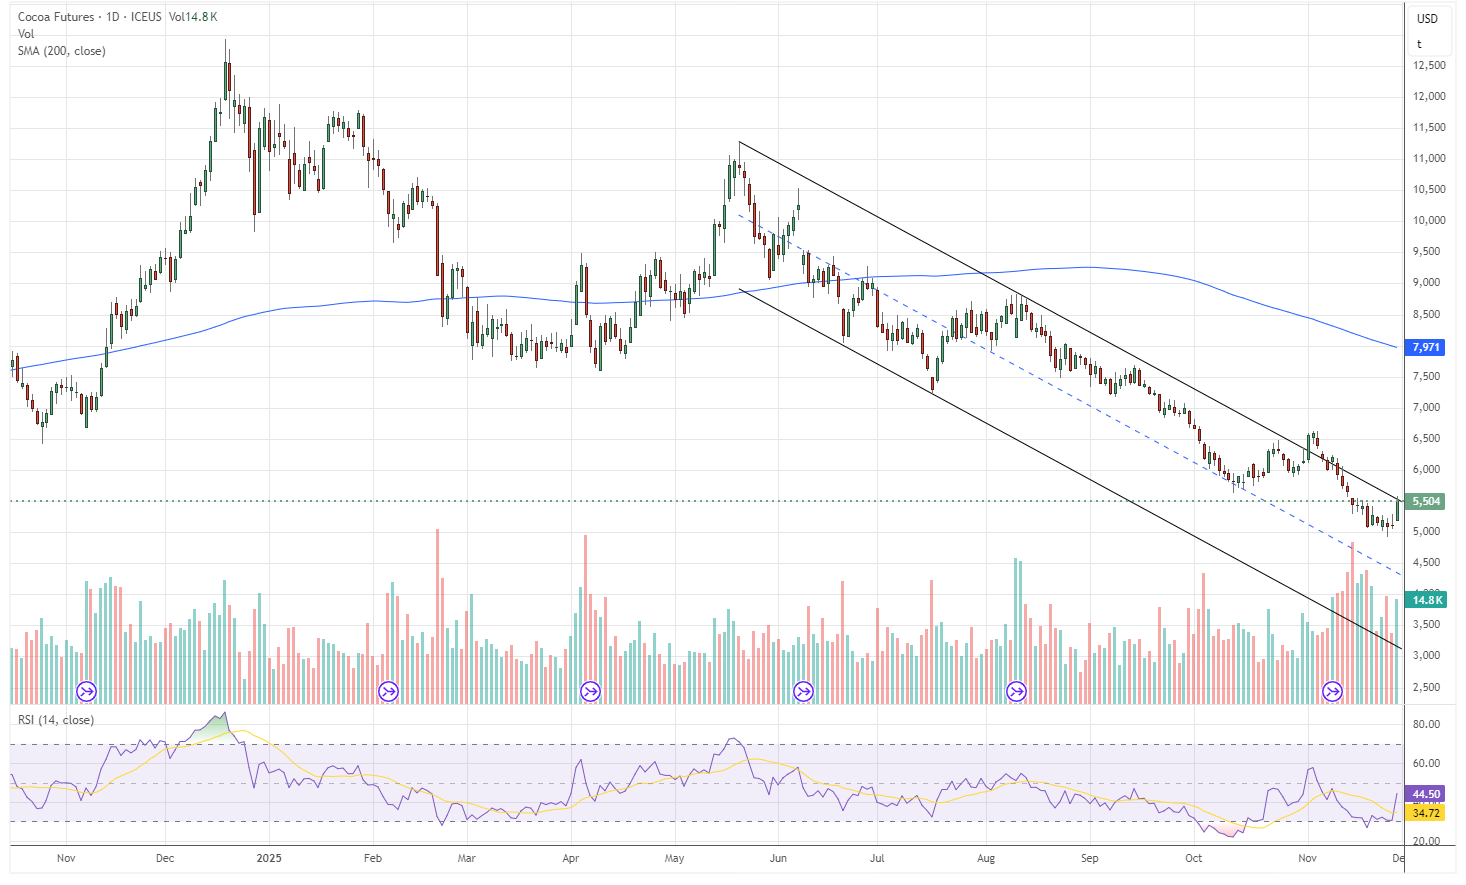
| Dec-25 | 5,404 | 4,993 | +411 | 411 |
| Mar-26 | 5,504 | 5,151 | +353 | 15,342 |
| May-26 | 5,562 | 5,177 | +385 | 6,624 |
| Jul-26 | 5,578 | 5,170 | +359 | 2,320 |
| Sep-26 | 5,556 | 5,224 | +332 | 1,455 |
New York surged across the curve, fully reversing the pre-Thanksgiving stagnation. The ICCO report and oversold technicals triggered widespread short-covering. Volume was strong, confirming real participation rather than algorithmic drift.
Futures Performance — ICE Europe (London)
| Contract | Close# 28 Nov | Close# 27 Nov | Change vs Prev Day | Volume (28 Nov) |
|---|---|---|---|---|
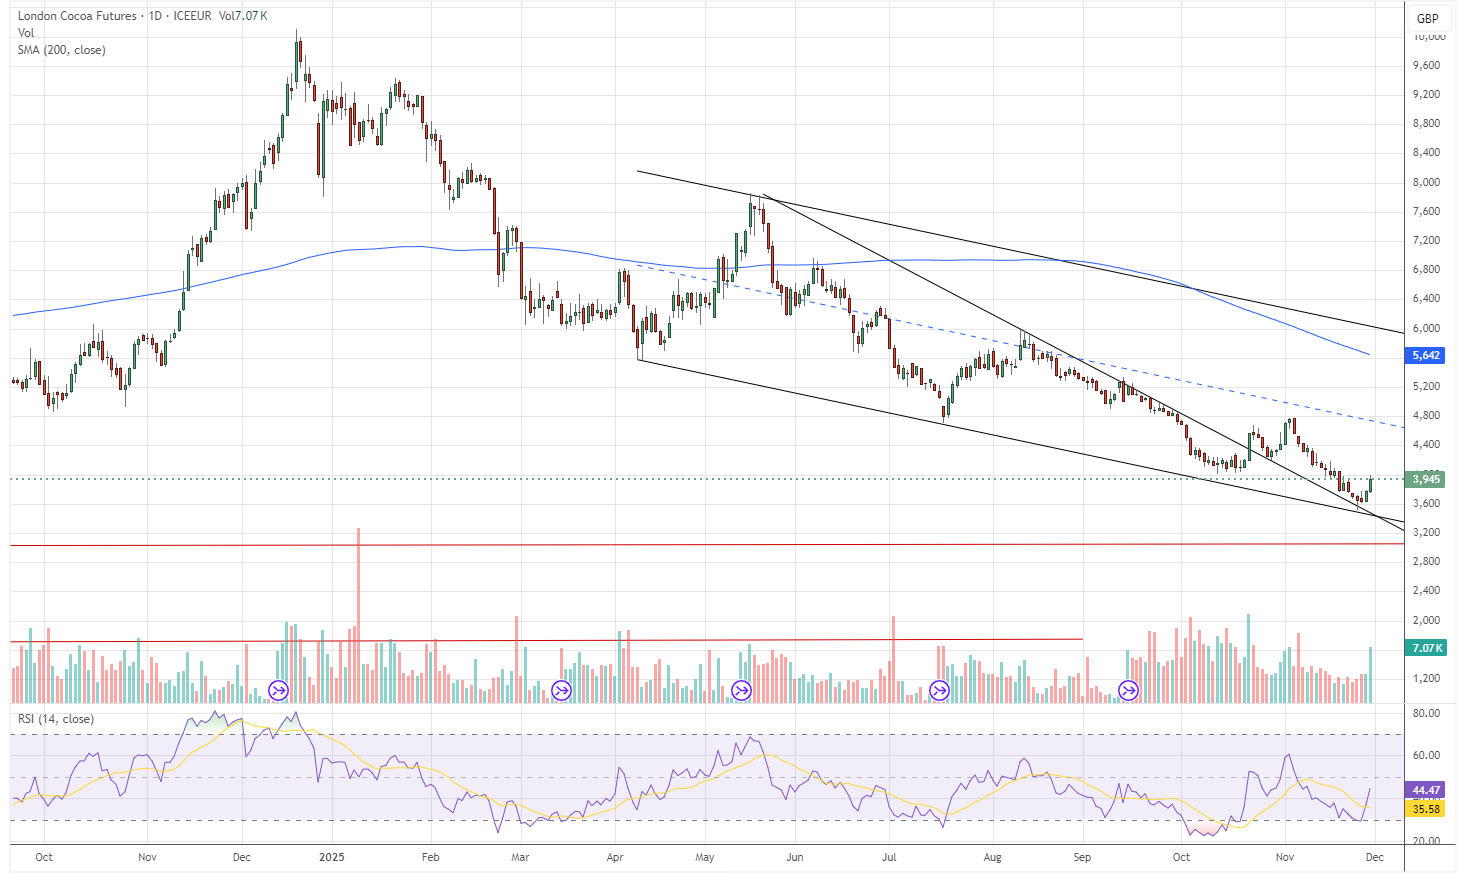
| Dec-25 | 3,998 | 3,780 | +218 | 7,190 |
| Mar-26 | 4,117 | 3,910 | +206 | 10,963 |
| May-26 | 4,134 | 3,932 | +202 | 4,050 |
| Jul-26 | 4,145 | 3,961 | +184 | 2,904 |
| Sep-26 | 4,141 | 3,968 | +173 | 2,014 |
Stronger volumes confirm the move was legitimate, not thin-liquidity noise.
US–UK Futures Spread
Using GBP/USD = 1.324 and London Mar-26 = 4,117 GBP, the USD equivalent is:
4,117 × 1.324 ≈ $5,454
New York Mar-26 closed at $5,504.
Resulting spread:
NY – London = $50, extremely narrow, indicating near-parity in market stress signals.
This confirms Europe is now pricing the same weather-driven tightening as NY — a strong bullish sign.
Volume & Open Interest
New York (ICE US)
- Volume: 26,360
(vs 19,775 on Wednesday — Thursday was Thanksgiving, no trading) - Open interest: 120,786
(Wednesday’s official figure — Friday OI not published yet)
US trading snapped back after the holiday, with volume rebounding sharply from Wednesday’s thin pre-Thanksgiving session. Because Friday’s OI is unknown, the only safe conclusion is that participation increased, but whether this was new long building or pure short-covering cannot be confirmed.
Given the scale of the rally, the most probable interpretation is short-covering dominated, similar to London — but we will only know with certainty once Monday’s OI data is posted.
London (ICE Europe)
- Volume: 28,995
(vs 18,664 on Thursday) - Open interest: 173,469
(Thursday — down from 175,486 on Wednesday; Friday OI not yet published)
London’s rally continues to reflect short-covering pressure, not confident long accumulation. The drop in OI from Wednesday to Thursday confirms that funds were reducing exposure as prices rose — a classic capitulation signal. When price rises and OI falls, it means shorts are being forced out, not that new longs are building.
This behavior aligns with the market’s growing weather anxieties and the ICCO surplus downgrade, both of which caused shorts to retreat rather than fight the trend.
West Africa Supply Situation
Weather disruptions intensified across Ghana and Côte d’Ivoire. Continued rain is delaying pod collection and raising bean moisture levels. LSEG confirms ongoing harvest delays in eastern Côte d’Ivoire and major Ghana producing zones. Roads remain muddy, and delivery to buying centers is slowing. These weather bottlenecks are now directly reflected in price action and arrival expectations.
Weather Conditions
Heavy rainfall across eastern Côte d’Ivoire and southern Ghana continues to impede harvesting and worsen transport conditions. Western North Ghana is particularly affected, with high humidity restricting drying capacity. These conditions suggest arrivals will remain depressed for the next 1–2 weeks.
Harmattan Risk Forecast
Still weak-to-moderate onset expected. A delayed Harmattan means fungal pressure remains elevated, hurting early pod formation. The mid-crop risk profile remains negative.
Outlook
The market has shifted from neutral to decisively bullish after ICCO’s shock revision. Short-covering began Friday, but the structural story remains the dominant driver: poor arrivals, weakening pod counts, heavy rain, and uncertain recovery in West African output. Unless weather improves rapidly, further upside is likely.
What to Expect Monday (1 Dec 2025)
- Expect continued upside momentum as traders digest ICCO’s downgrade.
- Watch for updated arrival numbers — they will set the tone for December.
- London likely to stay volatile as shorts reassess.
- Weather remains the primary catalyst; any break in rainfall would slow the rally.
- Spread may widen again if London leads.
If you notice any discrepancies in these figures or have extra information, please email hello@cocoaintel.com or leave a comment – corrections and additional insights are always welcome.