Daily Cocoa Market Report (5 Dec 2025): Cocoa Futures Breaks Out


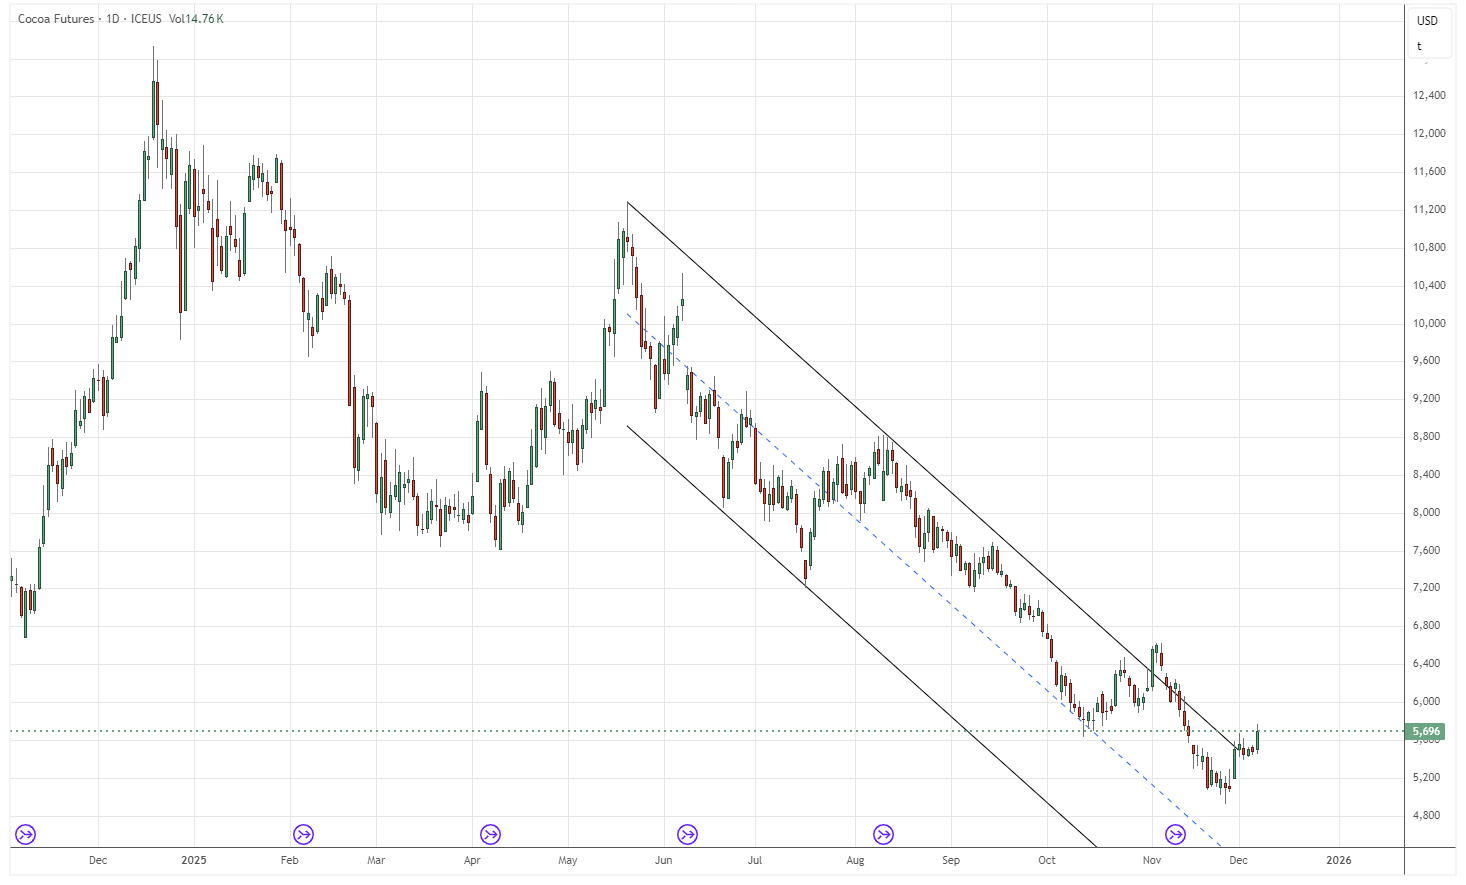
The March cocoa contract in New York finished the session with a solid advance of $198(+3.69%), settling at $5,694. Over the course of the week, the contract accumulated a gain of $189 (+3.45%). For four consecutive sessions prices had been trapped between the 10-day moving average ($5,374) and the 20-day moving average ($5,500), but today’s decisive move broke that consolidation to the upside. This marks the first close above the 20-day average since early December and shifts the immediate upside target toward the 50-day average, currently near $5,932. Money managers remain net short in both exchanges, meaning that continued strength could force short sellers to cover positions and amplify the rally.
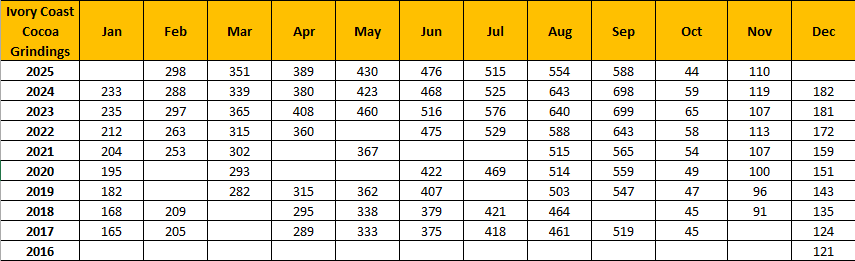
Cocoa grindings in Côte d’Ivoire reached 100,771 tonnes for Nov 2024–Nov 2025, a decrease of 19,095 tonnes (-7.6%). But this is an increase of 50% compared to October 2025.
The 2025/26 grinding season begins on a weak statistical footing, with October grindings falling –25% YoY. At face value, this suggests a slow start to the season. However, a deeper look into supply dynamics and mill behavior reveals a more complex — and in some respects, more constructive — picture.
The steep October decline was largely the result of temporary supply tightness, not a structural deterioration in demand. Earlier this year, Côte d’Ivoire mills faced intense pressure from poor pod development, a reduced mid-crop, and logistical constraints that limited bean arrivals during late Q3 and early Q4. Those supply bottlenecks forced mills to reduce throughput even as underlying demand remained stable.
According to TRS, tree canopies in both Côte d’Ivoire and Ghana have not recovered from previous environmental stress, which has limited pod formation. TRS notes that pod development in Côte d’Ivoire is sitting at levels not seen in roughly two decades, and overall farm maintenance has not shown meaningful improvement in either producing country.
For Ghana, production forecasts vary widely. The country’s External Agricultural Service estimates 750,000 tonnes for 2025/26—unusually high relative to recent performance. CRA places its estimate closer to 550,000 tonnes, while TRS projects 519,000 tonnes for the season.
ICCO recently projected a 49,000-tonne surplus for the 2024/25 cycle but did not issue guidance for 2025/26. CRA has since revised its 2024/25 estimate downward by 33,000 tonnes, implying an 8,000-tonne deficit, and trimmed its 2025/26 surplus forecast by 20,000 tonnes to 265,000 tonnes. TRS also cut its expectations, reducing the 2024/25 figure by 46,000 tonnes, leaving a 41,000-tonne surplus, and lowering its 2025/26 surplus estimate by 41,000 tonnes to 107,000 tonnes.
The market is still waiting for the official ruling on the EUDR, expected around mid-month. Meanwhile, the BCOM index is scheduled to undergo its annual rebalancing in early January, with TRS anticipating an increase of 35,000–40,000 contracts in exchange open interest as a result.
Weather Conditions
Weather remains the decisive factor shaping expectations for the 2025/26 main crop. Côte d’Ivoire and Ghana continue to face inconsistent rainfall, and both regions are now entering the period when early Harmattan winds can quickly strip moisture from soils and amplify heat stress. TRS reports that vegetative recovery remains poor, with tree canopies still thin and unable to retain moisture effectively. This lack of canopy density leaves farms highly exposed to any intensification of the Harmattan in the coming weeks. Although isolated showers have appeared in parts of West Africa, they have not been sufficient to offset the cumulative moisture deficit or improve crop conditions in a meaningful way. Overall, the weather profile remains fragile and tilted toward downside risk for pod development unless substantial rains return — an increasingly unlikely scenario as the dry season progresses.
Futures Performance
London Cocoa (ICE Europe)
| Contract | CLOSE# 4 Dec | CLOSE# 5 Dec | Change |
|---|---|---|---|
| Dec-25 | 3,847 | 3,944 | +97 |
| Mar-26 | 3,973 | 4,067 | +94 |
| May-26 | 3,980 | 4,064 | +84 |
| Jul-26 | 3,964 | 4,068 | +104 |
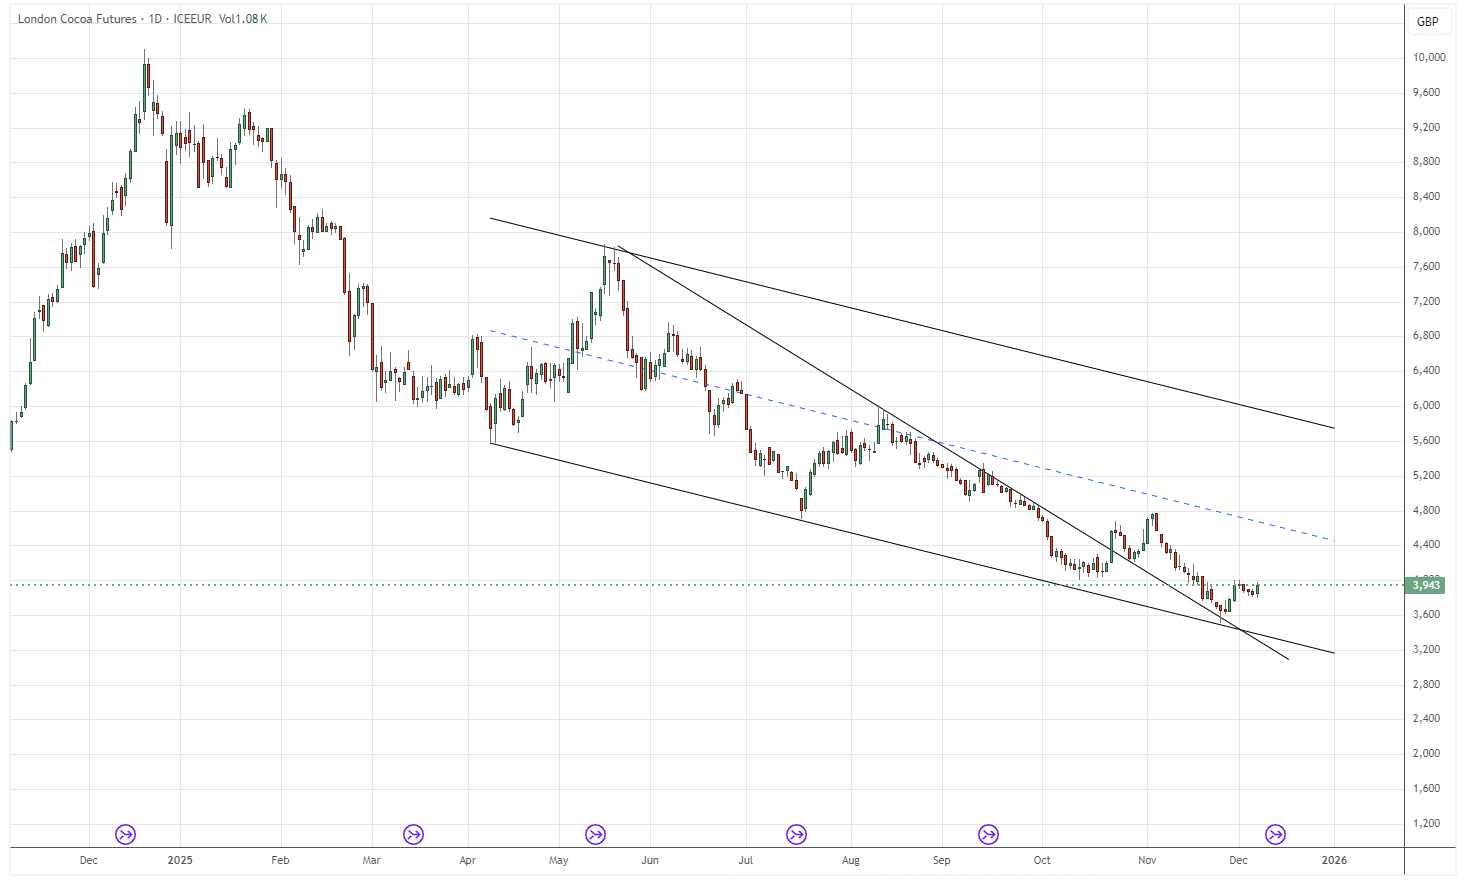
London also posted a broad rebound, with gains of +84 to +104. Strength was consistent along the curve, signaling renewed buying interest after Thursday’s dip.
New York Cocoa (ICE US)
| Contract | CLOSE# 4 Dec | CLOSE# 5 Dec | Change |
|---|---|---|---|
| Dec-25 | 5,500 | 5,643 | +143 |
| Mar-26 | 5,496 | 5,694 | +198 |
| May-26 | 5,507 | 5,712 | +205 |
| Jul-26 | 5,535 | 5,717 | +182 |
NY cocoa rallied strongly across all near-month contracts, with gains of +140 to +205, led by May-26. The curve remains firmly backwardated, reflecting persistent supply tightness.
Contango & Backwardation
Based on the 5-Dec CLOSE curve, London cocoa displays a relatively orderly forward structure with a mild front-end contango from Dec-25 into Mar-26 and May-26, followed by a shallow continuation into Jul-26. After July, the curve flattens rather than deepening into backwardation, with Sep-26, Dec-26, and the early-2027 contracts pricing within a tight band only modestly above the nearby months. This configuration suggests the market is pricing in short-term firmness, but without projecting severe mid-curve tightness as seen earlier in the year. The lack of deep backwardation in the 2026 strip indicates that London traders see supply constraints as persistent but not intensifying.
New York cocoa, by contrast, maintains a steeper backwardated profile, with Dec-25 discounted relative to Mar-26, May-26, and Jul-26. The curve peaks around mid-2026 before gradually softening through Dec-26 and into 2027. This shape signals that US traders still expect acute tightness during mid-2026, driven by weak West African forward crop expectations, but also anticipate some easing further out as potential supply recovery, demand rationing, or stock reallocation becomes more likely.
US–UK Spread Update
$5,694−(4,067£×1.333$/£)=$277
The US premium over London increased to $277 from $204 previous day.
Volume & Open Interest
New York Cocoa (ICE US)
| Date | Volume | Open Interest |
|---|---|---|
| Dec 5, 2025 | 26,906 | — |
| Dec 4, 2025 | 23,397 | 120,724 |
| Dec 3, 2025 | 16,536 | 119,200 |
| Dec 2, 2025 | 28,321 | 119,508 |
| Dec 1, 2025 | 32,569 | 120,188 |
London Cocoa (ICE Europe)
| Date | Volume | Open Interest |
|---|---|---|
| Dec 5, 2025 | 23,428 | — |
| Dec 4, 2025 | 21,792 | 160,335 |
| Dec 3, 2025 | 19,668 | 159,447 |
| Dec 2, 2025 | 27,341 | 159,123 |
| Dec 1, 2025 | 27,222 | 160,057 |
Cocoa volumes increased on December 5 in both New York and London as the market rallied, indicating renewed trader engagement after the mid-week slowdown. NY Cocoa volume climbed to 26,906, up from 23,397 the previous day, while London rose to 23,428 from 21,792. Despite the pickup in trading activity, open interest for both markets has not yet been published.
Earlier in the week, open interest trends showed steady positioning: NY remained clustered around the 119k–121k range, while London held firm in the 159k–160k corridor. This stability suggests that the recent price rebound was driven more by short-term participation and opportunistic buying rather than a structural repositioning by larger funds.
Overall, the volume rebound supports the strength of Friday’s rally, even though open interest data for December 5 will be required to assess whether new longs entered the market or whether the move was primarily short covering.
COT Analysis
Last week’s (up to 2 December 2025) UK Cocoa COT report (Futures + Options) shows a market dominated by liquidation rather than trend-driven positioning, with open interest collapsing from 236,050 to 194,811 — a massive 17.4% reduction that signals forced exits, short-covering, and extreme volatility. Producers sharply cut both longs and shorts (-13.5% and -15.6%), meaning commercials largely stepped back from the market rather than expressing a directional view, a clear sign that price movements have become too violent for normal hedging operations. This removal of producer shorts reduces downward pressure and offers a mildly bullish short-term effect, though the simultaneous drop in producer longs shows weak confidence at current price levels. Money managers increased both longs (+6.4%) and shorts (+3.8%), but remain heavily net-short, which indicates that speculative sentiment is still bearish even as some bottom-pickers tentatively enter the market. Overall, the week reflects instability: the huge OI collapse points to a short-covering bounce environment rather than a genuine bullish reversal. Price action was likely sharp, disorderly, and driven by liquidation rather than conviction.
It is also important to note that the US cocoa COT data remains outdated, so the overall speculative picture is incomplete, and current market interpretation relies mainly on the more up-to-date UK numbers.
Certified Stocks
| Region | Previous Day | Today | Change |
|---|---|---|---|
| US | 1,682,716 | 1,681,896 | –820 |
| UK | 712,031 | 739,688 | +27,657 |
Intraday / Short-Term Outlook
Cocoa has staged a strong multi-timeframe bounce, breaking the short-term bear trend when it closed above 5600, but it is still trading inside a larger bearish structure. On the 5-minute chart, momentum remains bullish with a healthy flag formation, though short-term indicators are flattening and price must hold 5660–5700 to maintain intraday structure. The 1-hour chart shows the first convincing bullish reversal in months, with price breaking above major moving averages and OBV finally turning up, but overbought oscillators suggest a pullback toward 5550–5620 before any continuation. The daily chart confirms a meaningful rebound, yet the broader trend remains bearish because the 5900–6000 zone—anchored by the 50-day MA—is a major resistance area where bear-market rallies often fail. On the weekly chart, cocoa has bounced cleanly from the 200-week MA, but long-term indicators remain bearish and a true trend reversal requires weekly closes above 6000–6200. In summary, while breaking above 5600 ended the short-term bear trend, the medium- and long-term bear trends remain intact unless bulls can decisively clear the 5900–6000 region.
If you notice any discrepancies in these figures or have extra information, please email hello@cocoaintel.com or leave a comment – corrections and additional insights are always welcome.