Daily Cocoa Market Report (2 March 2026): Cocoa Rebounds on Positioning Reset as Supply Signals Turn Mixed and ICCO Confirms Global Surplus


May cocoa turned higher early Monday after opening at fresh contract lows. Traders are weighing Ivory Coast’s decision last week to delay the start of the mid-crop to March, a move that effectively reduces the official farmgate price. That adjustment could encourage producers to accelerate sales and help ease supply bottlenecks.
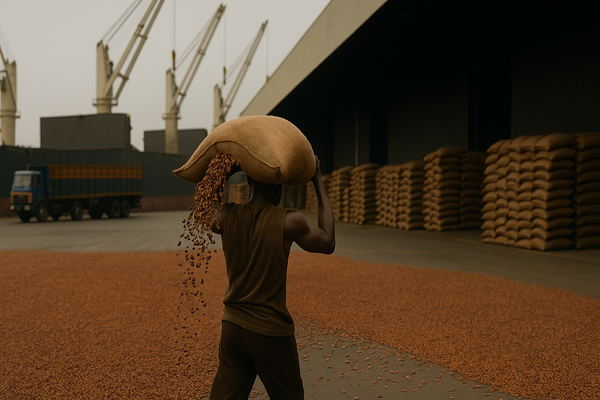
Ivory Coast cocoa arrivals
Ivory Coast cocoa arrivals for the 2025/26 season were reported at 1.335 million metric tons as of March 1, down 3.7 percent compared with the same period last year, according to port data released Monday. The season began on October 1. Exporters had previously estimated arrivals at similar levels.
Weekly flows between February 23 and March 1 totaled approximately 28,000 tons, with around 15,000 tons delivered to Abidjan and 13,000 tons to San Pedro. That compares with 18,000 tons recorded during the same week last season.
ICCO Quarterly Bulletin
According to the ICCO February 2026 Quarterly Bulletin of Cocoa Statistics, updated data through early February 2026 show that the global cocoa market for the 2024/25 season has shifted toward a modest surplus. World production is now estimated at around 4.728 million tonnes, an increase of approximately 8.4 percent compared to the prior year, while global grindings are estimated at 4.606 million tonnes, down 4.2 percent from 2023/24. The combination of higher production and weaker grindings has resulted in a supply surplus of roughly 75,000 tonnes.
End-of-season stocks were revised upward to about 1.347 million tonnes, representing an increase of nearly 5.9 percent year-on-year. The stocks-to-grindings ratio climbed to 29.2 percent, compared with around 26.4 percent in the previous season, signaling a relative improvement in stock coverage against demand. These revisions reflect newly reported data received by the ICCO Secretariat and adjustments in production and demand indicators from major origins and consuming countries.
Weather
Unusually heavy rainfall across most of Ivory Coast’s cocoa-growing regions has improved expectations for the upcoming March to August mid-crop, according to farmers cited by Reuters. The stronger precipitation, which exceeded seasonal averages in several areas, is expected to support pod development and potentially extend the duration of the mid-crop harvest. Farmers anticipate that volumes harvested in March and April will be significant, with activity accelerating further from May onward.
These improved field conditions follow the regulator’s recent decision to move the official start of the mid-crop to March and to lower the farmgate price, a measure aimed at stimulating bean sales and easing supply bottlenecks. While the main crop price was previously set at 2,800 CFA francs per kilogram, authorities are expected to announce a reduced price for the mid-crop.
Farmers in key producing regions including Divo, Soubre, Agboville, Abengourou, Daloa, Bongouanou and Yamoussoukro reported healthy tree conditions and strong pod formation. Some growers noted that although temperatures remain elevated, rainfall has been sufficient to sustain tree vigor, with cumulative precipitation in parts of Divo reportedly more than double the five-year average. Weekly average temperatures ranged between 27.7 and 31.5 degrees Celsius.
Despite improved crop prospects, farmers indicated that buyer presence at origin remains limited. Overall, the weather developments point to supportive mid-crop production potential, which could help stabilize supply expectations if rainfall patterns persist.
Mondelez
Mondelez International’s CEO Dirk Van de Put expressed concern that surplus stocks could prompt farmers or marketing boards to restrict future supply if prices weaken, potentially setting the stage for renewed volatility further down the road.
As part of Mondelez’s response, he highlighted efforts to diversify cocoa supply into Brazil, Ecuador, India and Indonesia and ongoing work with West African partners to improve yields and stabilize long-term market conditions.
Futures Performance
ICE US Cocoa (CC)
| Contract | 27-Feb | 02-Mar | Change | % |
|---|---|---|---|---|
| Mar-26 | 2,798 | 2,931 | +133 | +4.75% |
| May-26 | 2,898 | 2,987 | +89 | +3.07% |
| Jul-26 | 2,949 | 3,032 | +83 | +2.81% |
| Sep-26 | 3,009 | 3,082 | +73 | +2.43% |
| Dec-26 | 3,102 | 3,148 | +46 | +1.48% |
ICE US cocoa staged a sharp rebound following the 27-Feb liquidation. The front month Mar-26 rose from 2,798 to 2,931, a gain of 4.75 percent on a close-to-close basis. Strength faded progressively along the curve. May gained 3.07 percent, Jul 2.81 percent, Sep 2.43 percent, and Dec only 1.48 percent.
The performance gradient is technically important. When the nearby contract materially outperforms deferred months, the move is usually driven by short covering rather than structural repricing of forward supply. The curve remains in contango and there was no aggressive revaluation of the back end. If the rally were fundamentally driven by tightening supply, stock draws, or grind surprises, deferred contracts would have responded more proportionally.
The structure indicates a positioning reset. The magnitude of the Mar-26 rebound suggests forced liquidation on 27-Feb followed by mechanical re-engagement on 02-Mar. There was no curve inversion and no evidence of physical squeeze dynamics.
ICE London Cocoa (C)
| Contract | 27-Feb | 02-Mar | Change | % |
|---|---|---|---|---|
| Mar-26 | 2,033 | 2,078 | +45 | +2.21% |
| May-26 | 2,061 | 2,115 | +54 | +2.62% |
| Jul-26 | 2,109 | 2,160 | +51 | +2.42% |
| Sep-26 | 2,143 | 2,192 | +49 | +2.29% |
| Dec-26 | 2,200 | 2,243 | +43 | +1.95% |
ICE London cocoa also recovered but with lower volatility and more even participation across the strip. Mar-26 rose from 2,033 to 2,078, a gain of 2.21 percent. May increased 2.62 percent, Jul 2.42 percent, Sep 2.29 percent, and Dec 1.95 percent.
Unlike New York, London did not show extreme front-end outperformance. Gains were more uniform, indicating a steadier commercial base and lower speculative stress. The absence of sharp front-led acceleration suggests that London was responding more to macro correlation and New York’s movement than to localized physical tightness.
US–UK May Spread
$2,987 − (2,115 x 1.348$/£) =$136 ton (up from $119/ton)
Volume and Open Interest
ICE US Cocoa
| Date | Total Volume | Total Open Interest |
|---|---|---|
| Feb 24 | 46,072 | 173,446 |
| Feb 25 | 48,668 | 177,313 |
| Feb 26 | 40,595 | 185,549 |
| Feb 27 | 47,749 | 189,401 |
| Mar 02 | 58,822 | Not yet reported |
In ICE US cocoa, volume increased meaningfully into the 02-Mar rebound. Trading rose from 37,191 contracts on 23-Feb to 47,749 on 27-Feb during the selloff, and then expanded further to 58,822 on 02-Mar. The key development, however, is open interest. From 23-Feb to 27-Feb, open interest climbed steadily from 169,332 to 189,401 contracts. This is a critical signal. When price declines while open interest rises, the market is not merely seeing long liquidation. It is attracting new short positioning.
This indicates that the 27-Feb weakness was driven by fresh short exposure entering the market rather than simple profit-taking from longs. The 02-Mar rally occurred on even stronger volume, suggesting that the rebound was fueled at least in part by short covering. The front-end outperformance across the curve reinforces this interpretation, as short covering tends to concentrate in nearby contracts. The decisive confirmation will come once 02-Mar open interest is published. A decline would validate covering activity, while another increase would indicate aggressive new longs entering the market.
ICE London Cocoa
| Date | Total Volume | Total Open Interest |
|---|---|---|
| Feb 24 | 43,115 | 217,253 |
| Feb 25 | 40,639 | 217,840 |
| Feb 26 | 47,919 | 218,163 |
| Feb 27 | 43,883 | 208,797 |
| Mar 02 | 38,714 | Not yet reported |
In ICE London cocoa, the positioning story differs. Volume during the same period remained stable and did not expand materially on 02-Mar. More importantly, open interest declined sharply on 27-Feb, falling from 218,163 to 208,797 contracts. When price falls and open interest contracts, the move reflects long liquidation rather than new short building. In other words, London experienced position reduction rather than speculative expansion.
The contrast between New York and London is important. New York weakness was accompanied by rising open interest, consistent with active speculative pressure. London weakness was accompanied by falling open interest, consistent with length being flushed out. The 02-Mar rebound therefore appears technical and positioning-driven, not the result of a structural change in supply or demand fundamentals. The market remains sensitive to positioning dynamics, and confirmation from updated open interest data will determine whether this bounce evolves into sustained re-risking or remains a corrective recovery.
Cocoa ICE Stocks
| Market | 27-Feb Volume | 02-Mar Volume | Change | % Change |
|---|---|---|---|---|
| US (ICE CC) | 2,174,770 | 2,190,447 | +15,677 | +0.72% |
| UK (ICE London C) | 580,313 | 593,750 | +13,437 | +2.31% |
Stock-to-Grind ratio
What to expect tomorrow
The most probable scenario is consolidation with a volatility contraction before a directional break. The market is sitting just under major psychological resistance at 3,000 while still structurally bearish on the daily timeframe. If price breaks and holds above 3,000 with expanding volume and positive momentum confirmation, continuation toward 3,020 to 3,040 is likely. That move would be driven by residual short covering. If price fails again at 3,000 and momentum rolls over on the 1-hour chart, a retracement toward 2,960 is likely, with risk extending back to the 2,930 to 2,940 zone.
Given the broader downtrend remains intact and the recent rally appears corrective rather than impulsive on the daily timeframe, the risk slightly favors a pullback unless buyers can force a decisive breakout above 3,000 early in the session.
If you notice any discrepancies in these figures or have extra information, please email hello@cocoaintel.com or leave a comment – corrections and additional insights are always welcome.