
Another Day of Cocoa Consolidation as Key Catalysts Approach (25 August 2026)


New York cocoa came under selling pressure on Tuesday, with the December 2026 contract opening at $5,944 and briefly advancing to an intraday high of $5,980 before reversing sharply lower. Prices subsequently fell by $258 from the session high to a low of $5,722, temporarily breaking below the important $5,750 support area. The decline attracted renewed buying interest, allowing the contract to recover and finish at $5,844, approximately 47.3% above the session low, although it settled at $5,829, down $116, or 1.95%. The recovery from the low demonstrated that buyers remain active around the lower boundary of the consolidation.
The latest cocoa news flow did not contain a single major fundamental development. Instead, the market continued to react to conflicting signals surrounding nearby supply and the outlook for the forthcoming 2026/27 West African crop. Reports of higher Nigerian exports, increased cumulative Ivorian arrivals and elevated exchange inventories continued to provide a bearish background.
Although cumulative Ivorian arrivals remain considerably higher than during the corresponding period last season, the latest weekly flow was weak. Approximately 3,000 tonnes were delivered during 17–23 August, compared with around 10,000 tonnes in the equivalent week last year. The slowdown is not necessarily evidence of an immediate deterioration in production because the intermediate crop is ending and the new main-crop campaign begins on 1 September. Some farmers and cooperatives may also be postponing deliveries while awaiting the new guaranteed farmgate price.
Weather conditions have once again become one of the market’s main areas of attention. Earlier in the season, farmers complained that excessive rainfall, persistent cloud cover and insufficient sunshine were increasing humidity, disrupting bean drying and raising the risk of fungal diseases. By contrast, Reuters reported on Monday that rainfall during the previous week was below average across most of Côte d’Ivoire’s cocoa-growing regions. This change does not necessarily represent a contradiction: cocoa trees require a balanced combination of regular rainfall and sunny periods, and the crop’s requirements can change as flowers and young pods develop.
According to Monday’s report, farmers said the recent combination of dry spells and sunshine had generally been beneficial, but stronger and more frequent rainfall would now be required to support the September-to-February main crop. Soubré received only around 2 millimetres of rain, approximately 12.8 millimetres below its five-year average, while Daloa recorded 1.3 millimetres, around 23.3 millimetres below average. Rainfall was also below average in several southern, central and eastern regions, although conditions in Abengourou were more favourable. Farmers warned that rainfall must remain sufficiently regular through at least late October to sustain pod development. If normal rainfall returns in September, harvesting could become more abundant between November and January; if precipitation remains limited, deliveries could begin declining sharply from late December.
The Reuters report also contained an important qualitative observation: farmers said there were not yet many pods on the trees ready to be harvested, despite the new marketing campaign beginning in approximately one week. This does not constitute a formal pod count, but it suggests that the opening of the crop may be relatively slow and that the larger portion of the harvest could be concentrated later in the season. The frequency and distribution of rainfall during September and October will therefore be more important than a single week’s accumulated rainfall.
A separate Ghanaian crop assessment was reported on 20 August. According to market reports citing Bloomberg, the Ghana Cocoa Board prepared an internal 2026/27 production estimate following field surveys and pod counts. The assessment reportedly placed the crop at approximately 650,000 tonnes, around 13% below the more than 750,000 tonnes harvested during 2025/26. This is a relevant and relatively recent pod-count signal, but I could not locate a publicly released COCOBOD document containing the underlying regional counts, sampling methodology or detailed results. It should therefore be described as an assessment attributed to COCOBOD through press reports, rather than as a formally published pod-count report.
Futures performance
New York cocoa
| Contract | 24 Aug | 25 Aug | Change | Change % |
|---|---|---|---|---|
| Sep-26 | $5,801 | $5,816 | +$15 | +0.26% |
| Dec-26 | $5,929 | $5,844 | -$85 | -1.43% |
| Mar-27 | $6,010 | $5,956 | -$54 | -0.90% |
| May-27 | $6,038 | $5,985 | -$53 | -0.88% |
| Jul-27 | $6,032 | $5,987 | -$45 | -0.75% |
New York cocoa was mixed across the first five principal maturities on 25 August relative to 24 August. Sep-26 was the sole gainer, rising $15, or 0.26%, to $5,816. The other four contracts declined by $45 to $85 per tonne, equivalent to 0.75% to 1.43%. Dec-26 was the weakest contract, falling $85, or 1.43%, to $5,844, while Jul-27 was the most resilient among the declining maturities, easing $45, or 0.75%, to $5,987.
Intraday conditions were unusually uneven. The first five contracts traded through ranges of between $3 and $258 per tonne. The expiring Sep-26 contract traded between $5,816 and $5,819 and finished at its daily low, on volume of only 36 contracts. The more actively traded Dec-26 to Jul-27 contracts recorded much wider ranges of $211 to $258. Dec-26 traded between $5,722 and $5,980 before ending at $5,844, while Mar-27 ranged from $5,820 to $6,070 and finished at $5,956.
The first five contracts finished between 0.0% and 64.9% above their respective daily lows. Excluding the exceptionally thin Sep-26 contract, the range was 47.3% to 64.9%. Dec-26 ended just below the midpoint of its daily range, while Mar-27, May-27 and Jul-27 recovered to finish 54.4%, 59.0% and 64.9% above their lows respectively.
Spread activity rose to 65.1% of total turnover from 61.1% on 24 August. Implied outright volume fell by 1,655 contracts, or 11.2%, to 13,124, indicating a modest shift back toward spread trading.
EFP activity increased to 522 contracts from 281, a rise of 241 contracts, or 85.8%. EFS volume more than doubled from 66 to 151 contracts, an increase of 85, or 128.8%. Block volume totalled 82 contracts, compared with none on 24 August.
New York futures curve
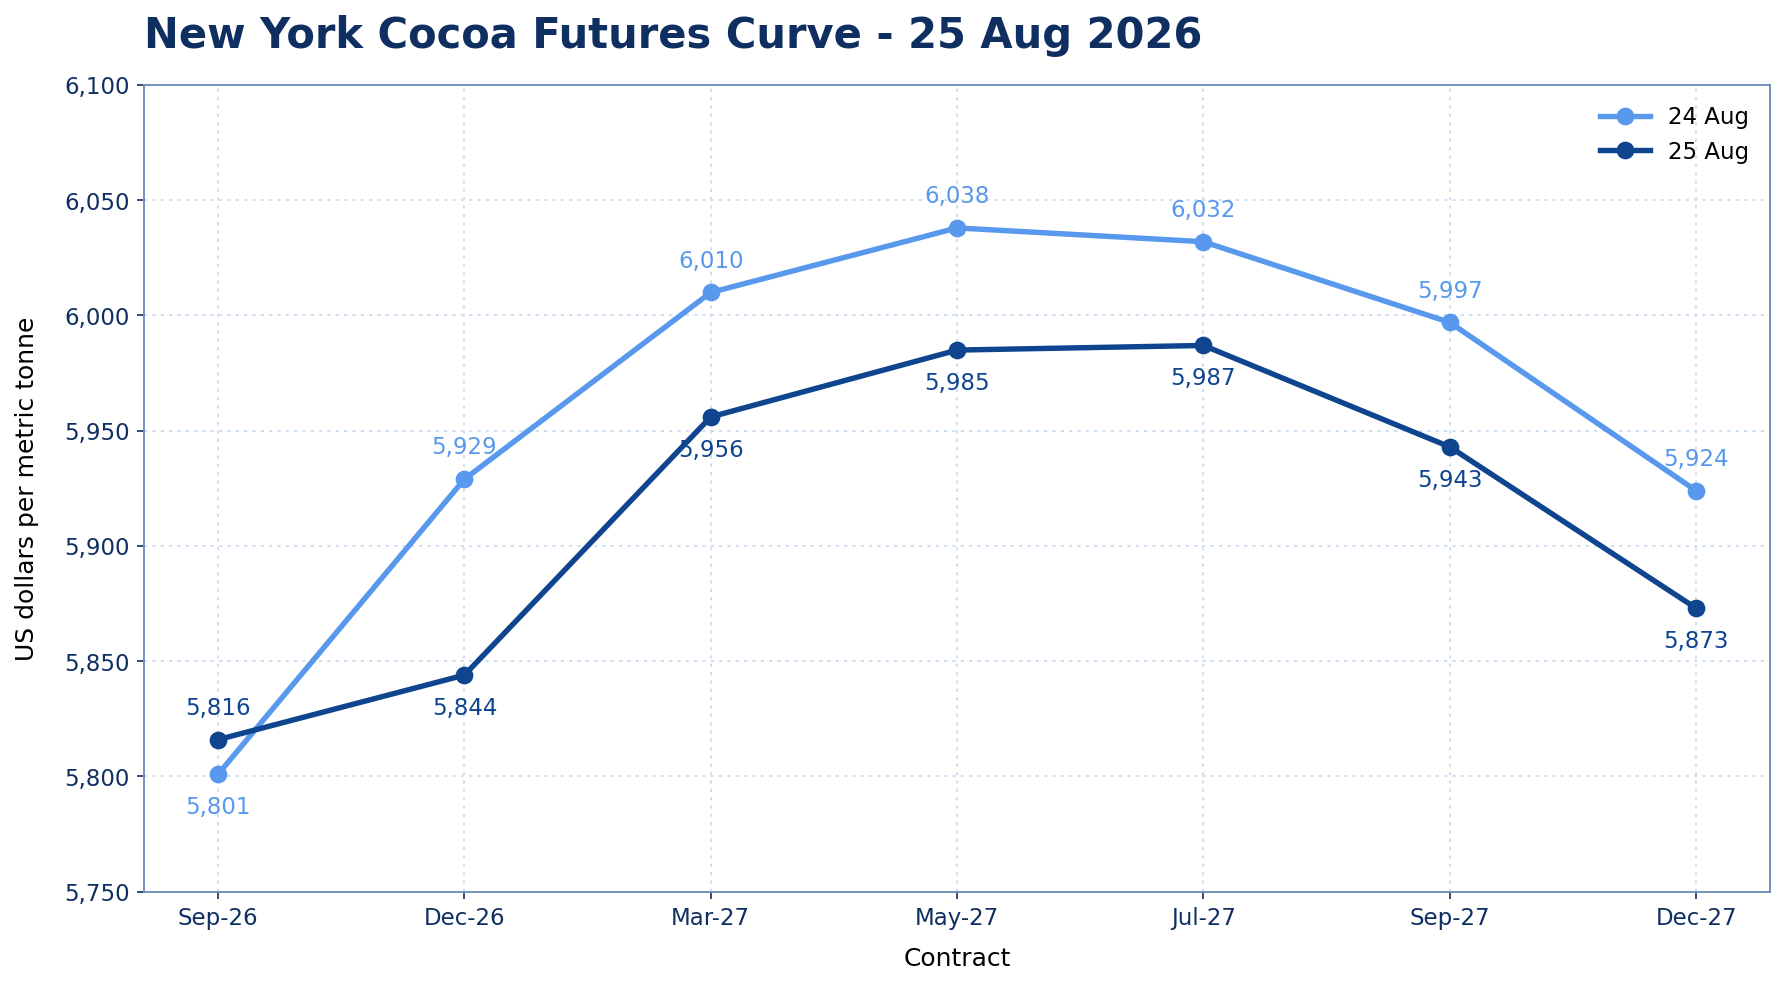
The New York curve weakened across every maturity beyond the expiring Sep-26 contract, while Sep-26 itself edged higher. The adjustment was therefore distinctly non-parallel: Sep-26 gained $15, whereas Dec-26 through Dec-27 fell by $45 to $85 per tonne.
The most important structural move occurred in the Sep-26/Dec-26 relationship. Front contango narrowed sharply from $128 on 24 August to $28 on 25 August, representing a $100 strengthening of Sep-26 relative to Dec-26. From Sep-26 to May-27, the curve now rises by $169 per tonne, compared with $237 previously. This move should be interpreted cautiously because Sep-26 traded only 36 contracts and within a $3 intraday range.
Dec-26/Mar-27 contango widened from $81 to $112, a $31 deterioration in Dec-26 relative to Mar-27. Mar-27/May-27 contango was virtually unchanged at $29, compared with $28 previously. The May-27/Jul-27 relationship moved from $6 backwardation to $2 contango, shifting the curve’s peak from May-27 to Jul-27.
Further out, Jul-27/Sep-27 backwardation deepened from $35 to $44, while Sep-27/Dec-27 backwardation eased slightly from $73 to $70. The resulting curve combines a sharply flatter, thinly traded front end with a steeper Dec-26/Mar-27 ascent, an almost flat mid-2027 segment and continued backwardation toward the end of 2027.
London cocoa
| Contract | 24 Aug | 25 Aug | Change | Change % |
|---|---|---|---|---|
| Sep-26 | £4,240 | £4,135 | -£105 | -2.48% |
| Dec-26 | £4,291 | £4,200 | -£91 | -2.12% |
| Mar-27 | £4,399 | £4,317 | -£82 | -1.86% |
| May-27 | £4,403 | £4,325 | -£78 | -1.77% |
| Jul-27 | £4,400 | £4,323 | -£77 | -1.75% |
London cocoa declined across all five principal maturities. Losses ranged from £77 to £105 per tonne, equivalent to 1.75% to 2.48%. Sep-26 was the weakest contract, falling £105, or 2.48%, to £4,135. Jul-27 was the most resilient, declining £77, or 1.75%, to £4,323.
Intraday ranges across the first five contracts varied between £147 and £171 per tonne. Sep-26 recorded the widest range, trading between £4,098 and £4,269 before ending at £4,135. Dec-26 traded between £4,150 and £4,320 before finishing at £4,200.
The first five contracts finished only 21.6% to 33.3% above their respective daily lows, compared with 61.8% to 73.5% on 24 August. The limited recoveries show that selling pressure remained dominant through the end of the session.
Spread activity increased to 68.6% of total turnover from 57.7%. However, actual spread volume edged down by 349 contracts, or 2.0%, to 17,208. The higher share primarily reflected a much sharper contraction in outright activity, which fell by 5,026 contracts, or 39.0%, to 7,866. Total reported volume declined by 17.7% to 25,074 contracts.
EFP activity fell from 5,139 to 516 contracts, a reduction of 4,623, or 90.0%. EFS volume increased from 17 to 150 contracts, although this represented a sharp percentage increase from an exceptionally low base. No block volume was reported.
London futures curve
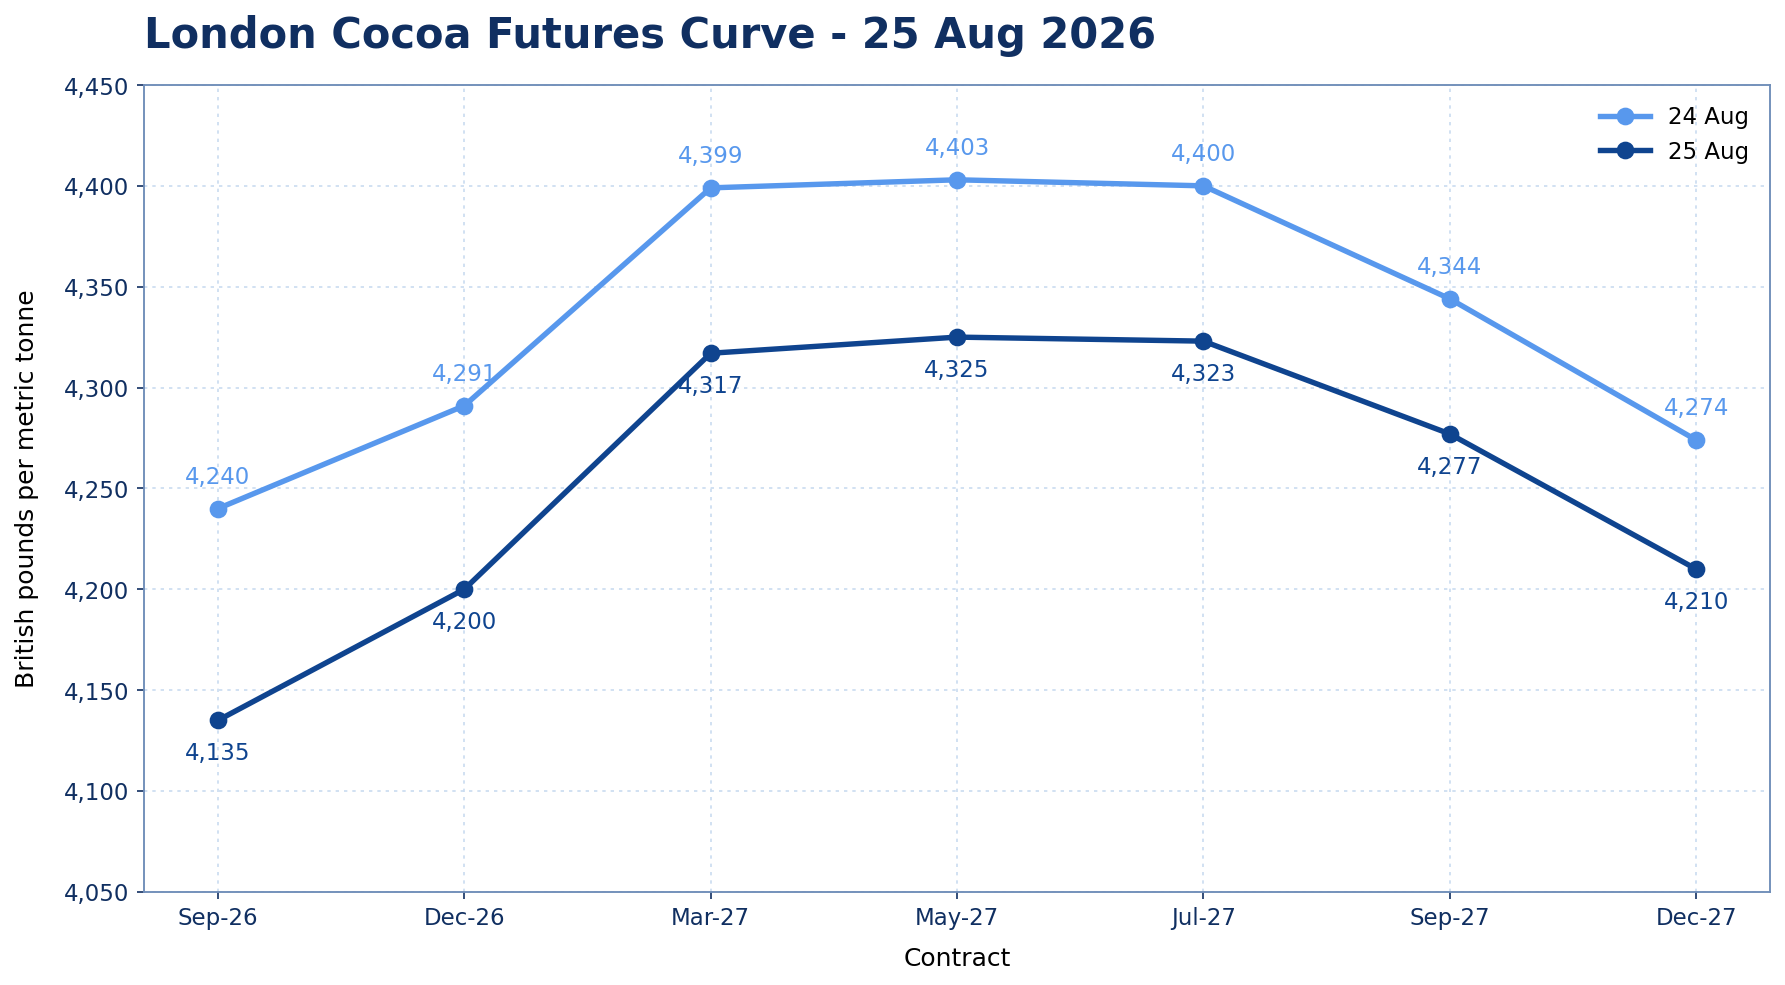
The London curve moved lower across all seven maturities, but selling was concentrated toward the front. Losses progressively narrowed from £105 in Sep-26 to £64 in Dec-27, producing a distinctly non-parallel adjustment.
Sep-26/Dec-26 contango widened from £51 to £65, a further £14 weakening of the nearby contract relative to Dec-26. From Sep-26 to May-27, the curve now rises by £190 per tonne, compared with £163 on 24 August. May-27 remained the peak at £4,325, only £2 above Jul-27.
Dec-26/Mar-27 contango widened from £108 to £117, while Mar-27/May-27 contango increased from £4 to £8. May-27/Jul-27 backwardation narrowed slightly from £3 to £2, leaving the middle of the curve almost flat.
Beyond the peak, Jul-27/Sep-27 backwardation narrowed from £56 to £46, while Sep-27/Dec-27 backwardation eased from £70 to £67. The May-27/Dec-27 premium contracted from £129 to £115.
The resulting curve retains its hump-shaped structure but now combines a more bearish and steeper front end with a gentler decline beyond the May-27 peak.
US–UK Spread
(Dec Contract)
$5,844 − (£4,200 x 1.364$/£) =$115ton (down from $66 ton)
Volume and Open Interest
New York cocoa
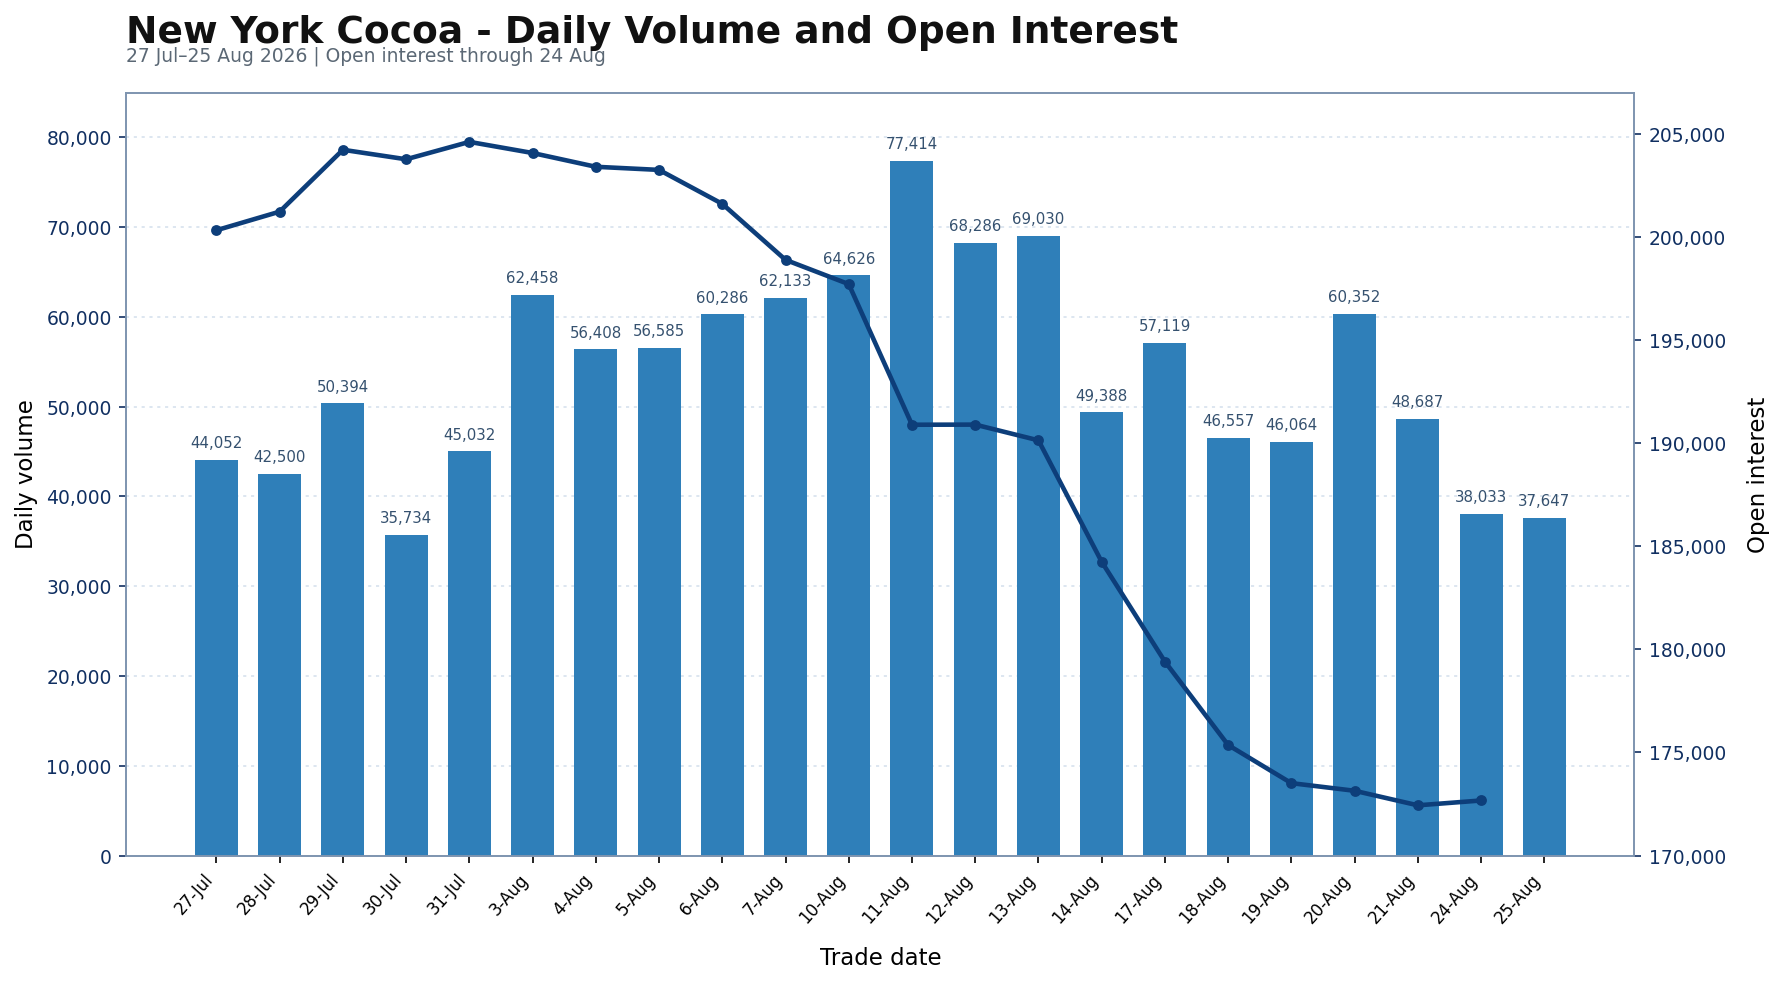
New York cocoa volume edged down to 37,647 contracts on 25 August, a decrease of 386 contracts, or 1.0%, from 38,033 on 24 August. Activity remained well below recent norms, with turnover 31.4% below the preceding 20-session average of 54,854 contracts and 51.4% below the 11 August period peak of 77,414 contracts.
The latest available open interest, for 24 August, increased slightly to 172,672 contracts from 172,438 on 21 August, a rise of 234 contracts, or 0.1%. Despite this marginal increase, open interest remained 27,649 contracts, or 13.8%, below its 27 July level and 31,934 contracts, or 15.6%, below the period peak of 204,606 recorded on 31 July. No open-interest figure was reported for 25 August.
The combination continues to indicate subdued participation following the sharp deleveraging seen through August. Turnover declined further and remained barely half the period peak, while the small increase in the latest available open interest was insufficient to signal meaningful rebuilding of positions.
London cocoa
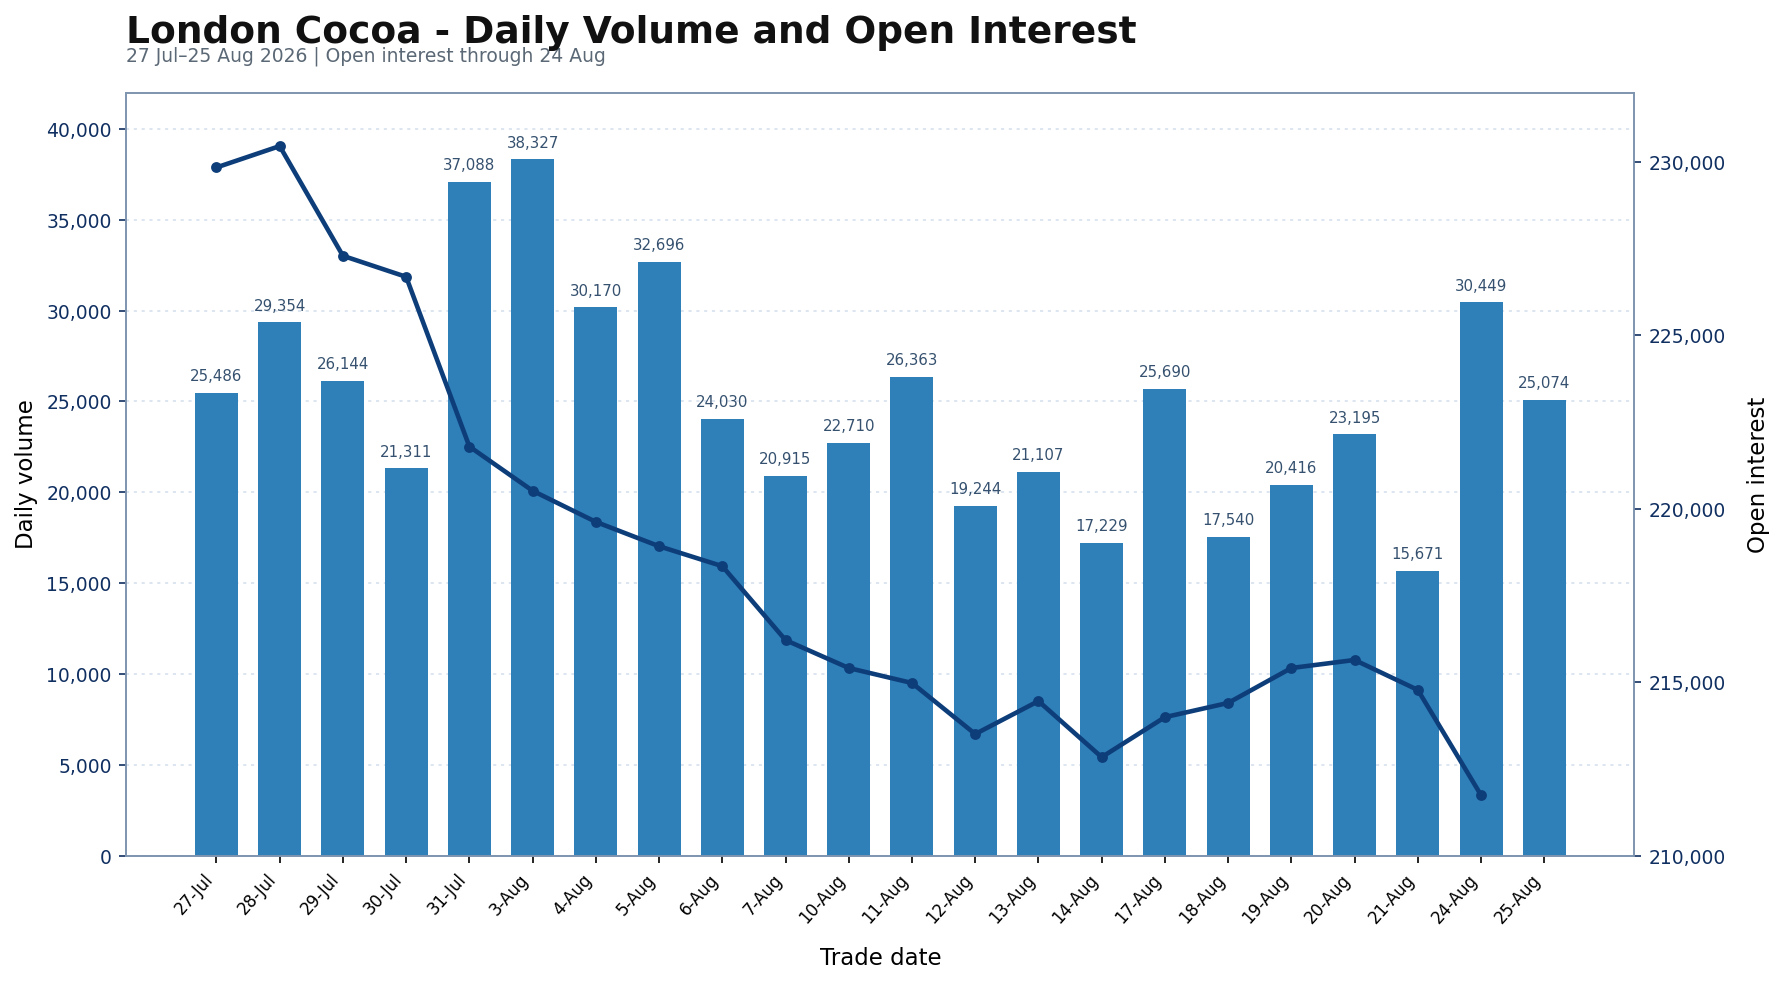
London cocoa volume fell to 25,074 contracts on 25 August, down 5,375 contracts, or 17.7%, from 30,449 on 24 August. Activity was nevertheless broadly in line with recent norms: turnover stood 92 contracts, or 0.4%, above the preceding 20-session average of 24,982 contracts, but remained 13,253 contracts, or 34.6%, below the period peak of 38,327 recorded on 3 August.
The latest available open interest, for 24 August, declined to 211,741 contracts from 214,776 on 21 August, a fall of 3,035 contracts, or 1.4%. Open interest has contracted by 18,098 contracts, or 7.9%, since 27 July and by 18,714 contracts, or 8.1%, from the period peak of 230,455 recorded on 28 July. No open-interest figure was reported for 25 August.
The combination points to turnover that eased after the 24 August rebound but remained close to its recent average, alongside an underlying reduction in outstanding positions through 24 August.
Exchange Trading Volume
| MARKET | 24 AUG 2026 | 25 AUG 2026 | CHANGE | CHANGE % |
|---|---|---|---|---|
| US | 3,373,003 | 3,376,634 | +3,631 | +0.11% |
| UK | 1,154,531 | 1,123,281 | −31,250 | −2.71% |
The measure is not a complete regional stock-to-grind ratio, as it includes only exchange-certified cocoa held at U.S. and EU delivery ports and excludes commercial inventories outside the ICE warehouse system. North America NCA grindings cover processors across North America, while ICE U.S. certified stocks are stored at U.S. delivery ports. ECA reports bean usage in European countries and London-certified cocoa is held in European and UK delivery locations.
Readers can explore detailed cocoa market datasets, futures statistics, and historical indicators in the CocoaIntel Data Hub:
 Cocoa Intel
Wednesday Outlook Dec Contract
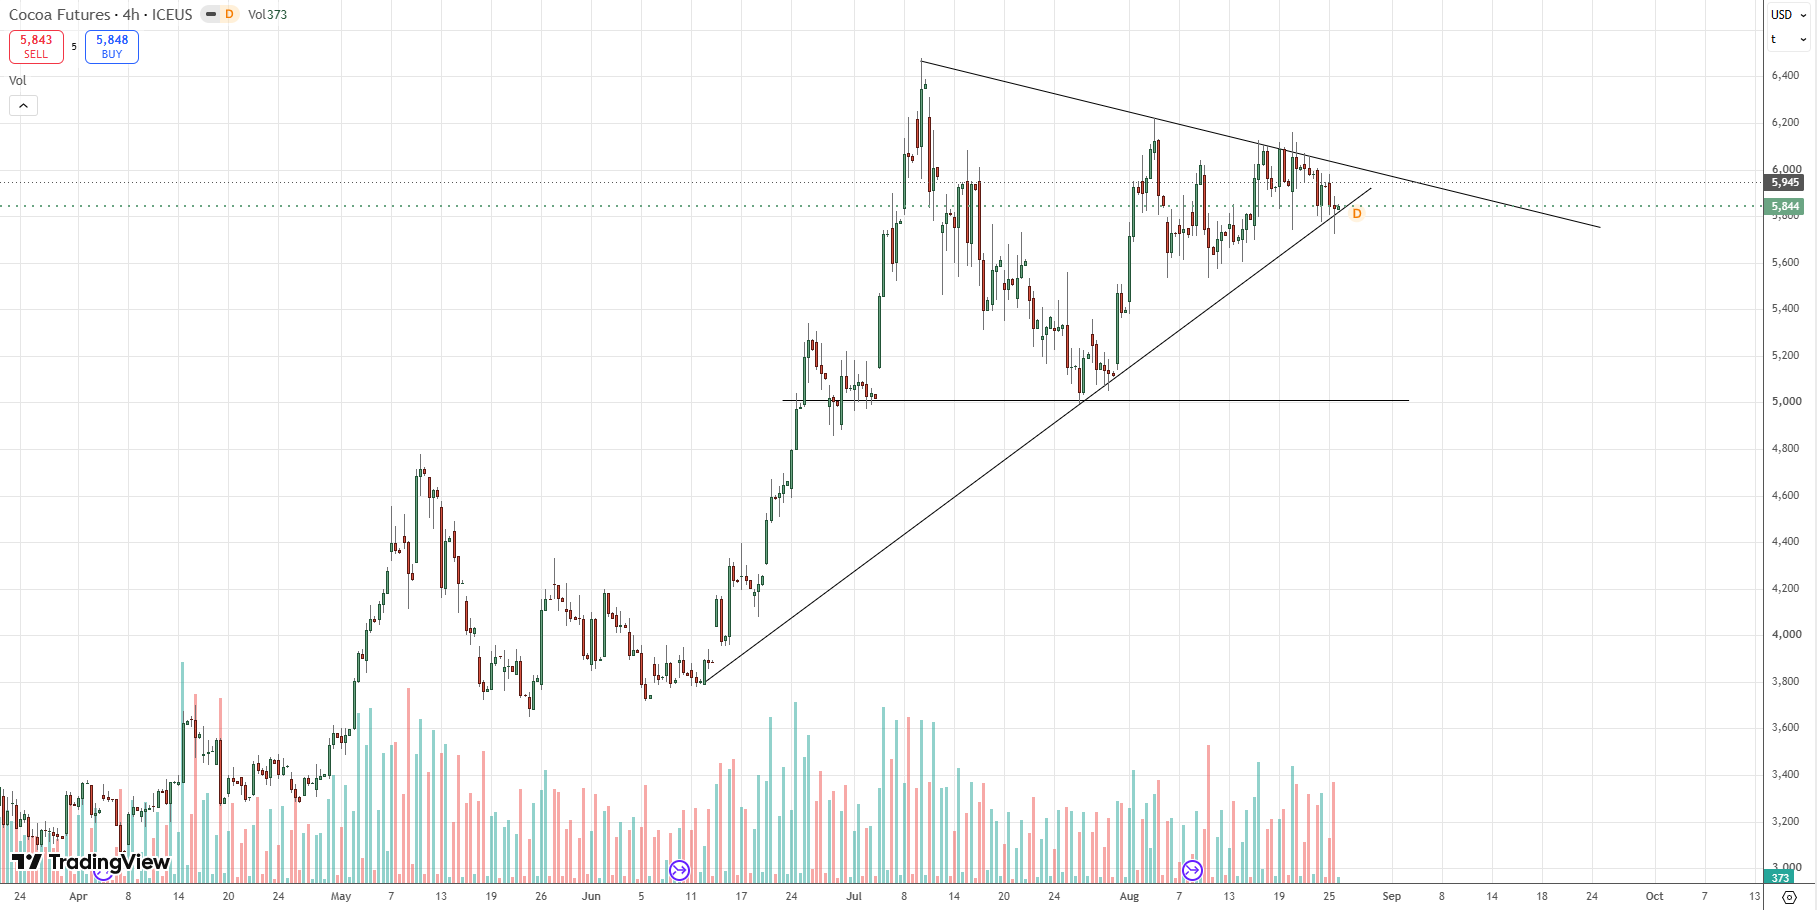
My bias remains tilted toward the bullish scenario, as New York cocoa continues to consolidate within the broad 5,750–6,150 range while approaching the apex of a symmetrical triangle, indicating that a larger directional move may be developing. The repeated defence of the 5,720–5,750 support zone has consistently attracted buying interest, while the rising lower trendline and the 21-day moving average continue to support the broader structure. A recovery above 5,900 and Tuesday’s high of 5,980 would strengthen the short-term momentum and prepare the market for another test of the key 6,100–6,150 resistance zone. A decisive breakout above this falling trendline, accompanied by expanding volume and confirmed by a daily close, could initiate an advance toward 7,500. Conversely, a sustained breakdown below 5,700 would invalidate the bullish structure and confirm a bearish resolution of the triangle. Prices could then decline initially toward 5,500 and 5,300, followed by 5,000, while the full measured move from the pattern would indicate a potential longer-term downside target around 4,400–4,500.
If you notice any discrepancies in these figures or have extra information, please email hello@cocoaintel.com or leave a comment – corrections and additional insights are always welcome.