
Cocoa Breaks Out as Ivory Coast Crop Delay Raises Supply Concerns (27 August 2026)


New York cocoa recorded a powerful rally on Thursday, with the December contract gaining $404 per tonne, or 6.9%, to close at $6,233. After opening at $5,816 and briefly touching a session low of $5,804, aggressive buying lifted the contract to an intraday high of $6,391. The advance carried prices above the long-forming triangle structure, while a subsequent pullback towards $6,100 attracted renewed buying. The strong close, successful intraday retest and increased trading volume marked a decisive improvement in short-term market momentum.
The catalyst behind Thursday’s cocoa rally was a Reuters report warning that the start of Ivory Coast’s 2026/27 main crop could be delayed by eight to ten weeks. According to sources at the Coffee and Cocoa Council and within the export sector, difficult weather conditions, insufficient farm maintenance and the prolonged strength of the mid-crop have slowed the development of the forthcoming main crop.
Although the official season begins on 1 September, weekly arrivals are expected to remain below 15,000 tonnes during September and 25,000 tonnes during October. More substantial main-crop volumes may not begin reaching the ports until late October or early November, before increasing through December. The Coffee and Cocoa Council reportedly expects arrivals between September and February to reach no more than 1.4 million tonnes, while exporters estimate between 1.4 million and 1.45 million tonnes.
Approximately 900,000 tonnes are expected to reach Ivorian ports between October and December, compared with an updated 1.1 million tonnes during the same period last year, a decline of around 18%. While the projected volume remains within the usual range for this period, the delayed arrival pattern could concentrate unusually large quantities into a shorter export window. This raises the risk of congestion and strained storage capacity at Abidjan and San Pedro as exporters attempt to ship cocoa before stricter EU deforestation rules take effect at the end of the year.
Futures performance
New York cocoa
| Contract | 26 Aug | 27 Aug | Change | Change % |
|---|---|---|---|---|
| Sep-26 | $5,842 | $6,190 | +$348 | +5.96% |
| Dec-26 | $5,829 | $6,233 | +$404 | +6.93% |
| Mar-27 | $5,933 | $6,354 | +$421 | +7.10% |
| May-27 | $5,965 | $6,390 | +$425 | +7.12% |
| Jul-27 | $5,970 | $6,387 | +$417 | +6.98% |
New York cocoa advanced across all five principal maturities. May-27 posted the largest rise, gaining $425, or 7.12%, to $6,390, followed by Mar-27 at $6,354 (+$421; +7.10%). Sep-26 rose $348, or 5.96%, to $6,190, but the expiring contract traded only two lots, so its move is not representative of broader activity.
The first five contracts traded through ranges of $4 to $604 per tonne. Sep-26's $4 range reflected its negligible volume. The actively traded Dec-26 through Jul-27 contracts recorded exceptionally wide ranges of $571 to $604.
Excluding Sep-26, these maturities finished 72.7% to 75.9% above their daily lows, compared with 24.5% to 30.8% on 26 August. Although prices pulled back from the day's extremes, most of the advance was retained into the final trade.
Total volume rose 75.6% to 57,670 contracts. Spread volume increased 47.7% to 30,503, but its share of turnover fell from 62.9% to 52.9%. Implied outright volume more than doubled, rising 123.0% to 27,167. EFP activity increased from 161 to 1,247 contracts, EFS activity rose from zero to 1,140, and no block volume was reported.
New York futures curve
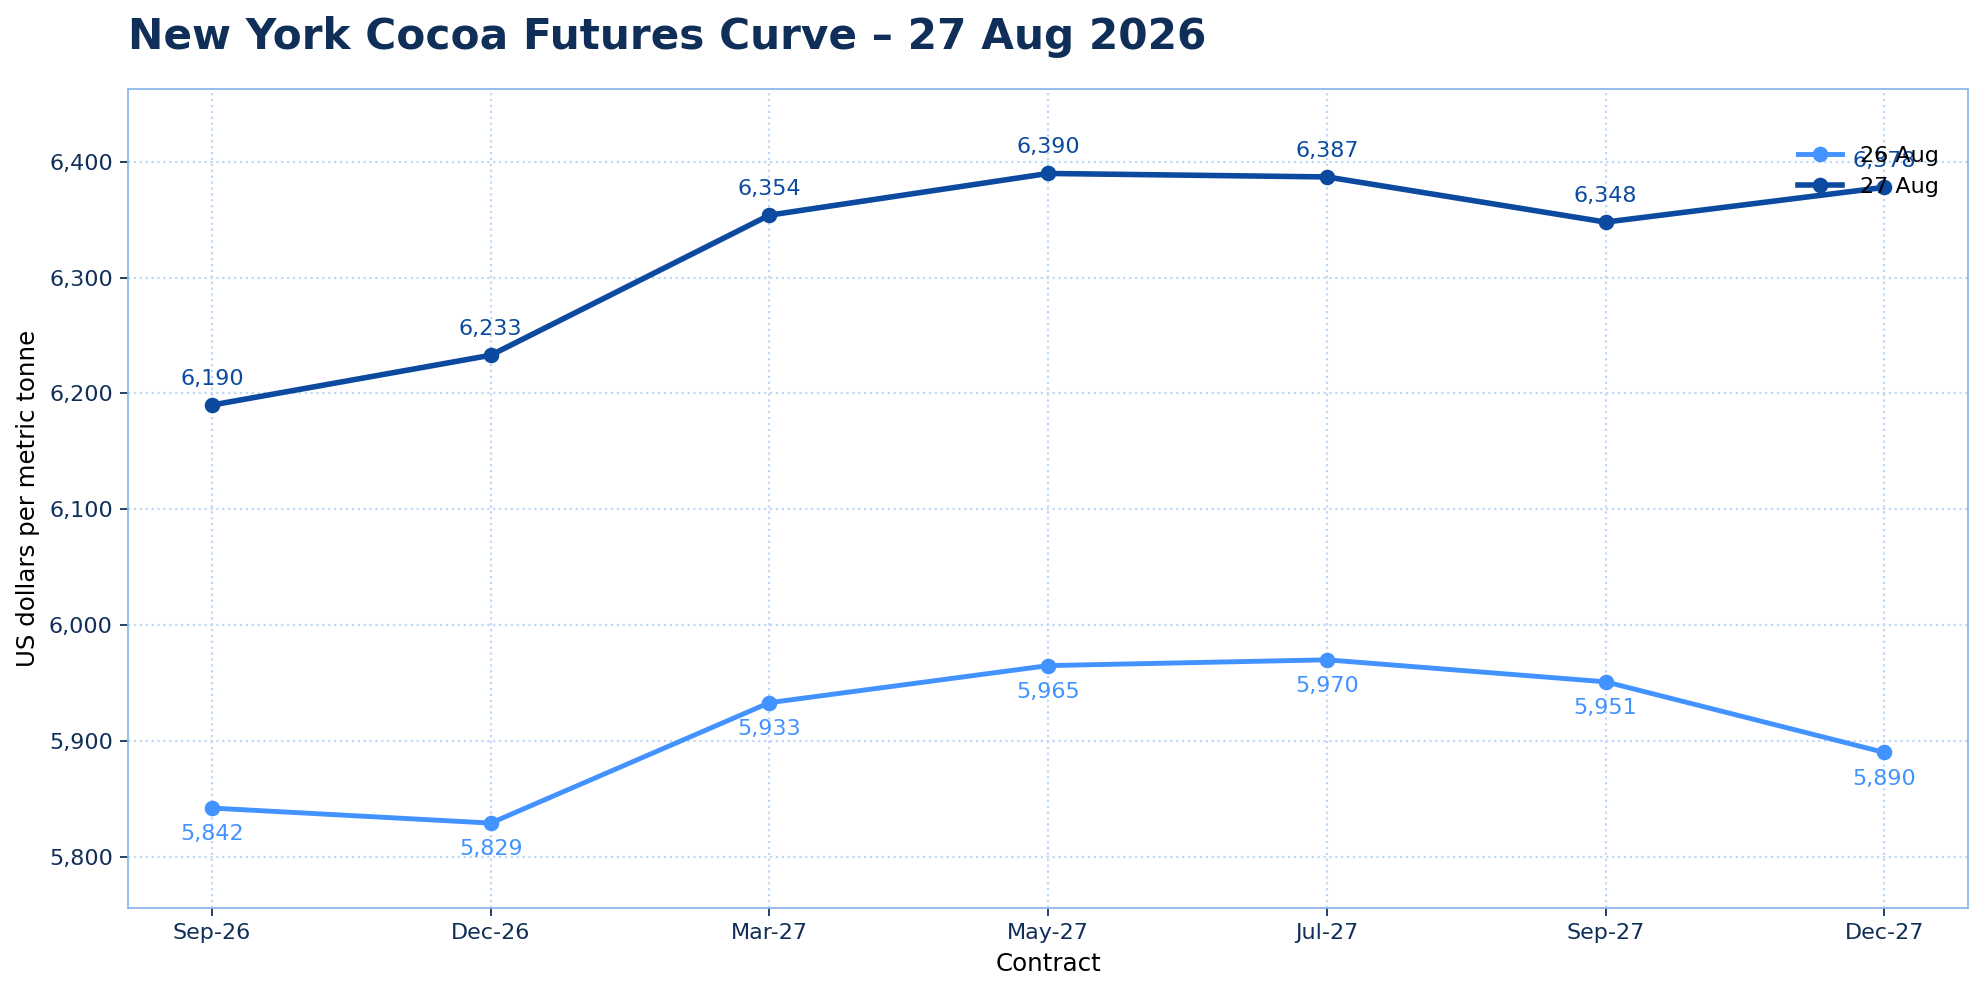
The curve shifted sharply higher, but not in parallel. Across the seven plotted maturities, gains ranged from $348 to $488 per tonne. Dec-27 led the move, while Sep-26 gained least; the curve peak moved from Jul-27 to May-27.
Sep-26/Dec-26 moved from $13 backwardation to $43 contango, a $56 weakening of Sep-26 relative to Dec-26. Because Sep-26 traded only two contracts, this front-end reversal should be treated cautiously.
Dec-26/Mar-27 contango widened from $104 to $121. Mar-27/May-27 contango widened from $32 to $36, while May-27/Jul-27 shifted from $5 contango to $3 backwardation. May-27 became the curve peak at $6,390.
Further out, Jul-27/Sep-27 backwardation widened from $19 to $39, while Sep-27/Dec-27 flipped from $61 backwardation to $30 contango. The peak-to-trough amplitude expanded from $141 to $200 per tonne.
London cocoa
| Contract | 26 Aug | 27 Aug | Change | Change % |
|---|---|---|---|---|
| Sep-26 | £4,173 | £4,375 | +£202 | +4.84% |
| Dec-26 | £4,261 | £4,464 | +£203 | +4.76% |
| Mar-27 | £4,380 | £4,588 | +£208 | +4.75% |
| May-27 | £4,378 | £4,603 | +£225 | +5.14% |
| Jul-27 | £4,372 | £4,587 | +£215 | +4.92% |
London cocoa also rose across all five principal maturities. May-27 was the strongest, advancing £225, or 5.14%, to £4,603. Sep-26 gained £202, or 4.84%, to £4,375, while Mar-27 recorded the smallest percentage rise, up 4.75% to £4,588.
The first five contracts traded through ranges of £296 to £321 per tonne. Mar-27 recorded the widest range at £321, followed by Dec-26 at £318; Sep-26 had the narrowest range at £296.
These maturities finished 74.2% to 80.3% above their daily lows, compared with 45.5% to 54.2% on 26 August. The stronger positioning shows that substantially more of the intraday rally was retained into the final trade.
Total volume increased 32.6% to 43,082 contracts. Spread volume rose 25.6% to 28,089, while its share of turnover declined from 68.9% to 65.2%. Implied outright volume increased 48.3% to 14,993. EFP activity fell from 397 to 190 contracts, EFS activity declined from 1,894 to zero, and no block volume was reported.
London futures curve
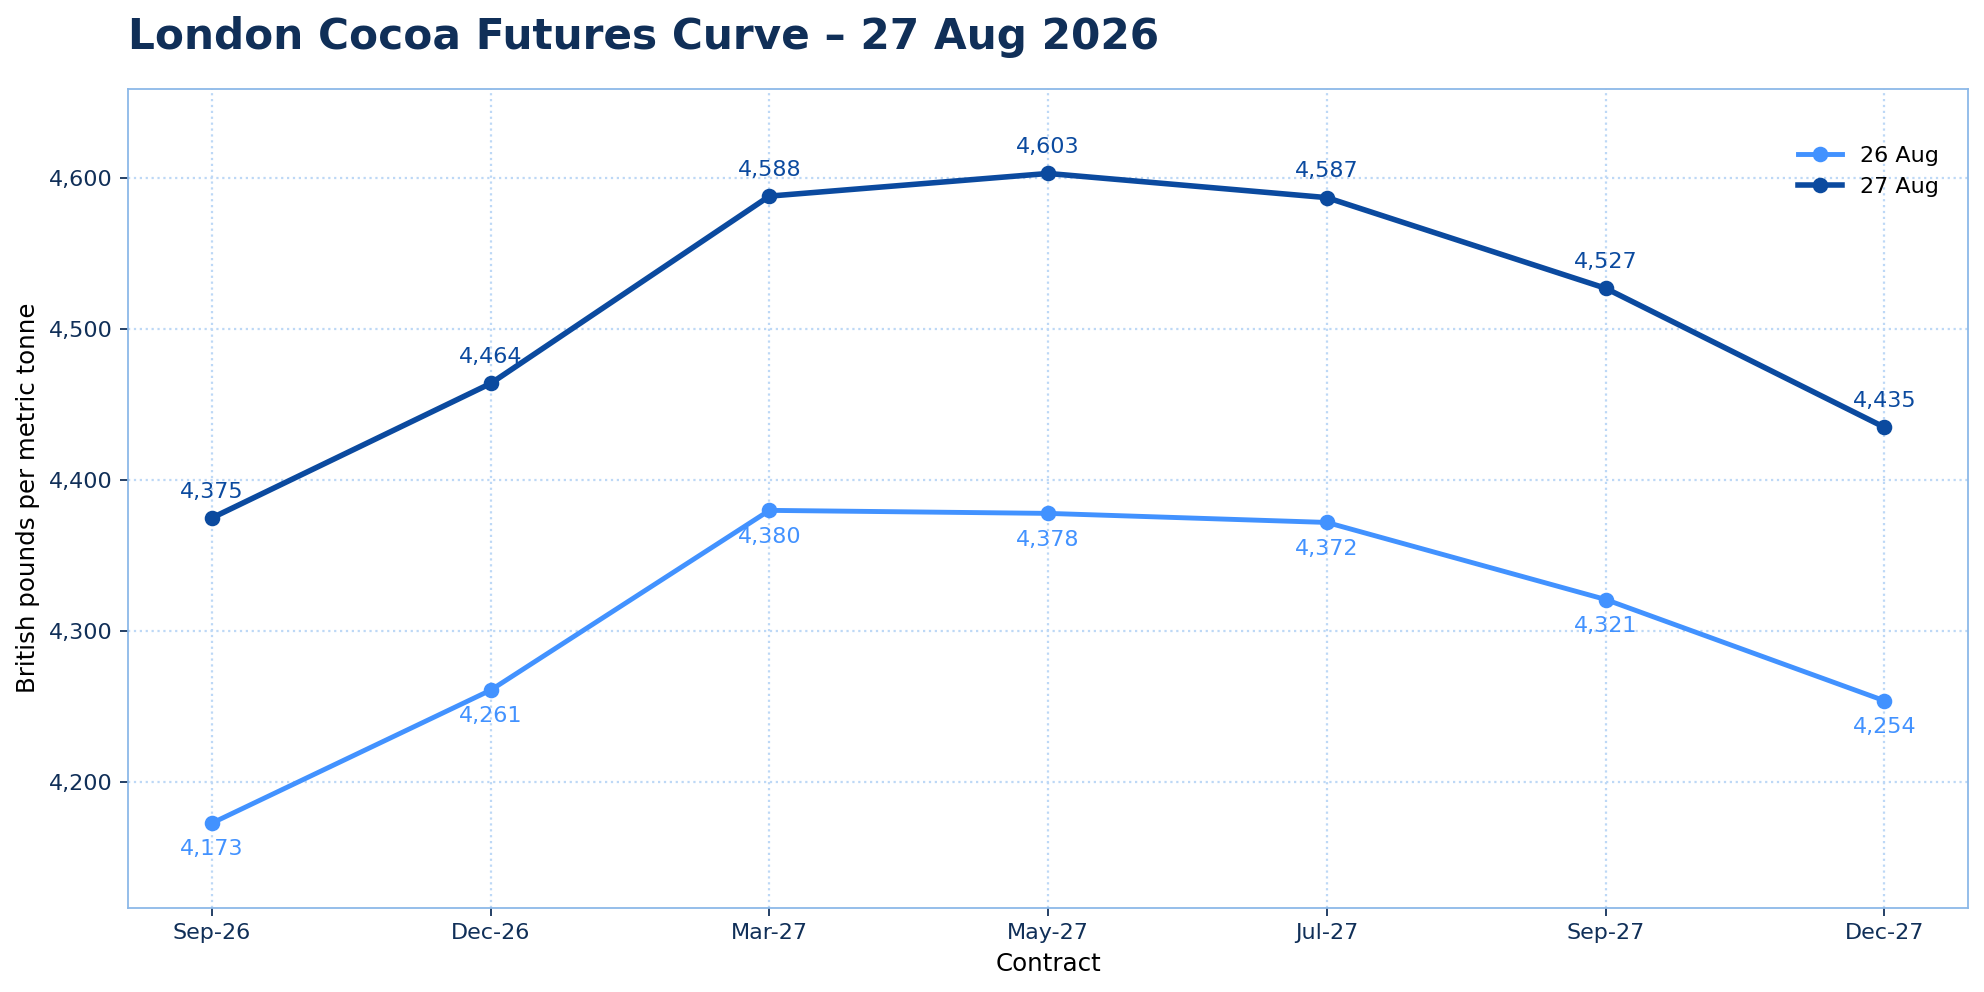
The London curve also moved broadly higher, but the adjustment was not fully parallel. Across the seven plotted maturities, gains ranged from £181 to £225 per tonne. May-27 gained most and became the new curve peak, while Dec-27 recorded the smallest advance.
Sep-26/Dec-26 contango was almost unchanged, widening by £1 from £88 to £89. Unlike New York, London therefore retained a stable front-end relationship despite the sharp rise in outright prices.
Dec-26/Mar-27 contango widened from £119 to £124. Mar-27/May-27 shifted from £2 backwardation to £15 contango, while May-27/Jul-27 backwardation widened from £6 to £16. May-27 was the curve peak at £4,603.
Further out, Jul-27/Sep-27 backwardation widened from £51 to £60, while Sep-27/Dec-27 backwardation widened from £67 to £92. The peak-to-trough amplitude expanded from £207 to £228 per tonne.
US–UK Spread
(Dec Contract)
$6,233 − (£4,464 x 1.360$/£) =$164ton (up from $34 ton)
Volume and Open Interest
New York cocoa
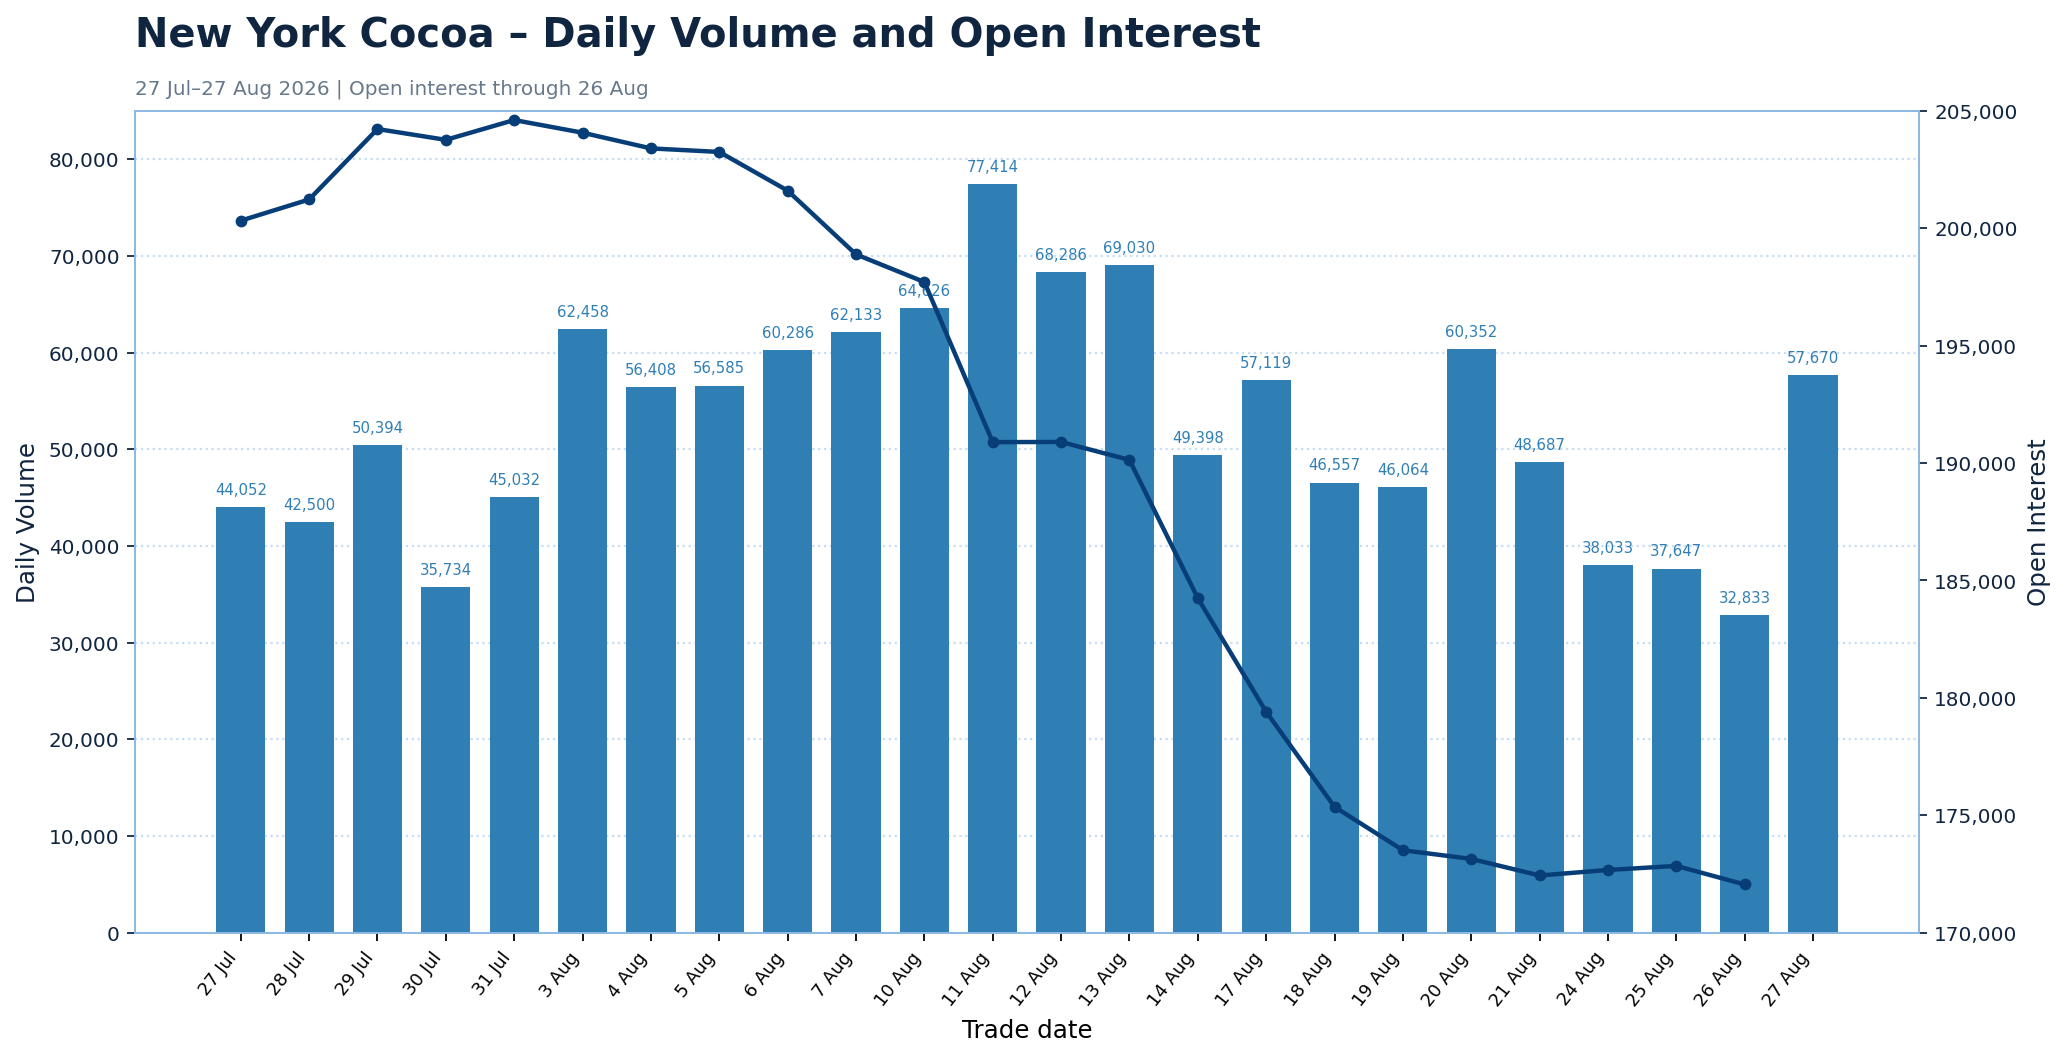
New York cocoa volume rebounded to 57,670 contracts on 27 August, up 24,837 contracts, or 75.6%, from 32,833 on 26 August. Turnover stood 7.3% above the preceding 20-session average of 53,734 contracts, but remained 25.5% below the displayed-period peak of 77,414 contracts recorded on 11 August.
The latest available open interest, for 26 August, fell to 172,055 contracts from 172,846 on 25 August, a decrease of 791 contracts, or 0.5%. It remained 28,266 contracts, or 14.1%, below its 27 July level of 200,321 and 32,551 contracts, or 15.9%, below the period peak of 204,606 recorded on 31 July. No figure was reported for 27 August.
The sharp recovery in turnover marks a clear improvement in trading participation after the prior session's period low, taking activity modestly above its recent norm. Open interest through 26 August nevertheless fell to a fresh period low, so the data did not yet confirm broad position rebuilding.
London cocoa
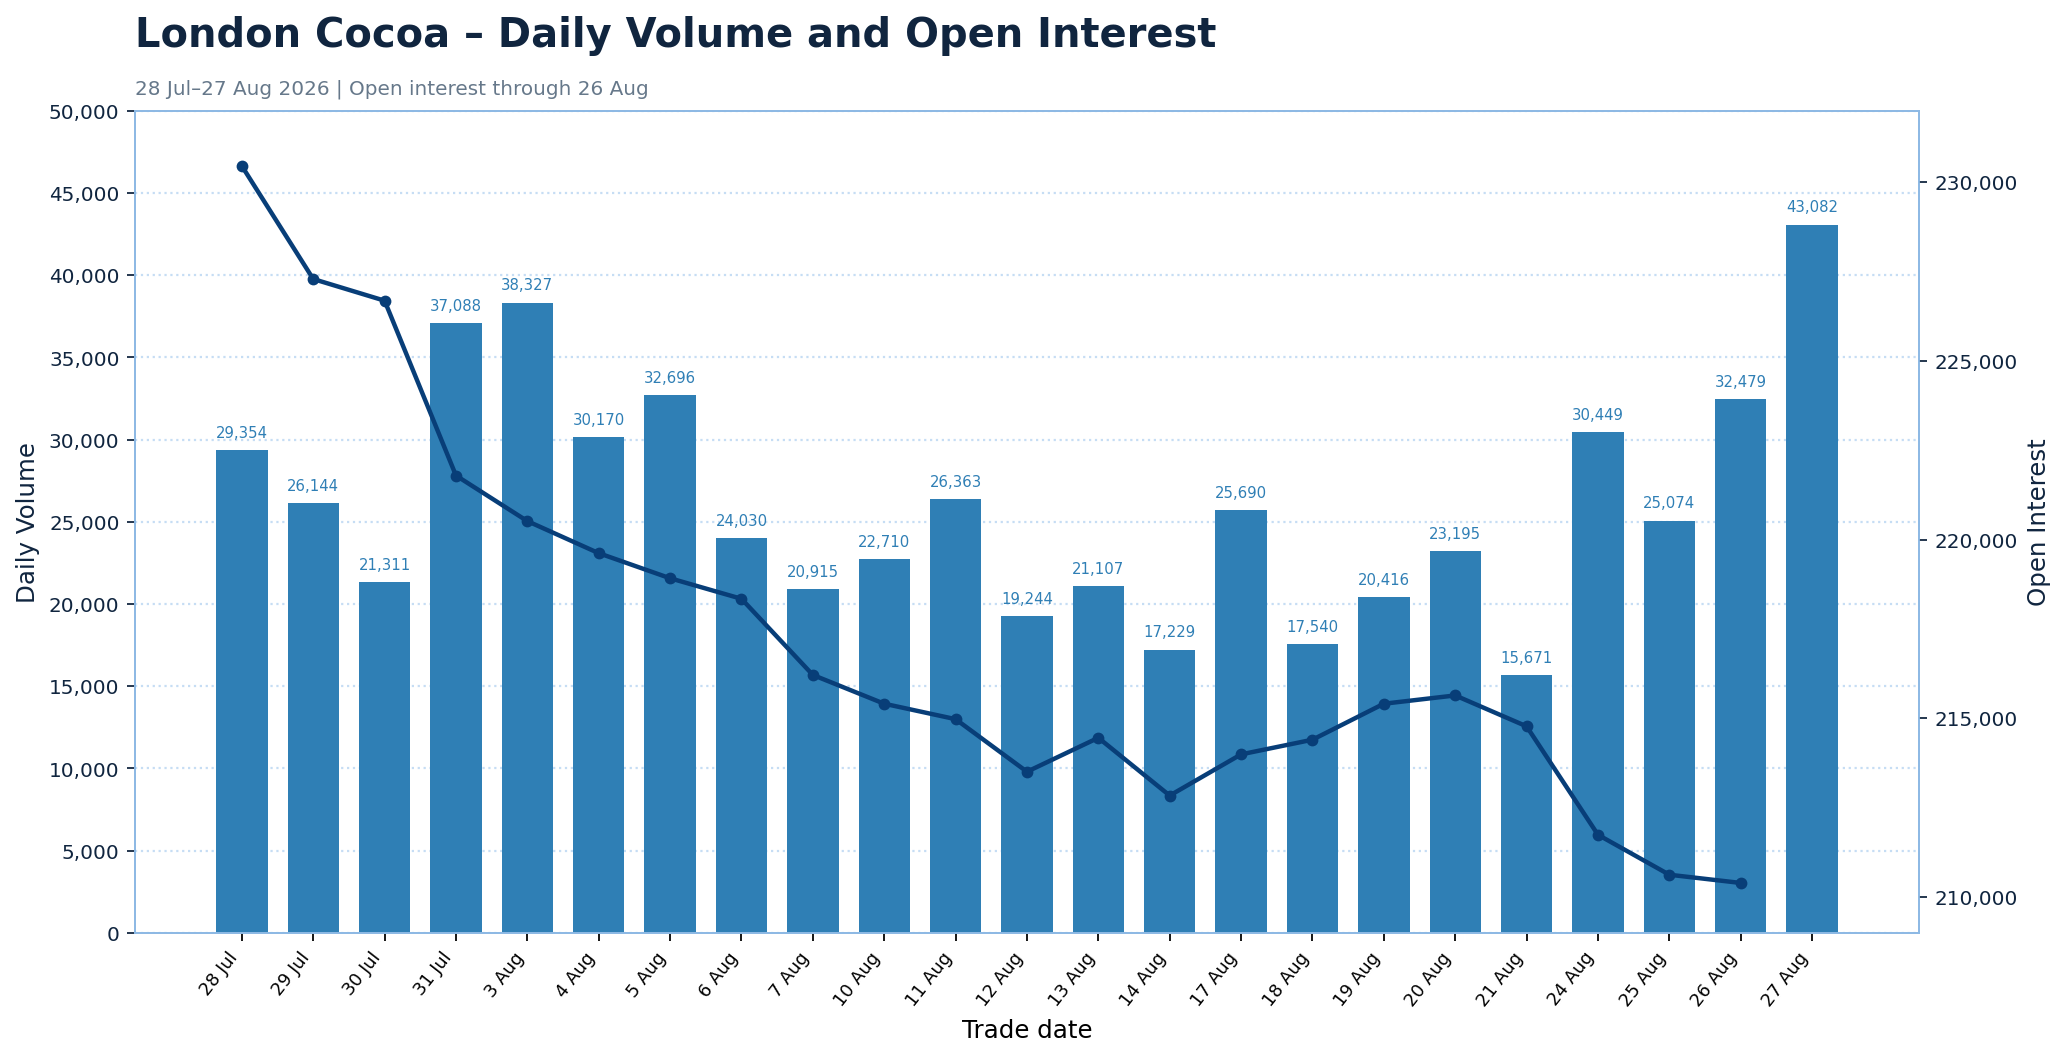
London cocoa volume increased to 43,082 contracts on 27 August, up 10,603 contracts, or 32.6%, from 32,479 on 26 August. This was the highest turnover of the displayed period. Volume stood 71.7% above the preceding 20-session average of 25,085 contracts and 12.4% above the previous period peak of 38,327 recorded on 3 August.
The latest available open interest, for 26 August, declined slightly to 210,393 contracts from 210,623 on 25 August, a decrease of 230 contracts, or 0.1%. Open interest was 20,062 contracts, or 8.7%, below both its 28 July level and the displayed-period peak of 230,455. The 26 August figure was also the lowest open-interest level of the period. No figure was reported for 27 August.
The combination points to a sharp rebound in daily participation alongside a continued contraction in outstanding positions. Turnover reached a new period high while the latest available open interest fell to a period low, suggesting that the surge in activity did not yet establish a broader rebuilding of market exposure. This interpretation remains provisional until open interest for 27 August becomes available.
Exchange Trading Volume
| MARKET | 26 AUG 2026 | 27 AUG 2026 | CHANGE | CHANGE % |
|---|---|---|---|---|
| US | 3,375,661 | 3,383,008 | +7,347 | +0.22% |
| UK | 1,129,688 | 1,129,688 | 0 | 0.00% |
The measure is not a complete regional stock-to-grind ratio, as it includes only exchange-certified cocoa held at U.S. and EU delivery ports and excludes commercial inventories outside the ICE warehouse system. North America NCA grindings cover processors across North America, while ICE U.S. certified stocks are stored at U.S. delivery ports. ECA reports bean usage in European countries and London-certified cocoa is held in European and UK delivery locations.
Readers can explore detailed cocoa market datasets, futures statistics, and historical indicators in the CocoaIntel Data Hub:
 Cocoa Intel
Friday Outlook Dec Contract
The anticipated fundamental catalyst was reflected in Thursday’s price action, with December cocoa breaking above the long-forming triangle structure. The contract reached 6,391 and closed at 6,233, firmly above the breakout area. The move was accompanied by a sharp increase in trading volume and strengthening OBV, providing additional confirmation.
Following the initial breakout, price retested the 6,100 area intraday and recovered, suggesting that former resistance is beginning to act as support. The technical bias therefore remains bullish while the contract holds above the 6,050–6,100 zone.
Immediate resistance is located between 6,350 and 6,400, a zone tested during Thursday’s session but not cleared on a closing basis. Above this, the next major resistance is at 6,550–6,600. A sustained break above 6,600 would open the way towards the triangle’s initial measured target of approximately 7,100–7,300. If bullish momentum accelerates, 7,500 could become a subsequent extension target.
A close back below 6,000 would weaken the bullish structure and increase the risk of a false breakout.
If you notice any discrepancies in these figures or have extra information, please email hello@cocoaintel.com or leave a comment – corrections and additional insights are always welcome.