
Cocoa Consolidation Tightens Ahead of Potential Breakout (20 August 2026)


New York Dec-26 cocoa experienced another highly volatile session on 20 August. The contract came under heavy pressure early in the day, falling to an intraday low of $5,739 per tonne, before reversing sharply and rallying to $6,160. The move above $6,100 was not sustained, however, and prices retreated before making a second, weaker attempt higher later in the session. Momentum then faded into the close, with Dec-26 finishing at $6,012, up $78, or 1.31%, from $5,934 on 19 August. The wide $421 intraday range and repeated rejection around the $6,100–$6,150 area underline the continued two-way volatility as the contract remains confined within its broader consolidation structure.
Fundamental News
Ivory Coast said it is ready for the EU Deforestation Regulation, with the cocoa regulator pointing to its farmer registration system and digital identification cards as evidence that beans can be traced through the supply chain. The cards are intended to link cocoa purchases to registered producers and provide farmers with access to electronic payments and banking services.
Industry participants remain considerably more cautious. Buyers and exporters warned that incomplete distribution of the cards could create bottlenecks as the new season begins, potentially delaying cocoa purchases and exports. Questions also remain over whether the traceability system can reliably prevent cocoa produced in protected forests from entering compliant supply chains, particularly where beans from different origins are mixed.
The issue is significant because Ivory Coast estimates that around 15% of national cocoa production originates from protected forests and national parks, while environmental groups place the figure closer to 30%. The immediate market risk is therefore less about physical production and more about execution risk in the supply chain, with EUDR implementation potentially affecting purchasing flows, export timing and the availability of compliant cocoa as the December deadline approaches.
Futures performance
New York cocoa
| CONTRACT | 19 AUG | 20 AUG | CHANGE | CHANGE % |
|---|---|---|---|---|
| Sep-26 | $5,938 | $6,021 | +$83 | +1.40% |
| Dec-26 | $5,934 | $6,012 | +$78 | +1.31% |
| Mar-27 | $6,006 | $6,083 | +$77 | +1.28% |
| May-27 | $6,008 | $6,091 | +$83 | +1.38% |
| Jul-27 | $5,984 | $6,075 | +$91 | +1.52% |
New York cocoa recorded a broad-based advance on 20 August. All five principal contracts finished higher, with gains ranging from 1.28% to 1.52%. Jul-27 was the strongest of the five major maturities, gaining $91 per tonne, while Sep-26 and May-27 each rose by $83.
Intraday volatility remained exceptionally high. The five principal contracts traded through ranges of between $369 and $438 per tonne. Sep-26 recorded the widest range, trading from $5,732 to $6,170 before closing at $6,021.
Despite the large ranges, the final trades were considerably stronger than on 19 August. The first five contracts closed approximately 64.8% to 66.0% above their respective session lows. This indicates that the market retained roughly two-thirds of the rebound from the lows, compared with only around one-third of the range on the previous session.
Spread volume increased to 40,403 contracts from 33,029, a rise of 7,374 contracts, or 22.3%. However, because aggregate volume expanded even faster, spread transactions declined as a proportion of total turnover from 71.7% to 66.9%.
EFP volume increased sharply to 2,110 contracts from 1,051, effectively doubling from the previous session. EFS activity moved in the opposite direction, falling from 276 contracts to only 11. No block volume was reported.
New York futures curve
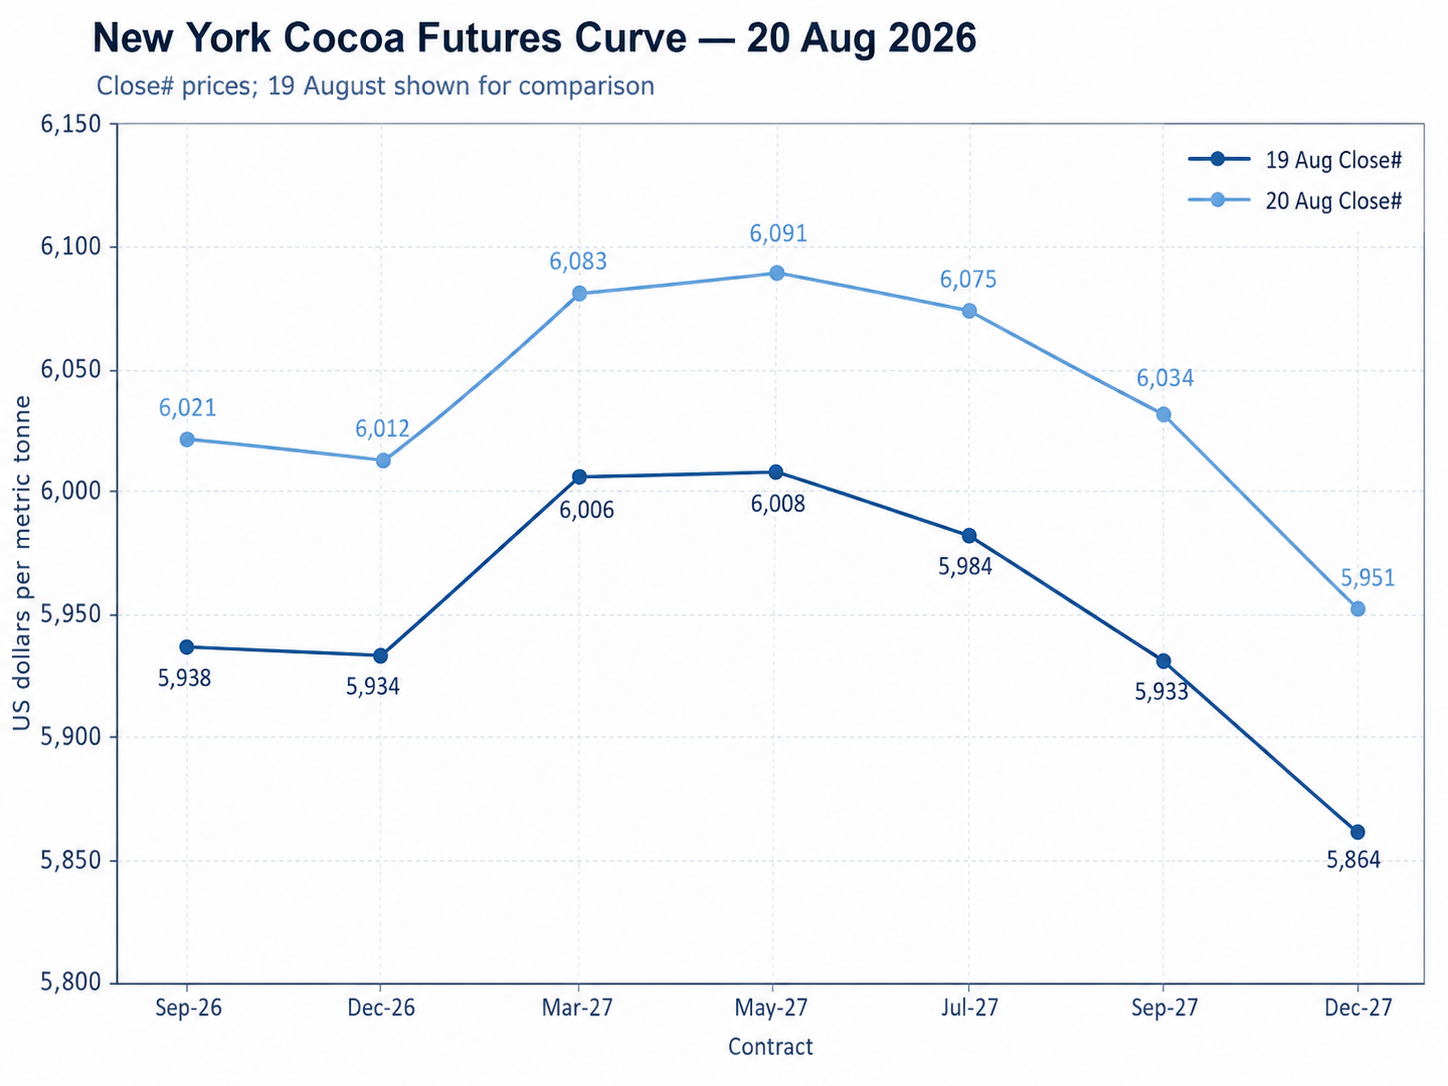
The New York curve shifted higher across all maturities, while its overall shape remained broadly intact. The nearby Sep-26/Dec-26 backwardation widened to $9 from $4, signalling modest relative strength at the front of the curve.
Further out, May-27 remained the peak at $6,091, while the curve continued to move into backwardation beyond July. The most notable deferred change was the widening of Sep-27/Dec-27 backwardation to $83 from $69.London cocoa
London cocoa
| CONTRACT | 19 AUG | 20 AUG | CHANGE | CHANGE % |
|---|---|---|---|---|
| Sep-26 | £4,276 | £4,283 | +£7 | +0.16% |
| Dec-26 | £4,322 | £4,330 | +£8 | +0.19% |
| Mar-27 | £4,439 | £4,450 | +£11 | +0.25% |
| May-27 | £4,443 | £4,456 | +£13 | +0.29% |
| Jul-27 | £4,436 | £4,447 | +£11 | +0.25% |
London cocoa also finished higher across all five principal maturities on 20 August, although the advance was considerably more subdued than in New York. Gains ranged from £7 to £13 per tonne, equivalent to 0.16% to 0.29%.
May-27 was the strongest of the five principal contracts, gaining £13 to £4,456. Mar-27 and Jul-27 each advanced by £11, while Sep-26 recorded the smallest increase at £7.
Intraday ranges remained substantial at between £268 and £279 per tonne across the first five maturities. Sep-26 traded between £4,076 and £4,344 before closing at £4,283, while Dec-26 ranged between £4,120 and £4,399 before closing at £4,330.
London again retained a relatively large proportion of its intraday recovery. The first five contracts closed approximately 75.3% to 77.2% above their respective daily lows. This was stronger than the approximately 68.4% to 70.1% range positions recorded on 19 August, indicating that buying support remained comparatively firm into the final trade.
Spread volume increased modestly to 13,393 contracts from 12,833, a rise of 560 contracts, or 4.4%. However, because aggregate volume increased much more rapidly, spread activity declined from 62.9% to 57.7% of total turnover.
EFP volume decreased by 223 contracts, or 13.1%, from 1,701 to 1,478. EFS activity, which was absent on 19 August, reached 140 contracts. No block volume was reported.
London futures curve
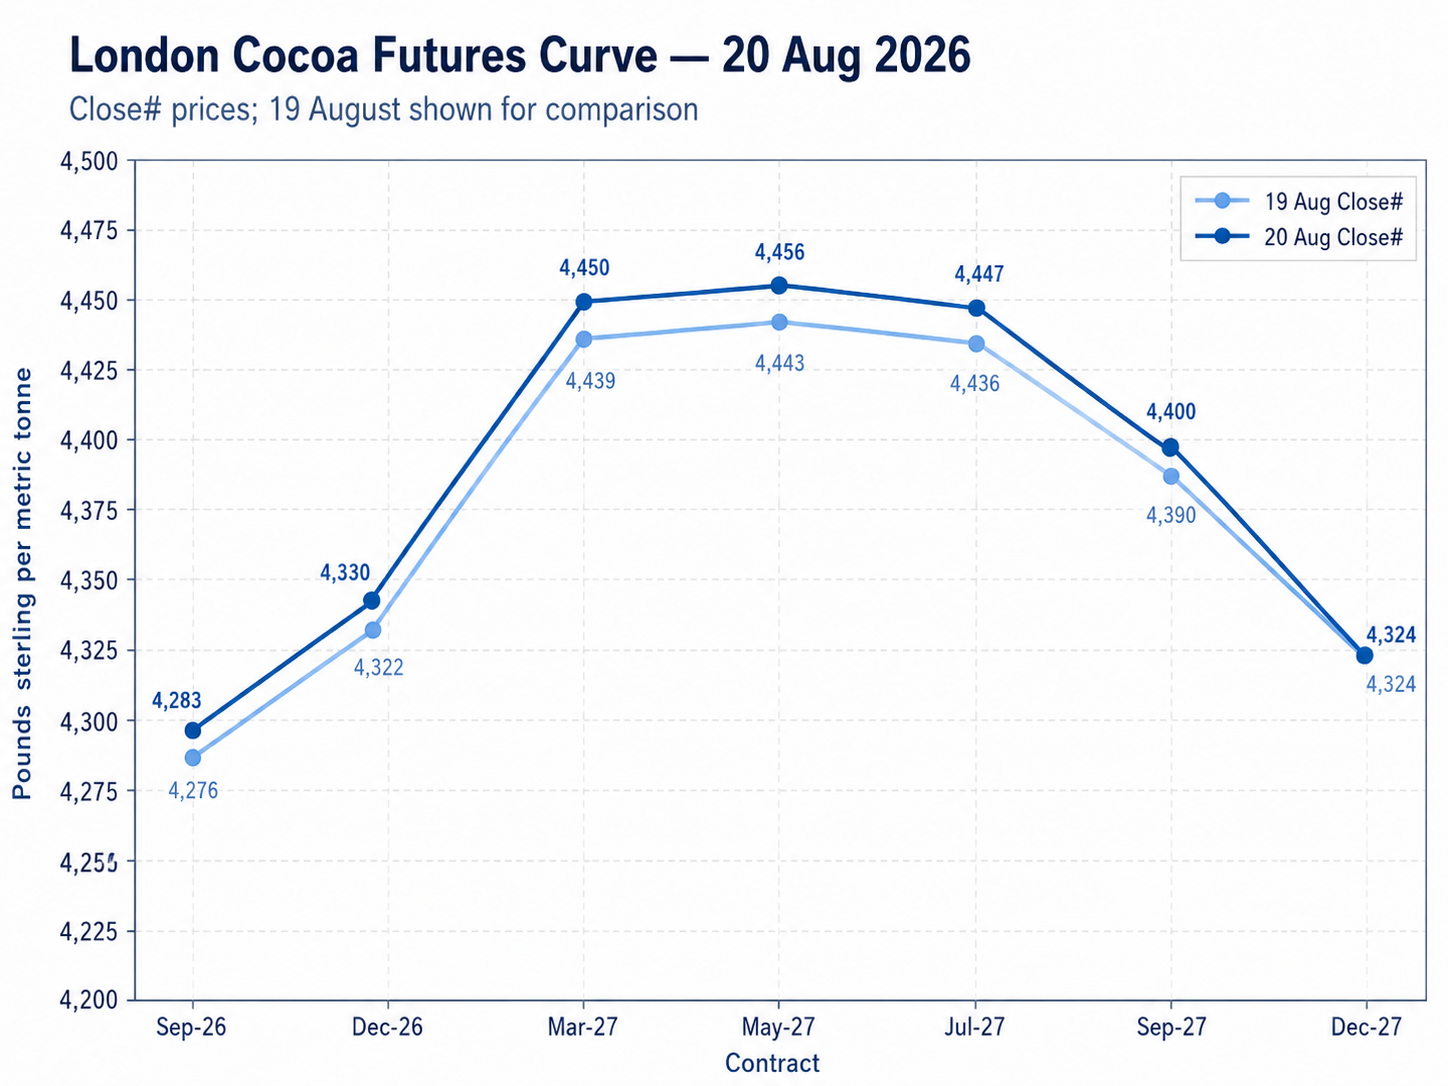
The London curve also moved higher, but structural changes were limited. Sep-26/Dec-26 contango remained broadly stable at £47, while May-27 continued to mark the peak of the curve at £4,456.
The more notable adjustment came further out, where Sep-27/Dec-27 backwardation widened to £76 from £66.
London retained the same broad curve profile, with only modest changes in relative pricing between maturities.
US–UK Spread
(Dec Contract)
$6,012 − (£4,330 x 1.364$/£) =$105ton (up from $56 ton)
Volume and Open Interest
New York cocoa
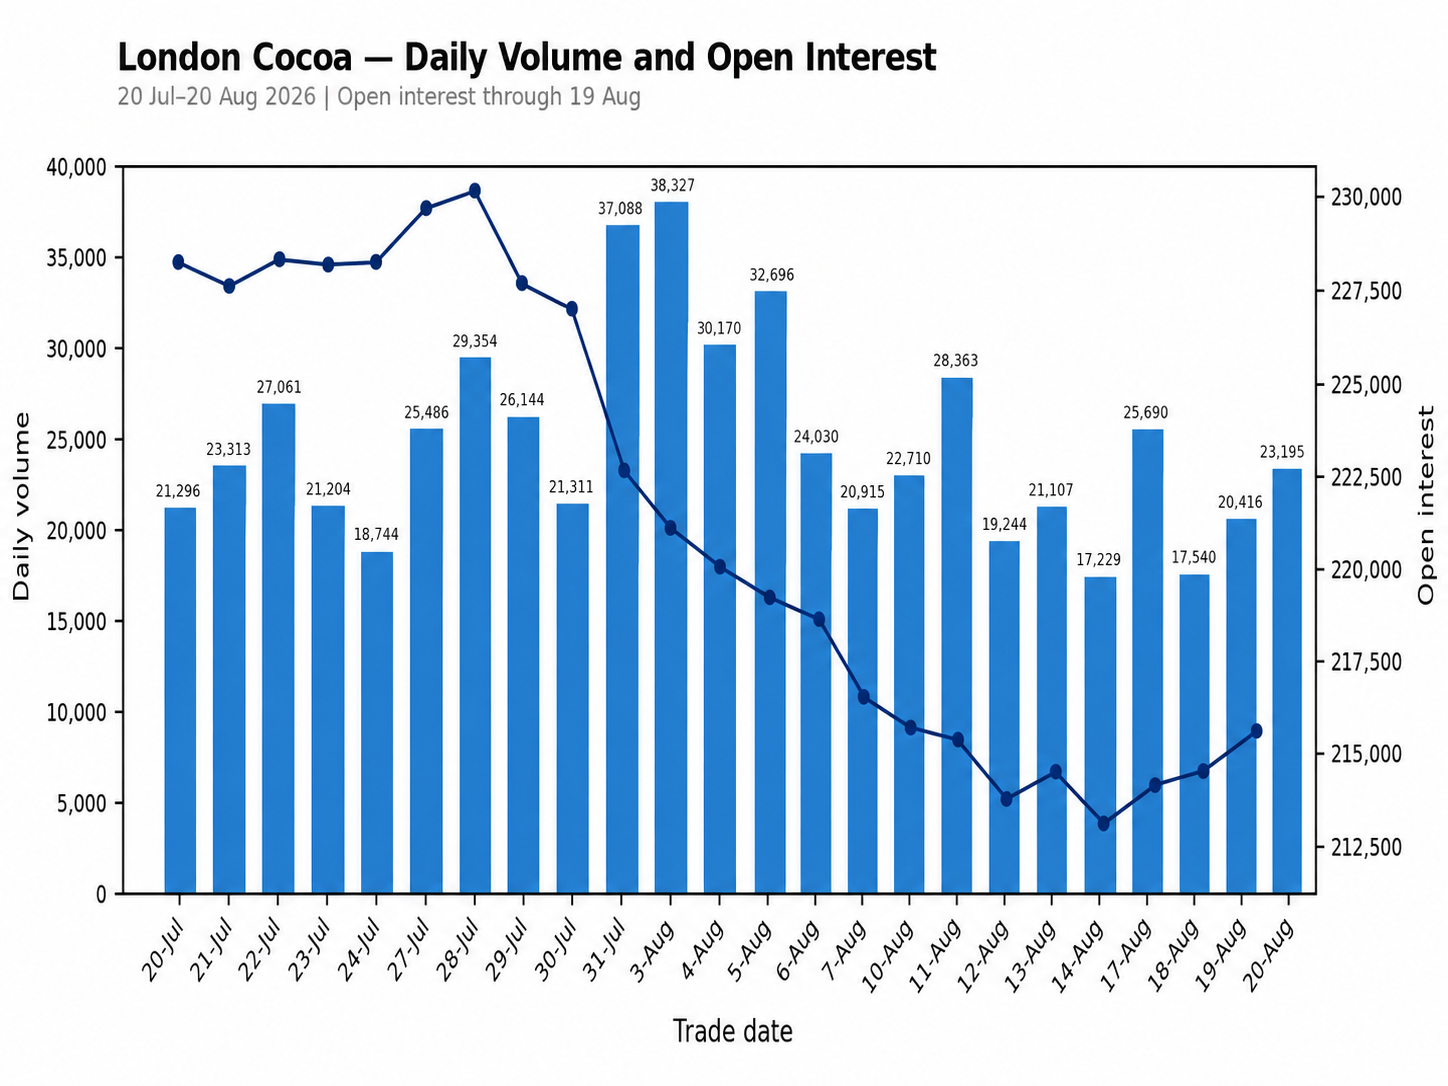
New York cocoa volume rose sharply to 60,352 contracts on 20 August, up 14,288 contracts, or 31.0%, from 46,064 on 19 August. Activity moved back above recent norms, with volume 12.3% above the preceding 20-session average of 53,744 contracts, although it remained 22.0% below the 11 August peak of 77,414 contracts.
The latest available open interest, for 19 August, declined to 173,513 contracts from 175,361, a fall of 1,848 contracts, or 1.1%. Open interest has now contracted by 31,421 contracts, or 15.3%, since 20 July, extending the pronounced reduction in outstanding positions seen through August.
The combination points to a market that has recently been deleveraging heavily, while turnover recovered strongly on 20 August. However, because open interest for 20 August is not yet available, it is too early to determine whether the latest increase in activity represented fresh positioning or predominantly covering and rollover-related trading.
London cocoa
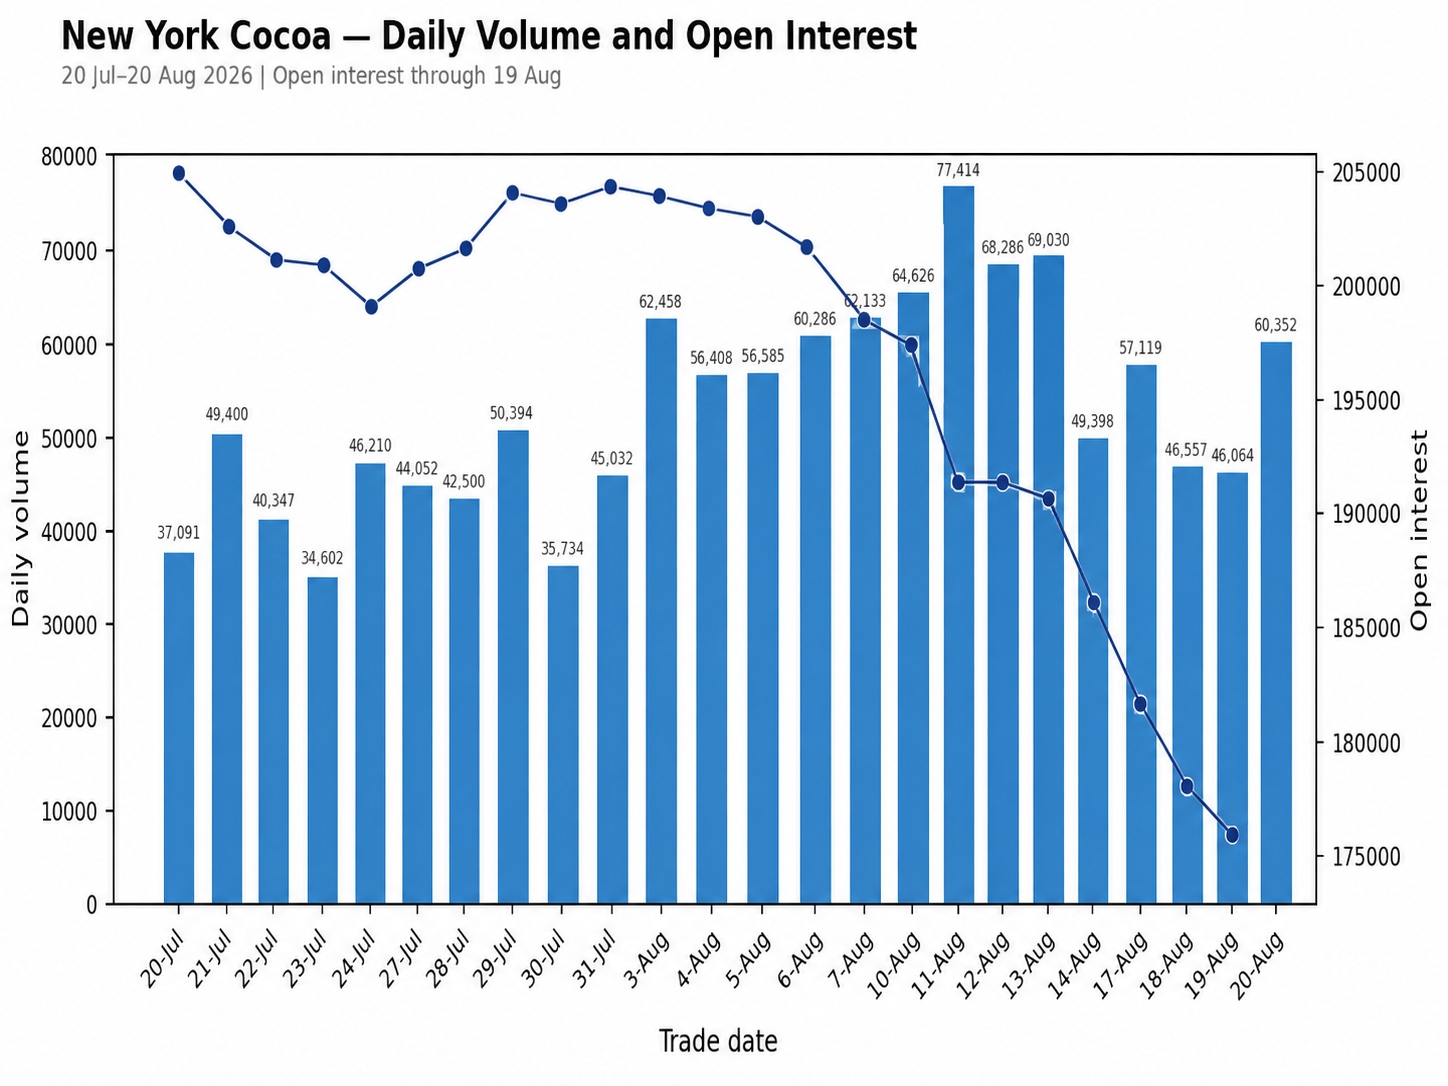
London cocoa volume increased to 23,195 contracts on 20 August, up 2,779 contracts, or 13.6%, from 20,416 on 19 August. Despite the improvement, activity remained 6.8% below the preceding 20-session average of 24,888 contracts and 39.5% below the recent peak of 38,327 contracts recorded on 3 August.
The latest available open interest increased to 215,408 contracts on 19 August, up 1,007 contracts, or 0.5%, from the previous session. This marks a modest recovery from the mid-August low of 212,838 contracts, although open interest remains 12,432 contracts, or 5.5%, below its 20 July level.
London therefore appears more stable than New York from a positioning perspective. Open interest has begun to recover while turnover has improved moderately, suggesting that the earlier liquidation phase may be easing. Participation nevertheless remains relatively subdued, so the data do not yet indicate a broad return of aggressive new positioning.
Exchange Trading Volume
| MARKET | 19 AUG 2026 | 20 AUG 2026 | CHANGE | CHANGE % |
|---|---|---|---|---|
| US | 3,348,274 | 3,349,507 | +1,233 | +0.04% |
| UK | 1,146,719 | 1,146,719 | 0 | 0.00% |
The measure is not a complete regional stock-to-grind ratio, as it includes only exchange-certified cocoa held at U.S. and EU delivery ports and excludes commercial inventories outside the ICE warehouse system. North America NCA grindings cover processors across North America, while ICE U.S. certified stocks are stored at U.S. delivery ports. ECA reports bean usage in European countries and London-certified cocoa is held in European and UK delivery locations.
Readers can explore detailed cocoa market datasets, futures statistics, and historical indicators in the CocoaIntel Data Hub:
 Cocoa Intel
Friday Outlook Dec Contract
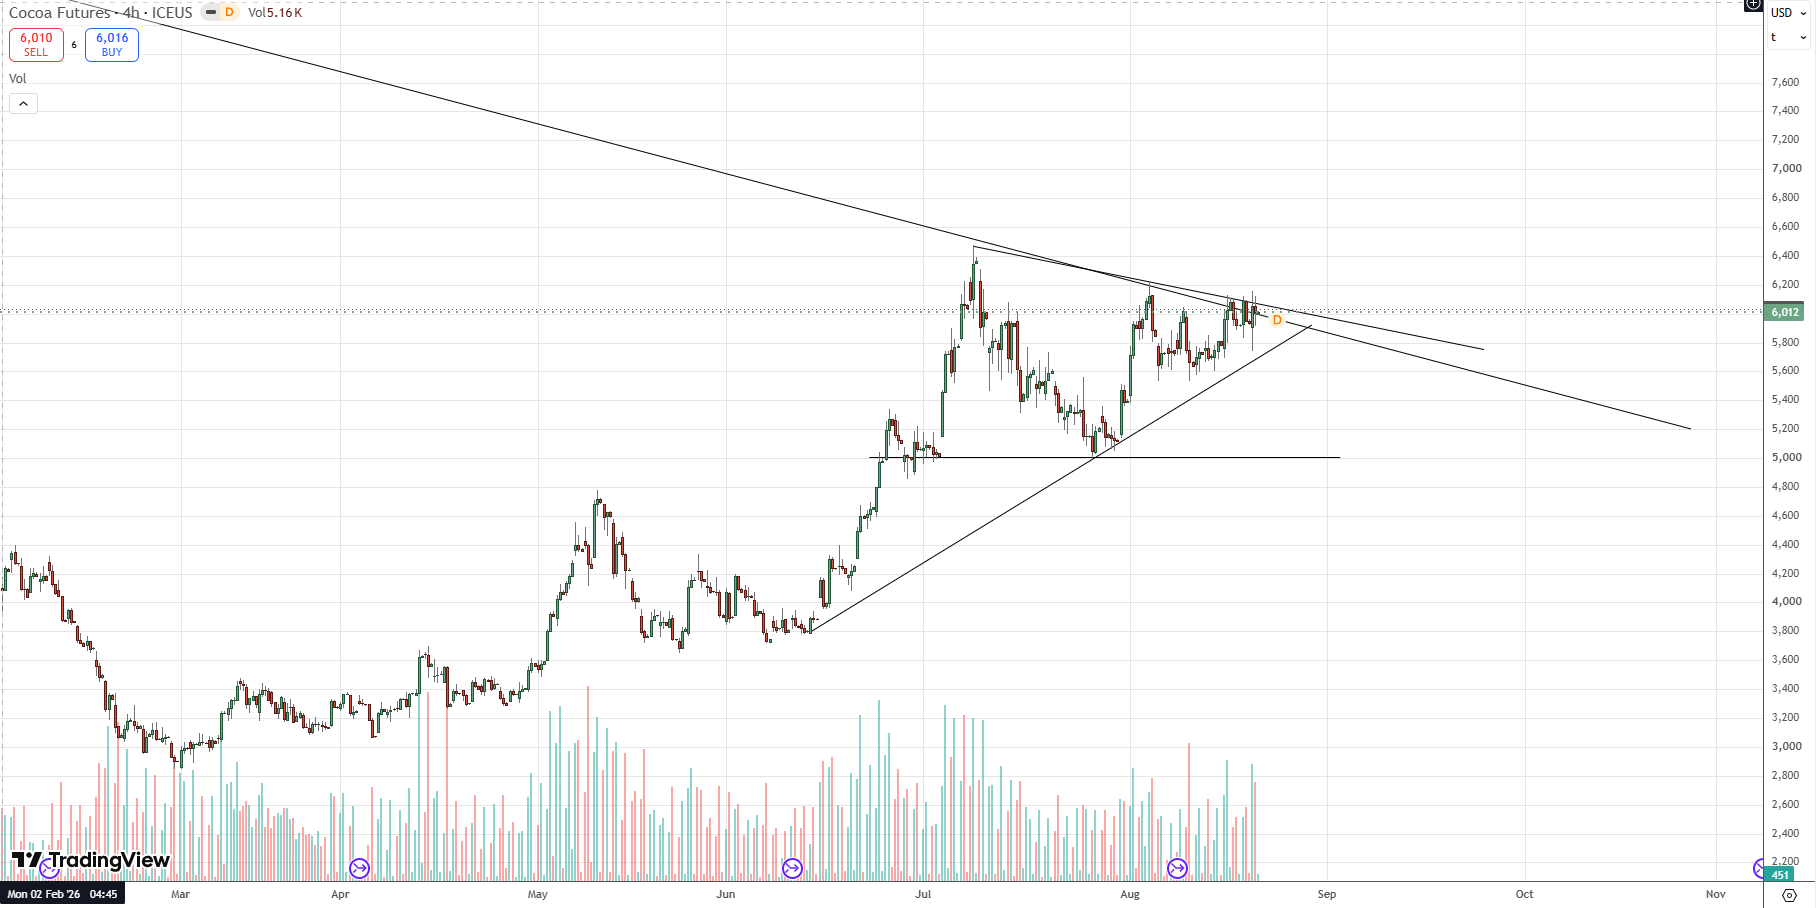
Despite the large intraday swings seen over recent sessions, the broader technical picture remains largely unchanged, with the contract still trading inside the contracting triangle that has developed during recent weeks.
The key boundaries remain around $6,150 on the upside and $5,750 on the downside. The lower boundary is particularly important because the rising support trendline is converging with the 21-day moving average, creating a stronger technical support zone around $5,750.
For Friday, the bias remains moderately bullish, but the market still needs confirmation. A sustained break above $6,150, accompanied by materially stronger volume and a close outside the triangle, would strengthen the case that the consolidation is resolving higher. Such a breakout could open a much larger upside move, with the broader technical structure potentially allowing prices to extend toward the $8,000 area over time.
Conversely, a confirmed break below $5,750 would invalidate the bullish triangle scenario and represent a significant deterioration in the technical structure. Because this level combines trendline support with the 21-day moving average, a decisive failure could accelerate liquidation and expose substantially lower levels, with the broader downside structure potentially extending toward the $4,000 area.
Until either boundary is broken convincingly, the market should still be treated as being in consolidation rather than in a confirmed new trend. Friday's most important signal will therefore not simply be whether $6,150 or $5,750 is briefly traded, but whether either level is broken with strong volume and sustained price acceptance outside the triangle.
If you notice any discrepancies in these figures or have extra information, please email hello@cocoaintel.com or leave a comment – corrections and additional insights are always welcome.