
Cocoa Continues to Consolidate as Supply Risks Build (21 August 2026)


New York cocoa ended Friday’s session lower after another volatile and strongly two-way trading day. Dec-26 opened at $6,024 and initially pushed higher, reaching an intraday high of $6,070, but the move above $6,000 again failed to generate sustained follow-through. Selling pressure subsequently drove the contract down to $5,948 before a partial recovery into the close at $5,981, leaving it $31, or 0.52%, below Thursday’s close.
Ghana crop outlook deteriorates ahead of 2026/27 season
Concerns over West African supply intensified after reports indicated that Ghana could produce around 650,000 tonnes of cocoa in the 2026/27 season, down from more than 750,000 tonnes in the current crop year. The estimate, reported on 20 August and based on field surveys and pod counts attributed to the Ghana Cocoa Board, would imply a decline of roughly 13% and a loss of around 100,000 tonnes of production. COCOBOD has not publicly confirmed the projection, meaning the figure should still be treated as a reported estimate rather than an official crop forecast.
The deterioration is being linked to a combination of increasingly uncertain weather conditions and disease pressure. A possible return of El Niño could expose producing areas to more irregular rainfall and periods of dryness, while recent heavy rainfall has increased concerns over black pod and other disease pressures. These risks are particularly important because the market had been expecting the recovery in West African production during 2025/26 to continue rebuilding global availability.
Nigerian cocoa exports rise 18% in July
Nigeria's cocoa bean exports increased by 18% year on year in July to 16,052 tonnes, providing a near-term bearish signal for the market and contributing to selling pressure during Friday's session. The increase points to stronger physical availability from Nigeria at a time when the market remains highly sensitive to changes in West African supply.
El Niño risk strengthens for the 2026/27 cocoa crop
Weather risk remains one of the most important bullish factors for the next cocoa season. The U.S. Climate Prediction Center now sees a greater than 90% probability that the developing El Niño will become a very strong event during the Northern Hemisphere autumn and winter of 2026/27. Historical evidence is particularly relevant for cocoa, with every strong El Niño episode over the past 55 years associated with lower global cocoa production, according to WisdomTree. The impact on West Africa is not limited to drought: the 2023/24 episode initially produced excessive rainfall that encouraged fungal disease before conditions shifted toward intense heat and unusually dry Harmattan winds.
Ghana prepares to close the 2026 Light Crop season
Ghana Cocoa Board has set 27 August as the deadline for Licensed Buying Companies to submit final returns for cocoa purchased during the 2026 Light Crop season, effectively bringing the secondary crop purchasing period to a close. The Light Crop season opened on 18 June, with COCOBOD maintaining the producer price at GH¢1,241 per 30-kilogram load, equivalent to GH¢2,587 per 64-kilogram gross bag, despite the decline in international cocoa prices.
Futures performance
New York cocoa
| CONTRACT | 20 AUG | 21 AUG | CHANGE | CHANGE % |
|---|---|---|---|---|
| Sep-26 | $6,021 | $5,901 | -$120 | -1.99% |
| Dec-26 | $6,012 | $5,981 | -$31 | -0.52% |
| Mar-27 | $6,083 | $6,066 | -$17 | -0.28% |
| May-27 | $6,091 | $6,085 | -$6 | -0.10% |
| Jul-27 | $6,075 | $6,071 | -$4 | -0.07% |
New York cocoa reversed lower on 21 August, with all five principal maturities finishing below their 20 August levels. The decline was heavily concentrated at the front of the curve. Sep-26 fell by $120 per tonne, or 1.99%, while Dec-26 lost $31, or 0.52%. Losses became progressively smaller further along the curve, with Jul-27 declining by only $4, or 0.07%.
Intraday volatility remained substantial, particularly in Sep-26. The first five contracts traded through ranges of between $108 and $247 per tonne. Sep-26 recorded by far the widest range, trading from $5,896 to $6,143 before finishing at $5,901. This represented a pronounced reversal from the session high and left the contract only around 2.0% above its daily low. Dec-26 traded between $5,948 and $6,070 before finishing at $5,981.
The closing position within the daily range deteriorated markedly compared with the previous session. The first five contracts finished approximately 2.0% to 45.4% above their respective session lows, compared with roughly 64.8% to 66.0% on 20 August. The particularly weak Sep-26 finish shows that the late-session recovery which characterised the previous trading day was largely absent at the very front of the market.
Total New York volume reached 48,687 contracts. Spread volume declined to 36,692 contracts from 40,403, a reduction of 3,711 contracts, or 9.2%. However, because overall turnover contracted more sharply, spreads increased to approximately 75.4% of total volume from 66.9% on 20 August.
EFP activity fell sharply to 734 contracts from 2,110, a decline of 65.2%. EFS volume increased from 11 contracts to 90, although activity remained small in absolute terms. No block volume was reported.
New York futures curve
The New York curve underwent a considerably more important structural adjustment than the headline changes in the deferred contracts suggest. Weakness was concentrated almost entirely at the nearby end, while Sep-27 and Dec-27 actually finished above their 20 August levels.
The most significant change occurred in the Sep-26/Dec-26 relationship. On 20 August, Sep-26 stood $9 above Dec-26. By 21 August, Sep-26 had fallen to $5,901 while Dec-26 closed at $5,981, creating an $80 contango. This represents an $89 one-day swing in the front spread and a pronounced weakening of the nearby contract relative to the remainder of the curve.
May-27 remained the peak of the curve at $6,085. From Sep-26 to May-27, the curve now rises by $184 per tonne, compared with only $70 on 20 August, illustrating how sharply the nearby structure steepened.
Further out, Sep-27 increased by $44 to $6,078 and Dec-27 rose by $50 to $6,001. As a result, Sep-27/Dec-27 backwardation narrowed slightly to $77 from $83. The overall move was therefore not a parallel decline in futures prices, but a pronounced bearish twist concentrated at the front of the New York curve
London cocoa
| CONTRACT | 20 AUG | 21 AUG | CHANGE | CHANGE % |
|---|---|---|---|---|
| Sep-26 | £4,283 | £4,270 | -£13 | -0.30% |
| Dec-26 | £4,330 | £4,320 | -£10 | -0.23% |
| Mar-27 | £4,450 | £4,444 | -£6 | -0.13% |
| May-27 | £4,456 | £4,450 | -£6 | -0.13% |
| Jul-27 | £4,447 | £4,446 | -£1 | -0.02% |
London cocoa also finished lower across all five principal maturities on 21 August, but the decline remained considerably more contained than in New York. Losses ranged from £1 to £13 per tonne, equivalent to only 0.02% to 0.30%.
Sep-26 was again the weakest of the five contracts, declining £13 to £4,270, while Dec-26 fell £10 to £4,320. Further along the curve, the changes were increasingly small, with Jul-27 finishing only £1 below its previous closing level.
Intraday trading nevertheless remained volatile. The first five contracts recorded ranges of between £96 and £104 per tonne. Sep-26 traded between £4,195 and £4,291 before recovering to £4,270, while Dec-26 moved between £4,241 and £4,344 before finishing at £4,320.
Unlike New York, London retained most of its intraday recovery. The first five contracts finished approximately 74.0% to 78.1% above their respective daily lows, broadly comparable with the 75.3% to 77.2% range recorded on 20 August. This indicates that although London experienced substantial selling pressure during the session, buyers again absorbed much of the decline before the final trade.
Total London volume fell to 15,671 contracts. Spread volume declined to 10,878 contracts from 13,393, a reduction of 2,515 contracts, or 18.8%. Nevertheless, spread activity increased to approximately 69.4% of total turnover from 57.7% on the previous session because outright activity contracted even more sharply.
EFP volume declined by 626 contracts, or 42.4%, from 1,478 to 852. EFS activity fell substantially from 140 contracts to only 20. No block volume was reported.
London futures curve
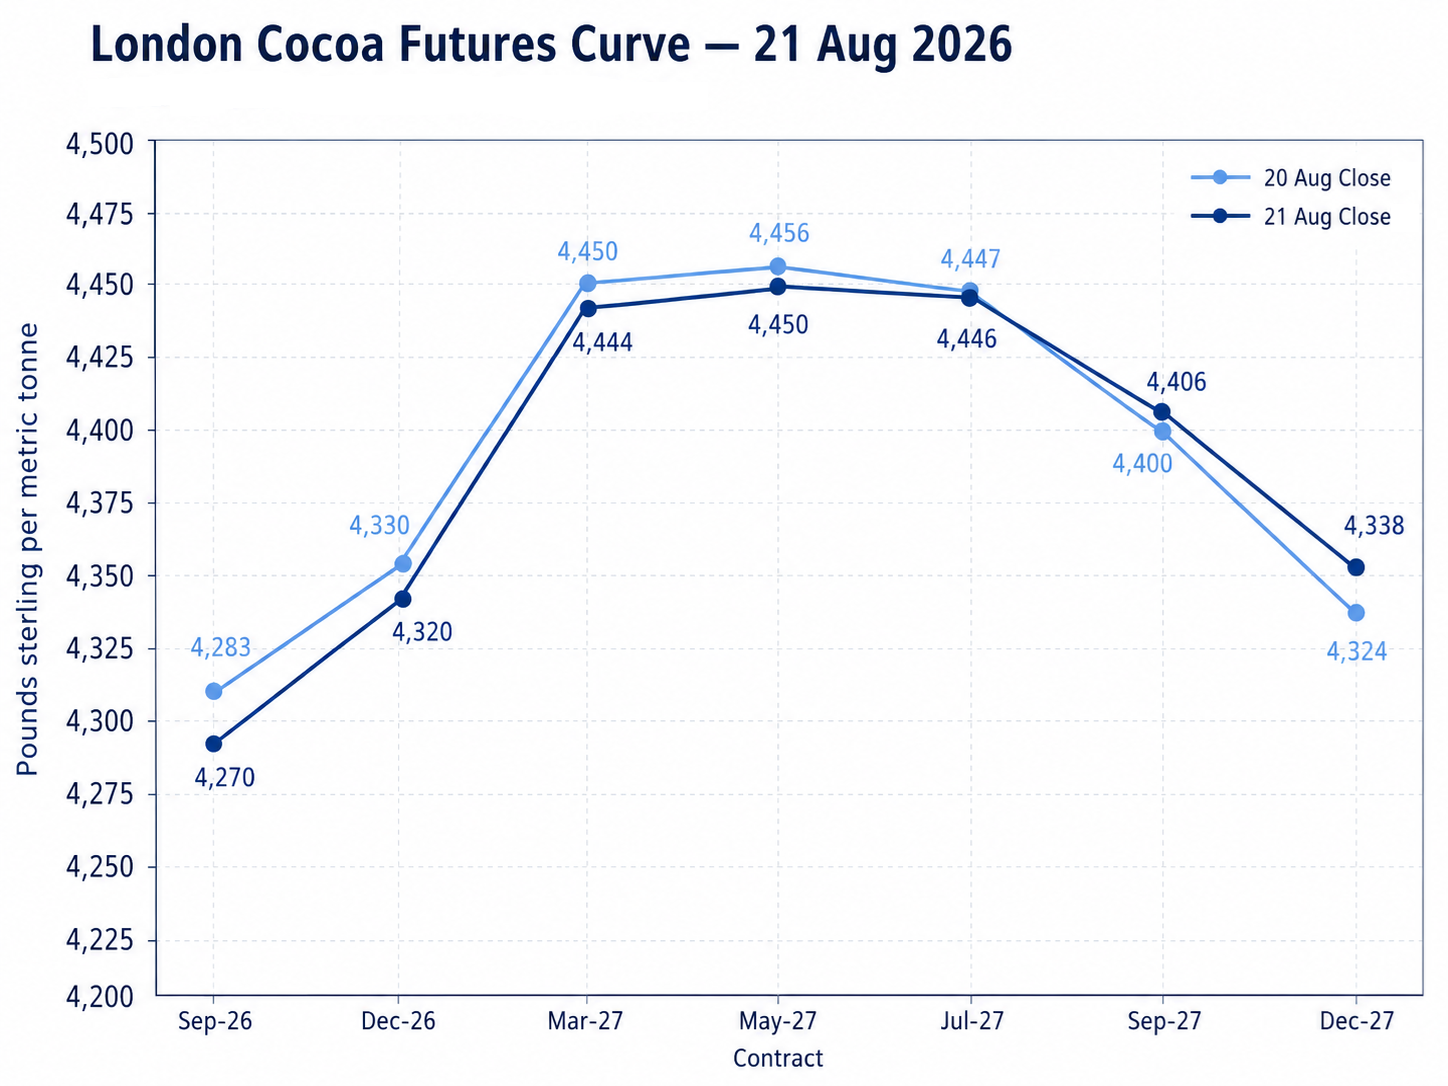
The London futures curve changed considerably less than its New York counterpart. Nearby contracts softened modestly, while the two most deferred maturities shown moved slightly higher.
Sep-26/Dec-26 contango widened marginally to £50 from £47. May-27 continued to mark the peak of the curve at £4,450, only £6 below its 20 August level. The Mar-27/May-27 portion of the structure therefore remained almost unchanged.
Further along the curve, Sep-27 increased by £6 to £4,406 and Dec-27 rose by £14 to £4,338. Consequently, Sep-27/Dec-27 backwardation narrowed to £68 from £76.
London therefore retained essentially the same broad curve profile. The key distinction from New York was the absence of a major front-end structural dislocation: London experienced a relatively modest downward adjustment, whereas New York saw a sharp repricing of the nearby contract relative to deferred maturities.
US–UK Spread
(Dec Contract)
$5,981 − (£4,320 x 1.363$/£) =$92ton (down from $105 ton)
Volume and Open Interest
New York cocoa
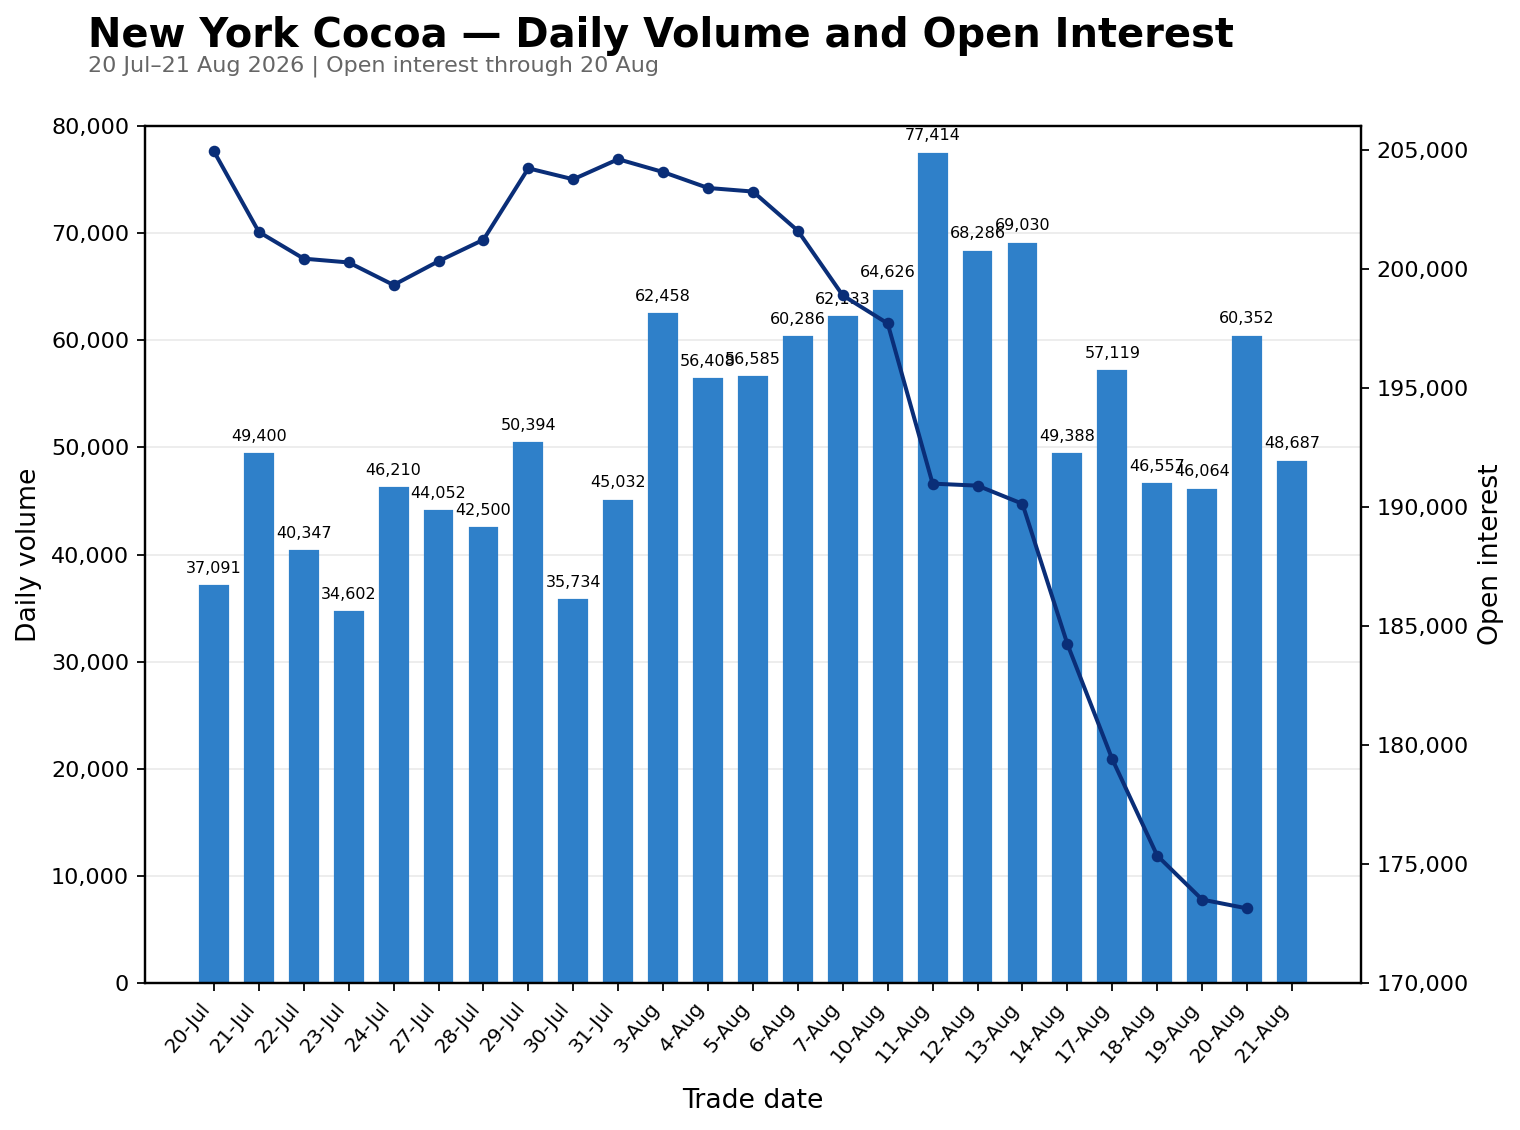
New York cocoa volume fell to 48,687 contracts on 21 August, down 11,665 contracts, or 19.3%, from 60,352 on 20 August. Activity moved back below recent norms, with turnover 11.5% below the preceding 20-session average of 55,031 contracts and 37.1% below the 11 August peak of 77,414 contracts.
The latest available open interest, for 20 August, declined to 173,143 contracts from 173,513, a fall of 370 contracts, or 0.2%. Open interest has now contracted by 31,791 contracts, or 15.5%, since 20 July, extending the pronounced reduction in outstanding positions seen throughout August.
The combination continues to point to a market that has been deleveraging substantially. The sharp fall in 21 August turnover following the previous session's rebound suggests that participation remained restrained, while the continued decline in the latest available open interest provides little evidence so far of a meaningful rebuild in outright positioning.
London cocoa
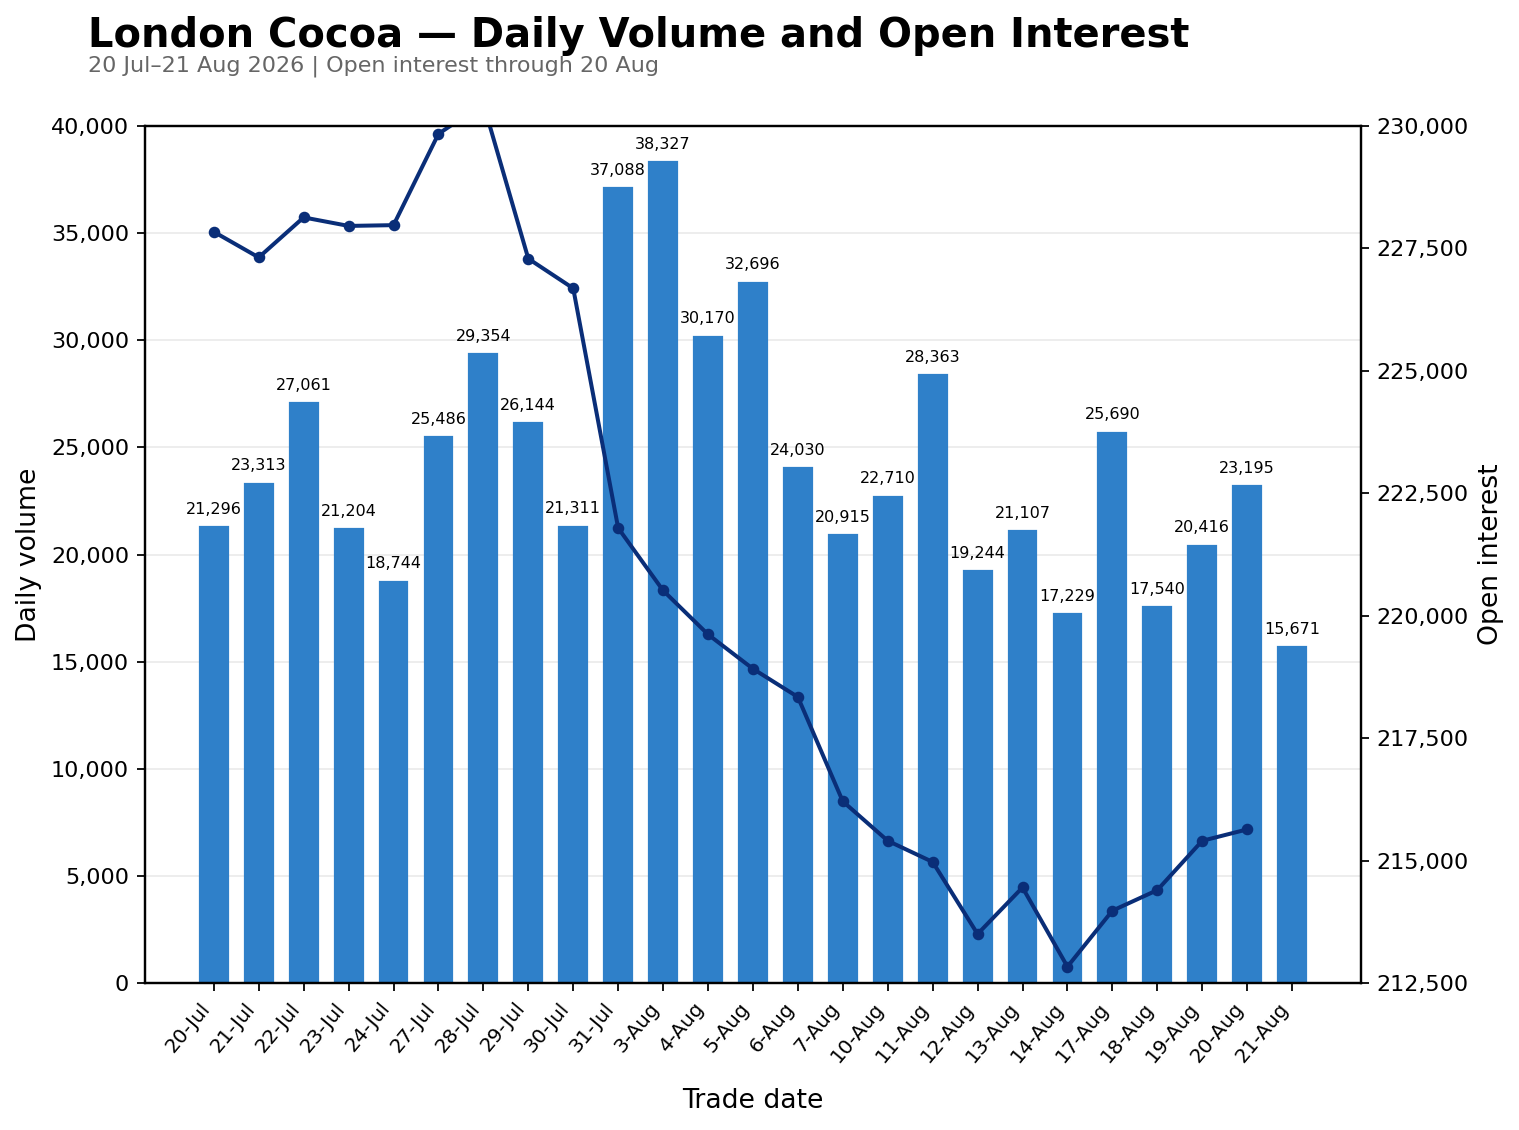
London cocoa volume fell sharply to 15,671 contracts on 21 August, down 7,524 contracts, or 32.4%, from 23,195 on 20 August. Turnover dropped well below recent norms, finishing 37.3% below the preceding 20-session average of 24,988 contracts and 59.1% below the 3 August peak of 38,327 contracts.
The latest available open interest, for 20 August, increased slightly to 215,640 contracts from 215,408, a gain of 232 contracts, or 0.1%. This represented the fourth consecutive increase from the 14 August low of 212,838 contracts. Nevertheless, open interest remained 12,200 contracts, or 5.4%, below its 20 July level of 227,840, meaning that the broader contraction in outstanding positions has not yet been reversed.
The latest pattern therefore differs somewhat from New York. London open interest has begun to stabilise and recover modestly, but the sharp reduction in 21 August turnover indicates that participation weakened considerably. The combination is more consistent with limited repositioning than with a broad return of new market exposure. Confirmation will require the 21 August open-interest figure, particularly to determine whether the recent recovery in outstanding positions continued despite the much lower trading volume.
Commitments of Traders
The latest COT data for 18 August show that speculative positioning remained bearish in both New York and London, although the New York report also points to substantial position reduction rather than aggressive new short accumulation.
In New York, non-commercial traders held 21,920 long contracts against 39,008 shorts, leaving them net short by 17,088 contracts. This was an improvement from a net short position of 18,550 contracts one week earlier, as short positions were reduced by 2,919 contracts compared with a smaller 1,457-contract decline in longs. The resulting 1,462-contract reduction in the speculative net short indicates modest short covering rather than a meaningful shift toward outright bullish positioning. Non-commercial spreading positions also fell sharply by 6,599 contracts to 80,871.
The more significant development was the contraction in overall positioning. Futures-and-options open interest fell by 28,281 contracts during the week to 229,991, a decline of around 11.0%. Commercial participants also reduced exposure on both sides, with longs falling by 6,403 contracts and shorts by 6,895. Their net long position nevertheless increased slightly to 13,750 contracts from 13,258. The broad decline in open interest reinforces the evidence of continued deleveraging and position liquidation across the New York market.
London positioning also remained cautious. Managed Money held only 5,923 outright longs against 11,945 shorts, leaving the category net short by 6,022 contracts, equivalent to around 2.0% of total open interest. However, Managed Money also held 40,862 spreading positions, substantially larger than its outright directional exposure, suggesting that a significant proportion of activity remained concentrated in relative-value and spread strategies rather than strong directional conviction.
Producer, Merchant, Processor and User participants in London were net short by 25,748 contracts, while Swap Dealers were net long by 31,166 contracts. Other Reportables were almost directionally neutral, with a net long position of only 177 contracts, but held a very large 50,069-contract spreading position. This again highlights the unusually important role of spread positioning in the current London structure.
Exchange Trading Volume
| MARKET | 20 AUG 2026 | 21 AUG 2026 | CHANGE | CHANGE % |
|---|---|---|---|---|
| US | 3,349,507 | 3,354,833 | +5,326 | +0.16% |
| UK | 1,146,719 | 1,146,719 | 0 | 0.00% |
The measure is not a complete regional stock-to-grind ratio, as it includes only exchange-certified cocoa held at U.S. and EU delivery ports and excludes commercial inventories outside the ICE warehouse system. North America NCA grindings cover processors across North America, while ICE U.S. certified stocks are stored at U.S. delivery ports. ECA reports bean usage in European countries and London-certified cocoa is held in European and UK delivery locations.
Readers can explore detailed cocoa market datasets, futures statistics, and historical indicators in the CocoaIntel Data Hub:
 Cocoa Intel
Monday Outlook Dec Contract
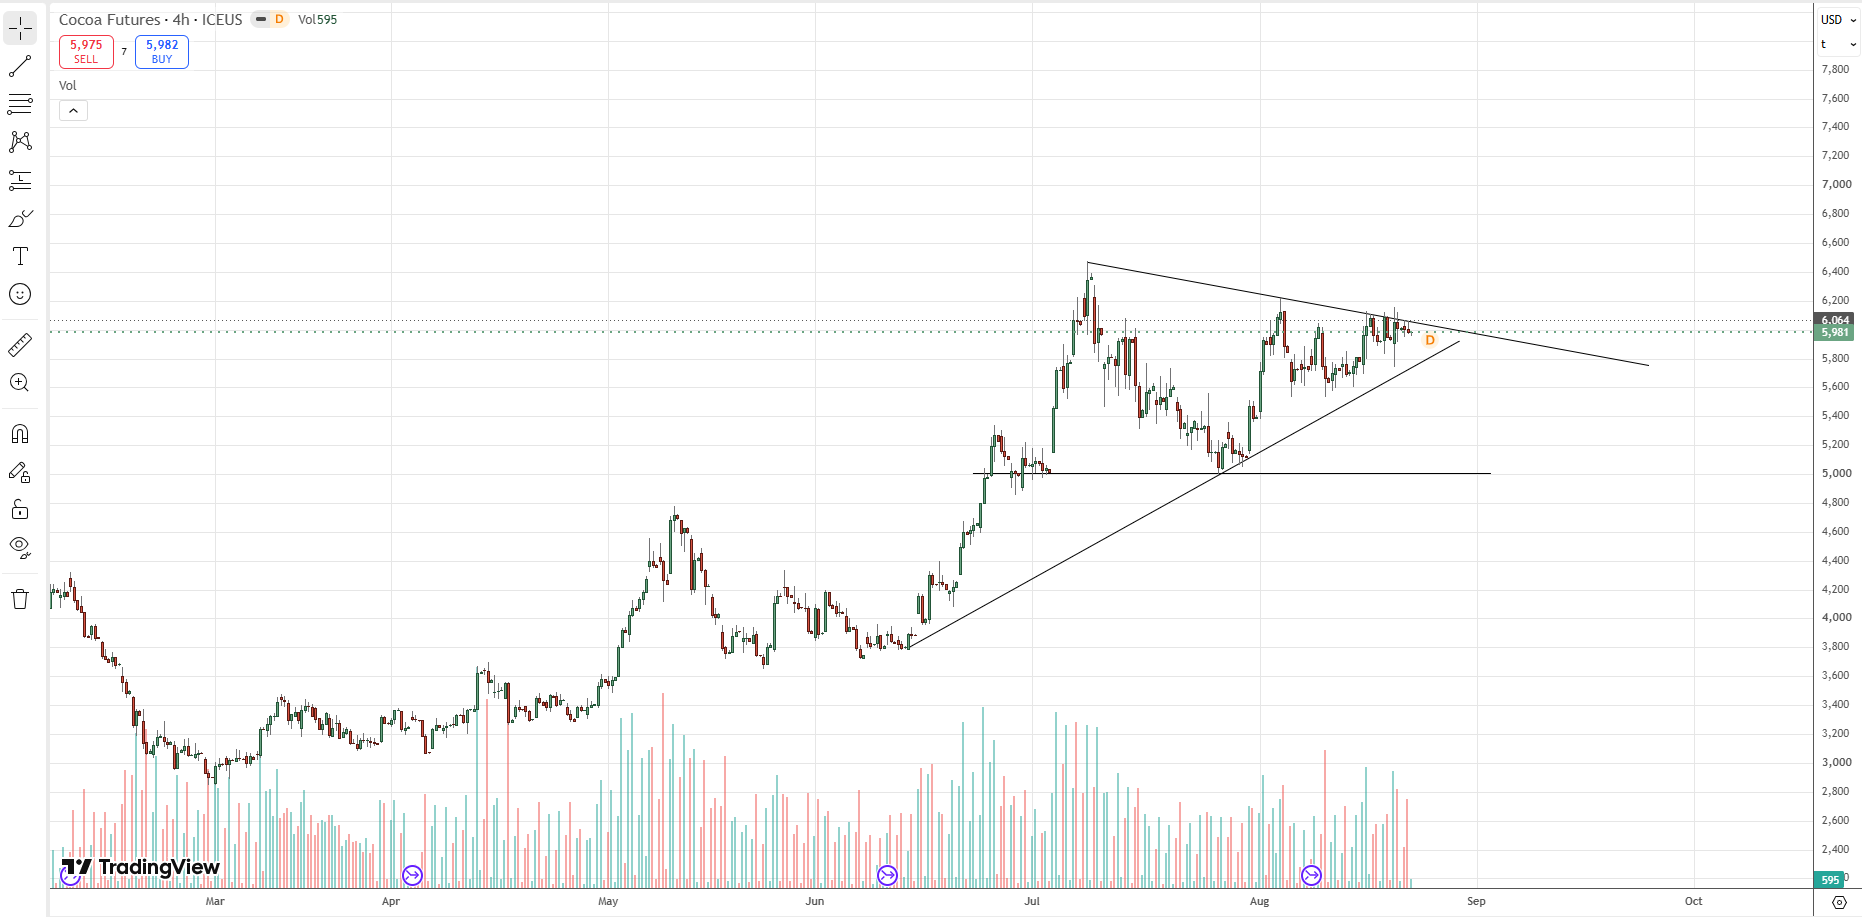
New York cocoa continues to consolidate within an increasingly tight symmetrical triangle, with Dec-26 closing around $5,981 and price approaching a potentially important technical inflection point. The upper boundary of the pattern is defined by the descending trendline currently crossing the $6,100 area, which remains the principal resistance zone. A decisive break above this level, accompanied by stronger volume and subsequent confirmation through sustained trading or a successful retest, would represent a meaningful bullish breakout and could initially expose the July highs around $6,600 before opening the way toward the broader $7,000-$7,500 measured-move area. On the downside, the 9-day SMA has acted as effective near-term support during the past five sessions, while the more important structural support lies around $5,700, where the rising lower boundary of the triangle converges with the 21-day SMA. A confirmed break below this support cluster on expanding volume would materially weaken the structure and could expose $5,000 initially, followed by deeper downside risk toward the $4,700 area. Until either boundary is decisively broken, the market remains in consolidation, although the continued defence of the short-term moving averages and rising support trendline leaves the technical bias modestly bullish.
If you notice any discrepancies in these figures or have extra information, please email hello@cocoaintel.com or leave a comment – corrections and additional insights are always welcome.