
Cocoa Defends $5,750 as Delayed Ivorian Crop Raises Supply Concerns (26 August 2026)


New York December cocoa experienced a volatile session, advancing $175, or 3.0%, from its $5,825 opening level to test the important $6,000 resistance before reversing by $240, or 4.0%, to an intraday low of $5,760. Buyers again defended the $5,750 support area, allowing prices to recover $69, or 1.2%, and finish at $5,829. This represented a daily decline of $15, or 0.26%, from the previous closing price of $5,844 and reinforced the market’s consolidation between $5,750 and $6,100.
Delayed Ivorian Main Crop Raises Near-Term Supply Concerns
After the market closed, Reuters reported that Côte d’Ivoire’s Coffee and Cocoa Council is concerned that the 2026/27 main crop could be delayed by eight to ten weeks. Difficult weather, insufficient farm maintenance and the strength of the preceding mid-crop have reportedly slowed the development of the new crop. Exporters consequently expect possible congestion at Abidjan and San Pedro in November and December as shipments are concentrated ahead of the year-end implementation of stricter EU deforestation rules.
Although the new season officially begins on 1 September, weekly arrivals are expected to remain below 15,000 tonnes during September and 25,000 tonnes in October. Larger volumes may begin reaching ports from late October or early November and accelerate through December. The regulator expects main-crop arrivals of up to 1.4 million tonnes by the end of February 2027, while exporters estimate between 1.4 million and 1.45 million tonnes.
Cameroon Cocoa Exports Fall 34.7% as Ending Stocks Build
ONCC data showed that Cameroon’s raw cocoa-bean exports fell 34.65% year on year to 125,469 tonnes during the 2025/26 season, while marketed production declined 19.9% to 247,914 tonnes. However, ending stocks rose sharply from 13,946 to approximately 40,446 tonnes, indicating that the export contraction partly reflected retained or unsold beans rather than an equivalent reduction in physical supply.
Futures performance
New York cocoa
| Contract | 25 Aug | 26 Aug | Change | Change % |
|---|---|---|---|---|
| Sep-26 | $5,816 | $5,842 | +$26 | +0.45% |
| Dec-26 | $5,844 | $5,829 | −$15 | −0.26% |
| Mar-27 | $5,956 | $5,933 | −$23 | −0.39% |
| May-27 | $5,985 | $5,965 | −$20 | −0.33% |
| Jul-27 | $5,987 | $5,970 | −$17 | −0.28% |
New York cocoa was mixed across the first five principal maturities. Sep-26 was the sole gainer, rising $26, or 0.45%, to $5,842. The other four contracts declined by $15 to $23 per tonne. Mar-27 was the weakest, falling $23, or 0.39%, while Dec-26 was the most resilient declining maturity, easing $15, or 0.26%.
The first five contracts traded through ranges of $74 to $240 per tonne. The expiring Sep-26 contract finished at its daily low on volume of only three contracts. The more actively traded Dec-26 through Jul-27 contracts recorded ranges of $198 to $240.
Excluding Sep-26, these maturities finished only 24.5% to 30.8% above their daily lows, compared with 47.3% to 64.9% on 25 August. This shows that the strong intraday advances were not sustained and selling pressure dominated the latter part of the session.
Total volume fell 12.8% to 32,833 contracts. Spread volume declined 15.8% to 20,648, reducing its share of turnover from 65.1% to 62.9%. Implied outright volume fell 7.2% to 12,185 contracts. EFP activity dropped 69.2% to 161 contracts, with no EFS or block volume reported.
New York futures curve
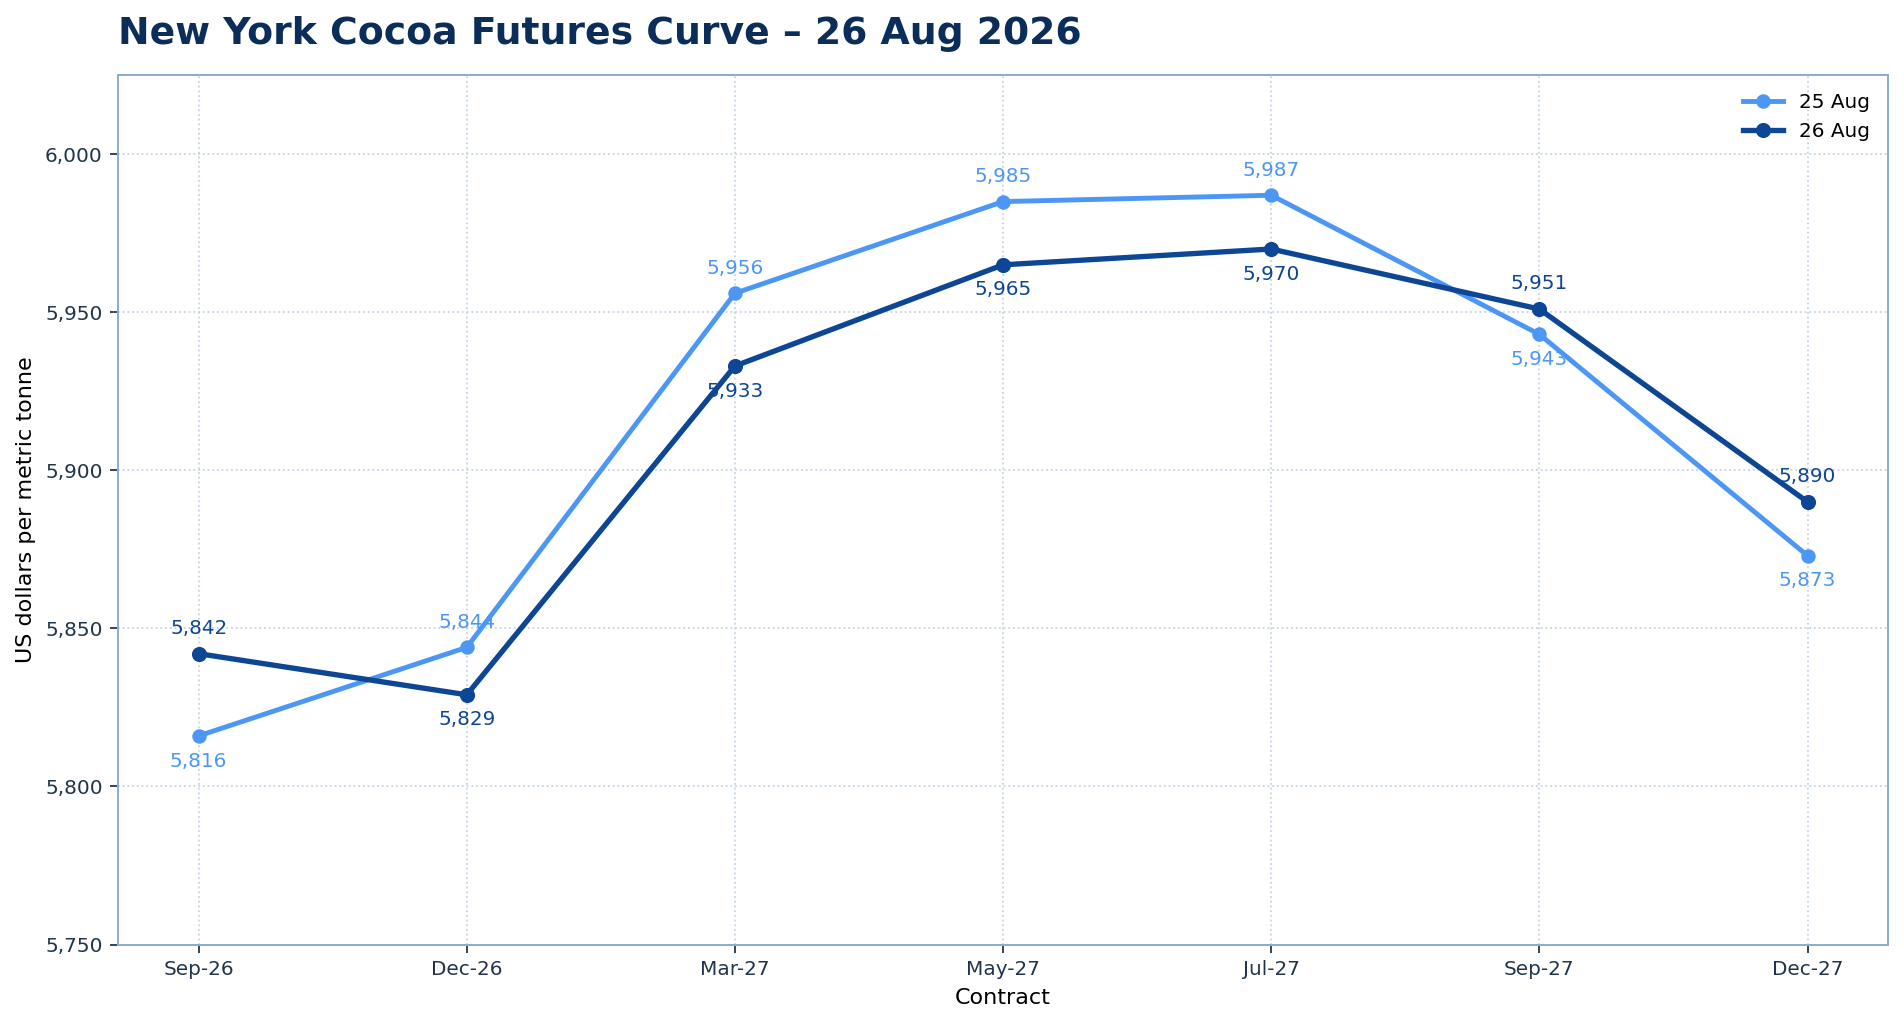
The curve recorded a distinctly non-parallel adjustment. Sep-26 and the two back-end maturities gained, while Dec-26 through Jul-27 weakened.
Sep-26/Dec-26 changed from $28 contango to $13 backwardation—a $41 strengthening of Sep-26 relative to Dec-26. This inversion should be treated cautiously because Sep-26 traded only three contracts.
Dec-26/Mar-27 contango narrowed from $112 to $104. Mar-27/May-27 contango widened from $29 to $32, while May-27/Jul-27 contango increased from $2 to $5. Jul-27 remained the curve peak at $5,970.
Further out, Jul-27/Sep-27 backwardation eased from $44 to $19, while Sep-27/Dec-27 backwardation narrowed from $70 to $61. The peak-to-trough amplitude compressed from $171 to $141 per tonne.
London cocoa
| Contract | 25 Aug | 26 Aug | Change | Change % |
|---|---|---|---|---|
| Sep-26 | £4,135 | £4,173 | +£38 | +0.92% |
| Dec-26 | £4,200 | £4,261 | +£61 | +1.45% |
| Mar-27 | £4,317 | £4,380 | +£63 | +1.46% |
| May-27 | £4,325 | £4,378 | +£53 | +1.23% |
| Jul-27 | £4,323 | £4,372 | +£49 | +1.13% |
London cocoa rebounded across all five principal maturities. Gains ranged from £38 to £63 per tonne, equivalent to 0.92% to 1.46%. Mar-27 was the strongest contract, rising £63, or 1.46%, while Sep-26 recorded the smallest gain at £38, or 0.92%.
Intraday ranges were tightly grouped between £143 and £153 per tonne. The first five contracts finished between 45.5% and 54.2% above their daily lows, compared with only 21.6% to 33.3% on 25 August. Every maturity therefore ended close to the midpoint of its range.
Total volume increased 29.5% to 32,479 contracts. Spread volume rose 30.0% to 22,367, while implied outright volume increased 28.6% to 10,112. Spread trading accounted for 68.9% of turnover, broadly unchanged from 68.6%.
EFP activity declined 23.1% to 397 contracts. EFS activity surged from 150 to 1,894 contracts, all recorded in Sep-26. No block volume was reported.
London futures curve
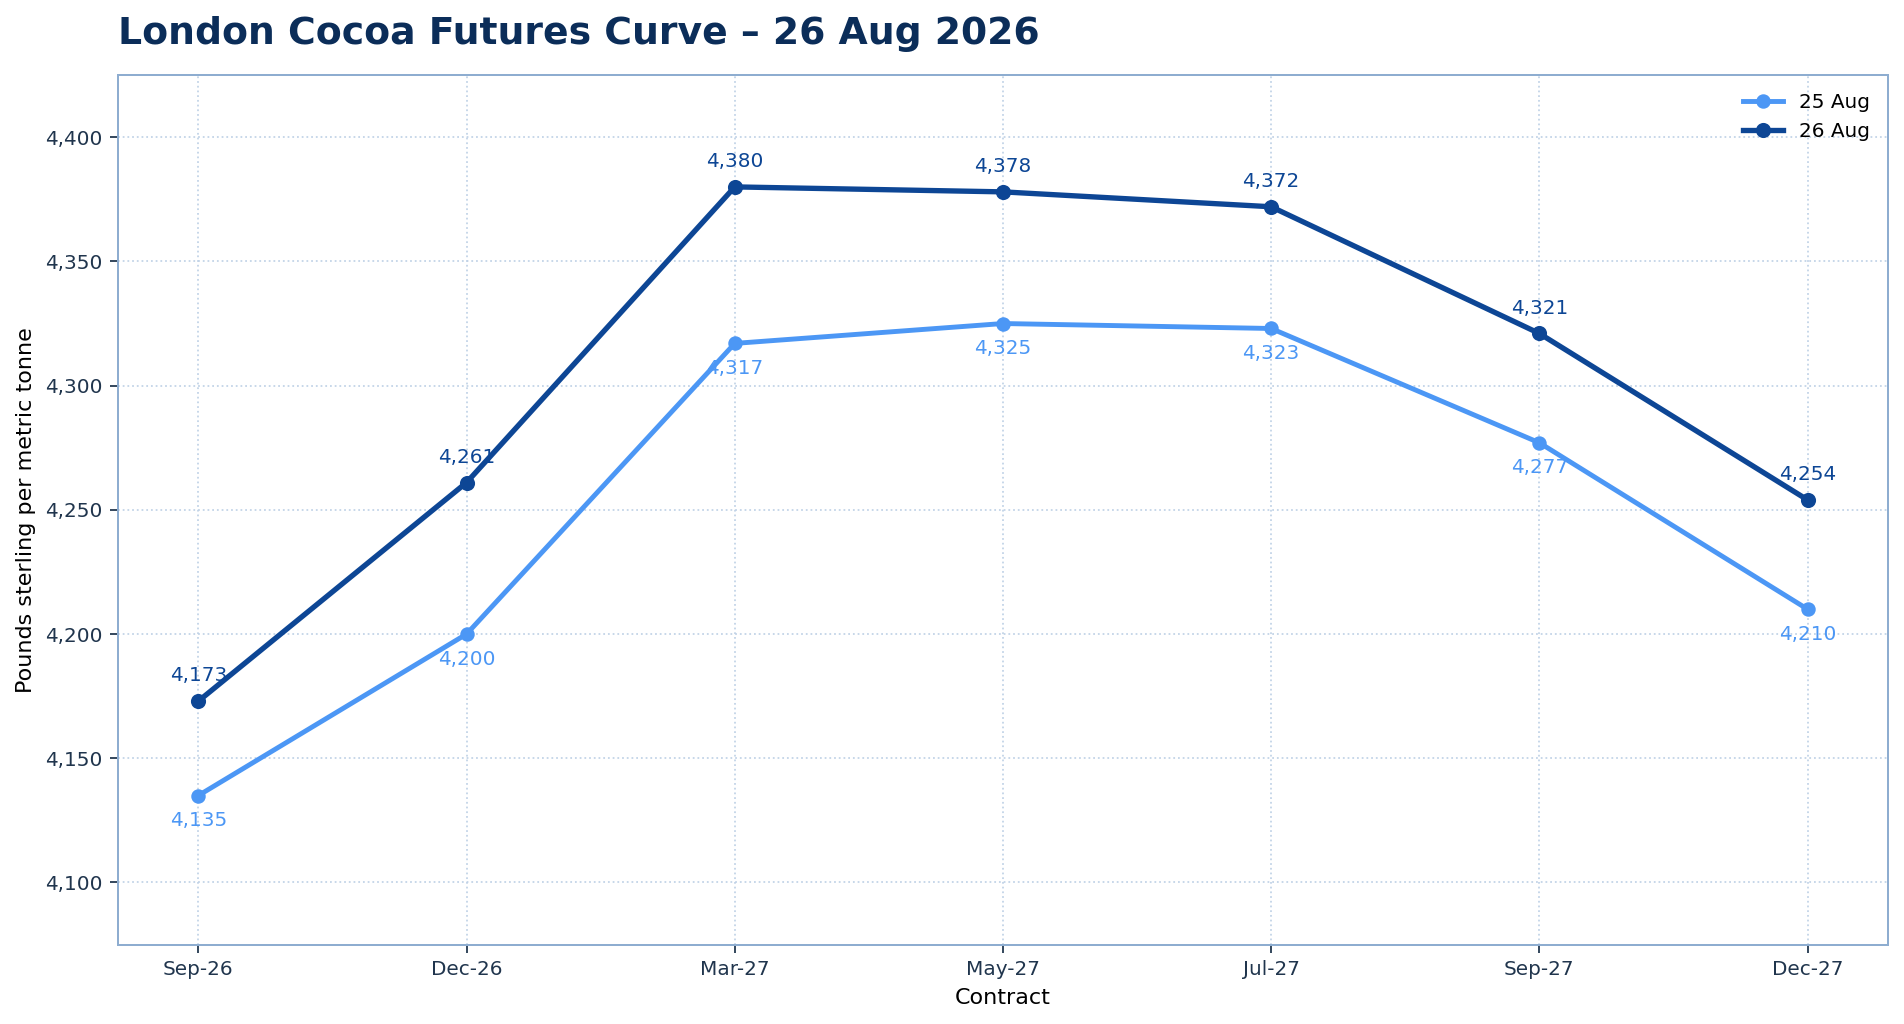
London’s curve moved higher across all seven maturities, with the strongest gains concentrated around Dec-26 and Mar-27.
Sep-26/Dec-26 contango widened from £65 to £88, reflecting nearby underperformance. Dec-26/Mar-27 contango increased slightly from £117 to £119. The curve now rises £207 from Sep-26 to Mar-27, compared with £182 previously.
Mar-27/May-27 changed from £8 contango to £2 backwardation, shifting the peak from May-27 to Mar-27. May-27/Jul-27 backwardation deepened from £2 to £6. Beyond this, Jul-27/Sep-27 backwardation widened from £46 to £51, while Sep-27/Dec-27 remained unchanged at £67.
US–UK Spread
(Dec Contract)
$5,829 − (£4,261 x 1.360$/£) =$34ton (down from $115 ton)
Volume and Open Interest
New York cocoa
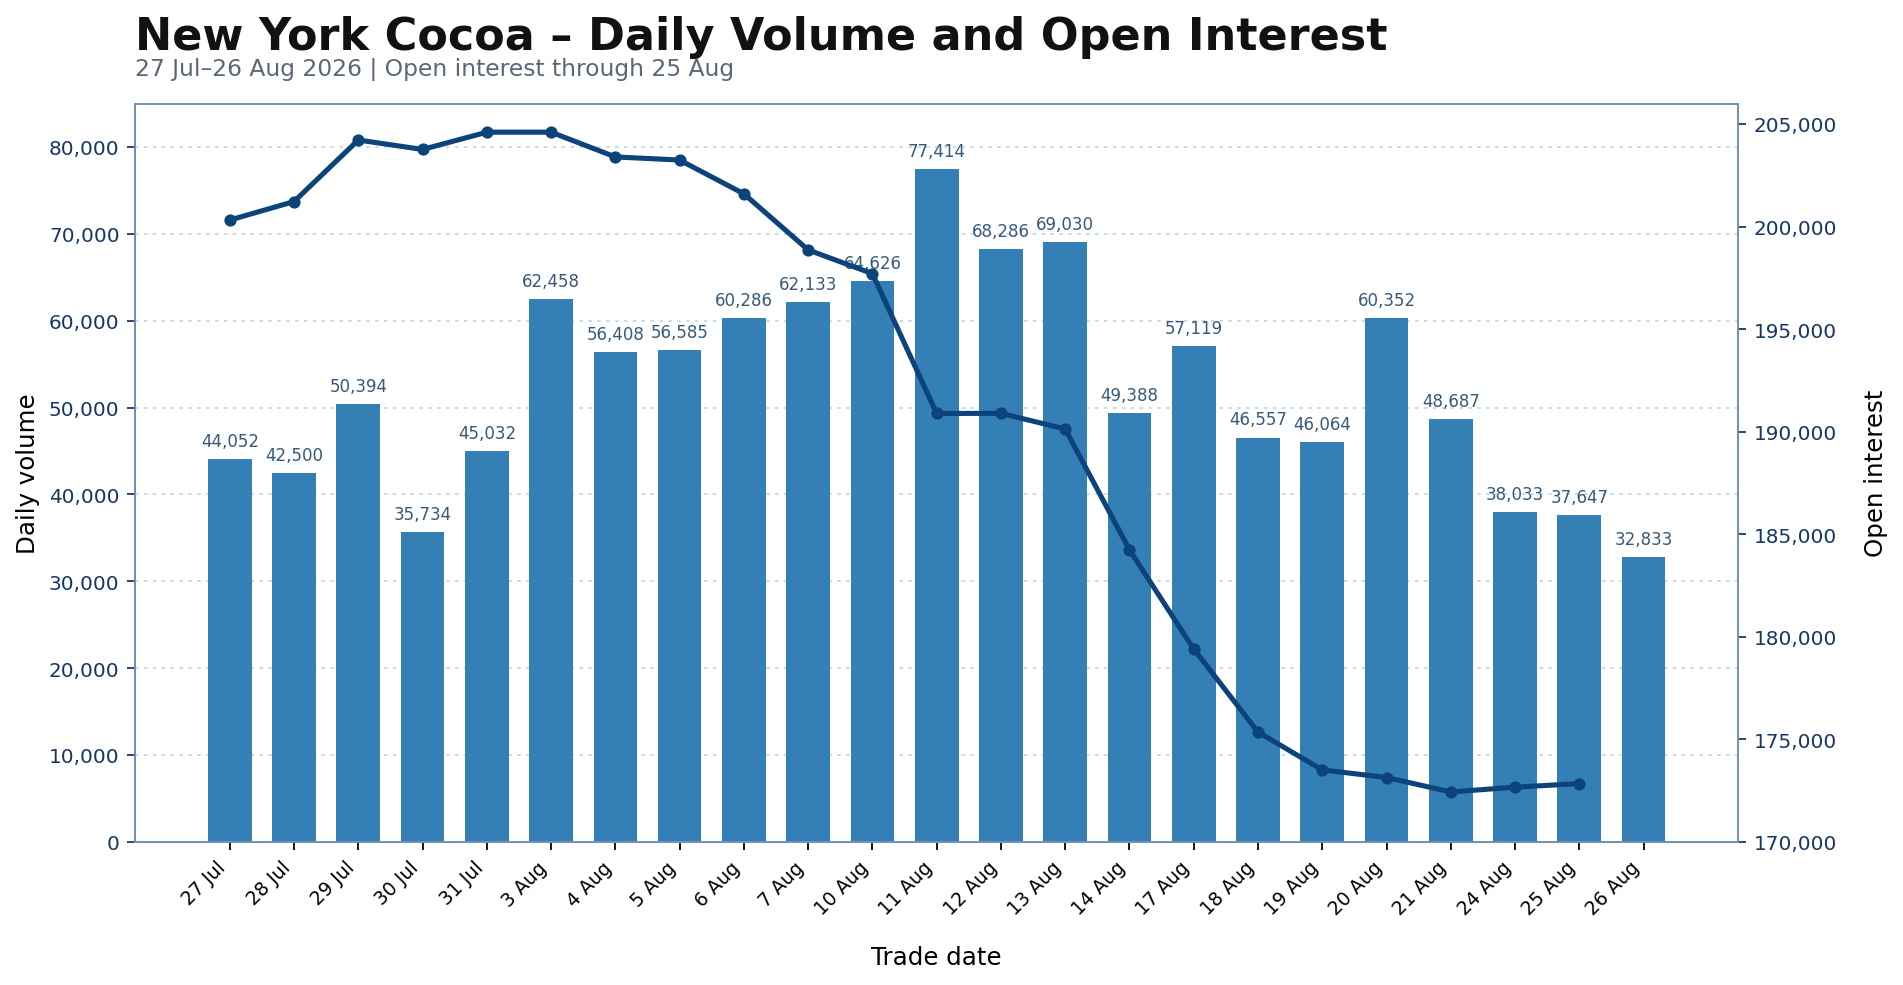
New York cocoa volume declined to 32,833 contracts on 26 August, down 4,814 contracts, or 12.8%, from 37,647 on 25 August. This was the lowest turnover of the displayed period. Volume stood 39.9% below the preceding 20-session average of 54,612 contracts and 57.6% below the period peak of 77,414 recorded on 11 August.
The latest available open interest, for 25 August, increased slightly to 172,846 contracts from 172,672 on 24 August, a rise of 174 contracts, or 0.1%. Despite this increase, open interest remained 27,475 contracts, or 13.7%, below its 27 July level and 31,760 contracts, or 15.5%, below the period peak of 204,606 first recorded on 31 July. No figure was reported for 26 August.
The combination continues to indicate subdued market participation following the sharp deleveraging seen through August. Turnover fell to a new period low, while the marginal increase in the latest open interest was insufficient to signal meaningful rebuilding of positions.
London cocoa
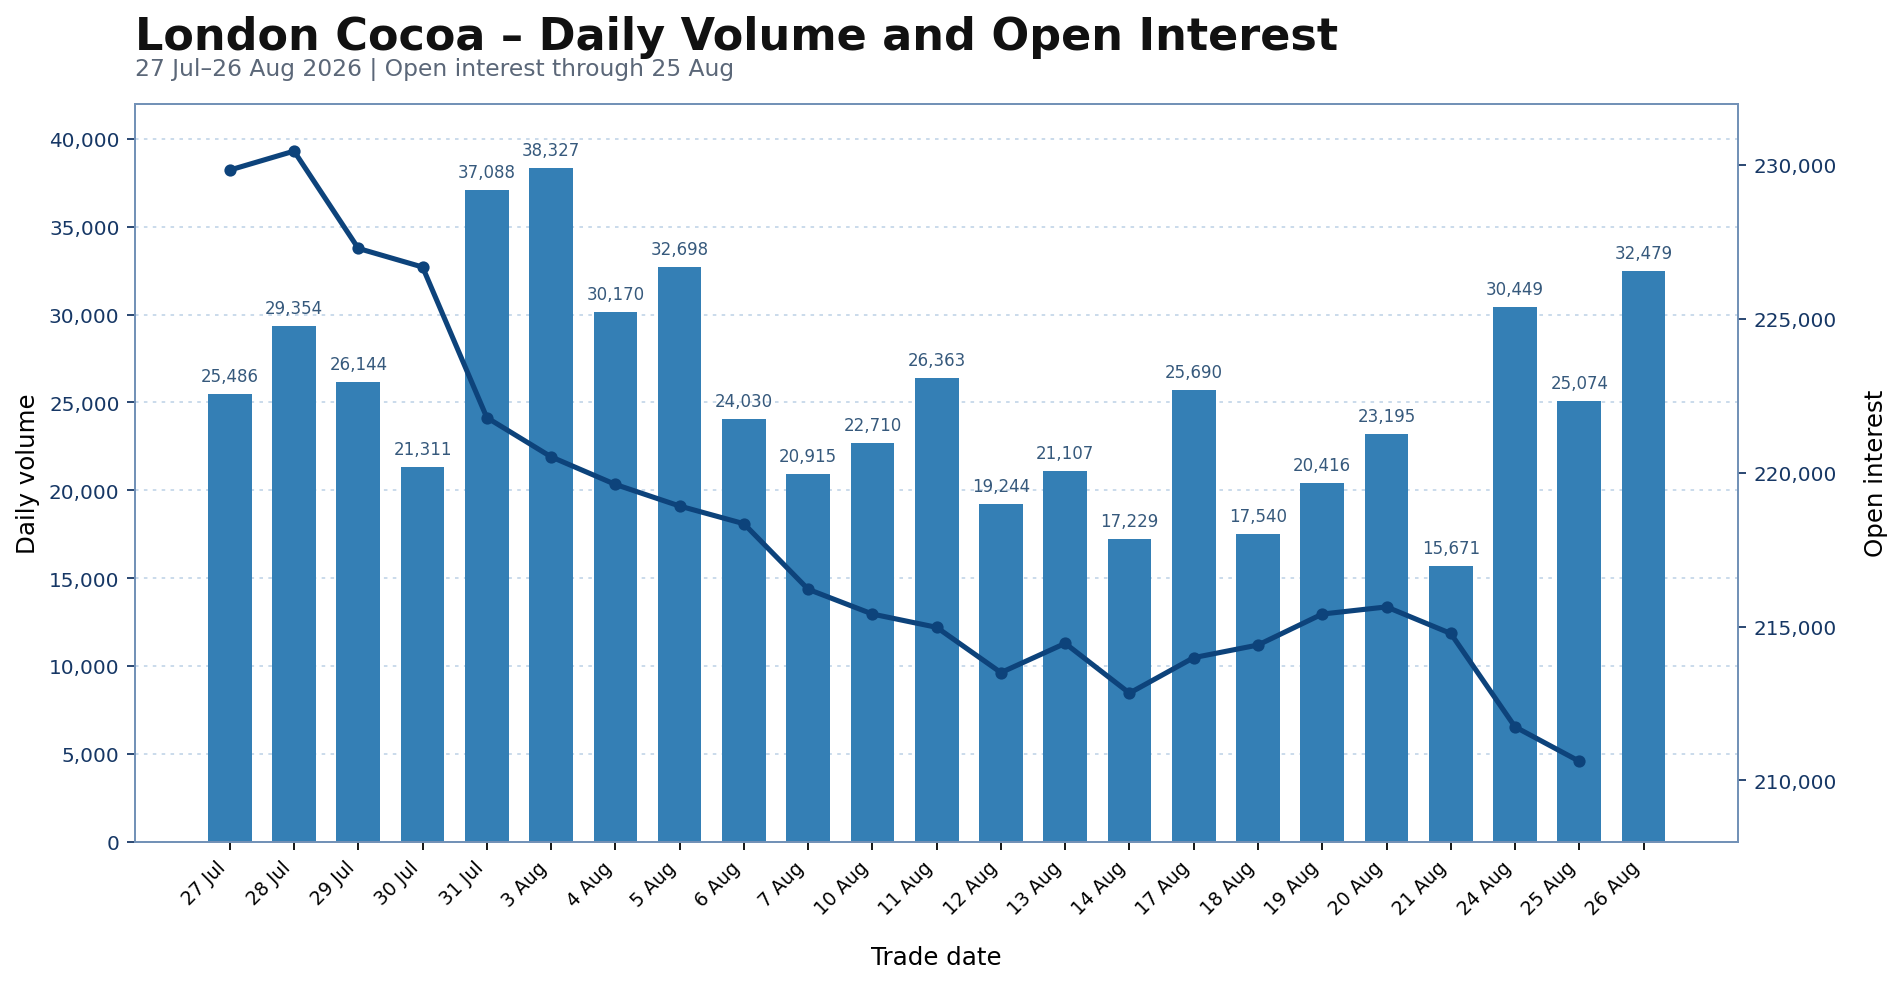
London cocoa volume rebounded to 32,479 contracts on 26 August, increasing by 7,405 contracts, or 29.5%, from 25,074 on 25 August. Turnover stood 31.1% above the preceding 20-session average of 24,769 contracts, although it remained 5,848 contracts, or 15.3%, below the period peak of 38,327 recorded on 3 August.
The latest available open interest, for 25 August, declined to 210,623 contracts from 211,741 on 24 August, a decrease of 1,118 contracts, or 0.5%. Open interest was 19,216 contracts, or 8.4%, below its 27 July level and 19,832 contracts, or 8.6%, below the period peak of 230,455 recorded on 28 July. No figure was reported for 26 August.
The sharp recovery in turnover indicates a meaningful improvement in trading activity after the previous session’s slowdown. However, with same-day open interest unavailable and the latest reading at its lowest level of the period, the volume rebound alone does not yet confirm renewed position-building.
Exchange Trading Volume
| Market | 25 Aug 2026 | 26 Aug 2026 | Change | Change % |
|---|---|---|---|---|
| US | 3,376,634 | 3,375,661 | −973 | −0.03% |
| UK | 1,123,281 | 1,129,688 | +6,407 | +0.57% |
The measure is not a complete regional stock-to-grind ratio, as it includes only exchange-certified cocoa held at U.S. and EU delivery ports and excludes commercial inventories outside the ICE warehouse system. North America NCA grindings cover processors across North America, while ICE U.S. certified stocks are stored at U.S. delivery ports. ECA reports bean usage in European countries and London-certified cocoa is held in European and UK delivery locations.
Readers can explore detailed cocoa market datasets, futures statistics, and historical indicators in the CocoaIntel Data Hub:
 Cocoa Intel
Thursday Outlook Dec Contract
The near-term bias is slightly bullish following the delayed Ivorian crop news. As long as December cocoa holds the $5,750 support, another advance toward $6,000 and the triangle resistance near $6,100 is possible. A confirmed break above $6,100 on strong volume could trigger a larger move toward $6,250–$6,500, while a break below $5,750–$5,700 would shift the outlook bearish and expose $5,500–$5,300. Until either boundary breaks, prices are likely to remain compressed inside the $5,750–$6,100 range.
If you notice any discrepancies in these figures or have extra information, please email hello@cocoaintel.com or leave a comment – corrections and additional insights are always welcome.