Cocoa Slides on Technical Factors as Prices Retreat from Resistance (18 August 2026)


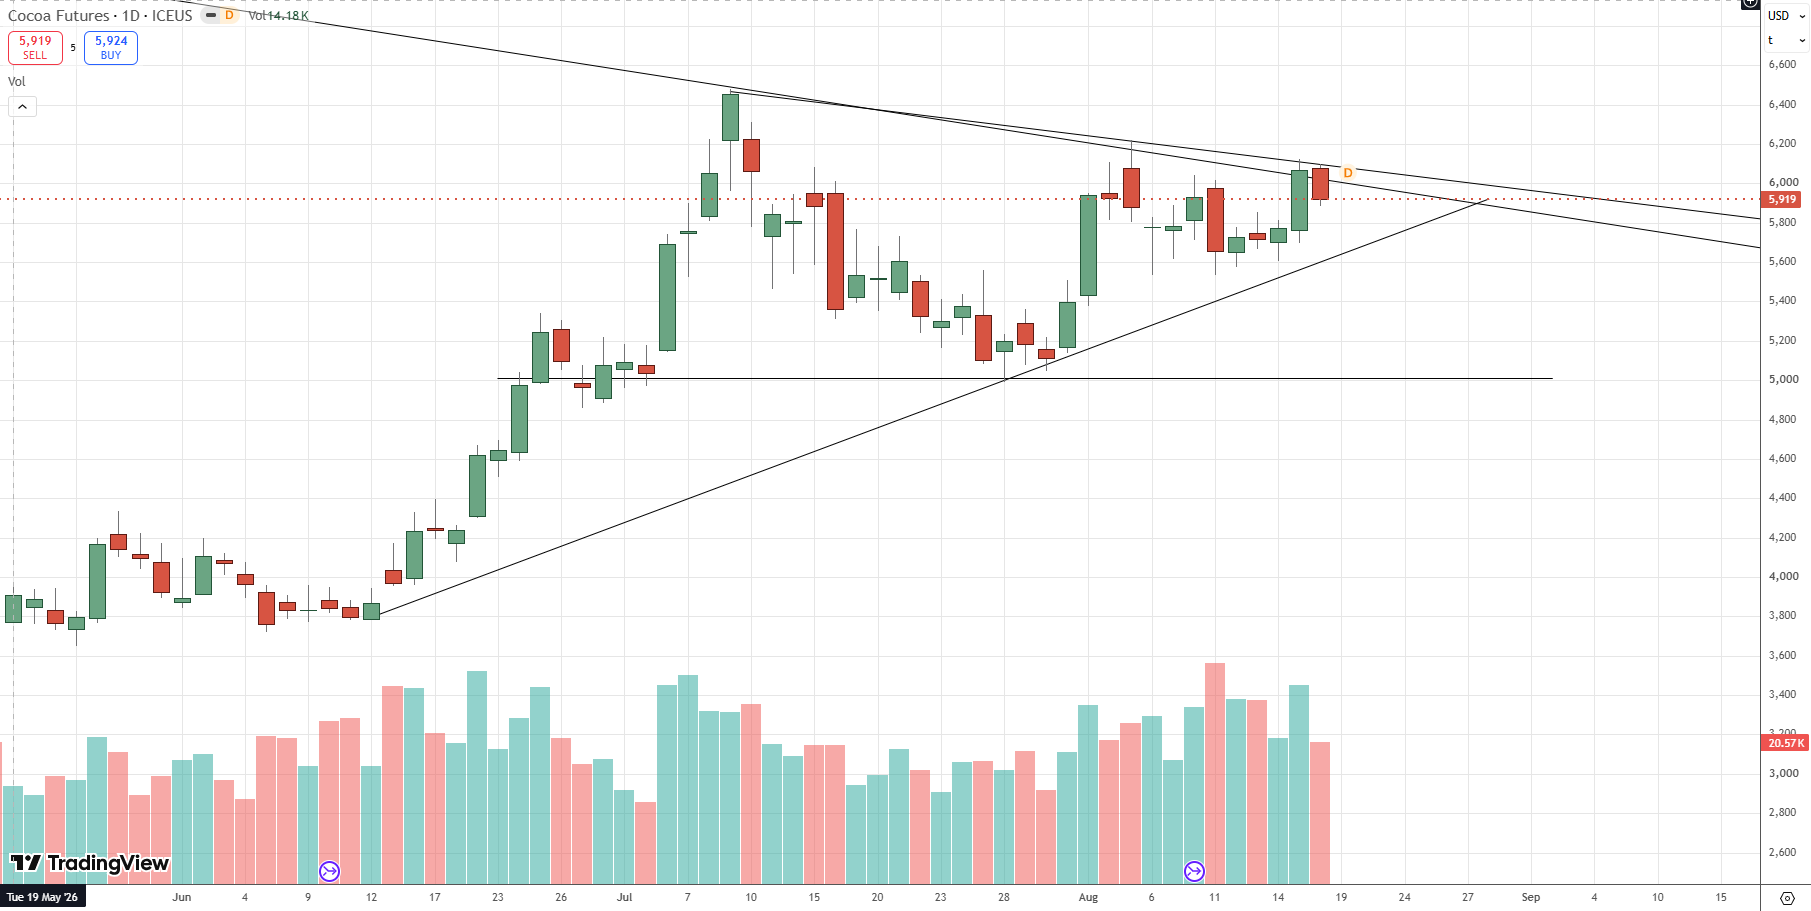
The 18 August decline appeared to be driven primarily by technical factors rather than a new fundamental shock. New York cocoa reversed on Tuesday after failing to extend its advance through the $6,100 to $6,150 resistance area. The Dec-26 contract opened at $6,080 and briefly reached $6,100 before selling pressure drove it below the psychological $6,000 level and down to an intraday low of $5,884. Prices recovered modestly into the close, finishing at $5,924, down $154 per tonne, or 2.53%, from the previous session. Despite the decline, the contract closed just above its 9-day moving average, leaving the broader consolidation structure intact.
West African Weather Remains the Main Fundamental Driver
Weather remained the dominant fundamental theme. Reports of favourable growing conditions in Côte d’Ivoire and Ghana indicated that a combination of rainfall and sunshine had encouraged new flowering ahead of the 2026/27 main-crop harvest.
These conditions improved the immediate crop outlook and added near-term pressure to prices. However, uncertainty remains over whether current flowering will translate into strong pod development and final production, particularly if weather conditions deteriorate later in the crop cycle.
Dealers continue to expect West African cocoa production to decline in 2026/27, but the scale of the reduction remains highly uncertain. Lower output may not be sufficient to eliminate the risk of another global surplus, although the surplus, if it occurs, would likely be materially smaller than in the current 2025/26 season
El Niño Maintains Medium-Term Supply Risk
The medium-term weather outlook remains less comfortable. Reuters reported that US forecasters see a probability above 90% that El Niño will develop into a very strong event during the Northern Hemisphere autumn and winter of 2026/27.
Strong El Niño episodes can create adverse conditions for cocoa production, particularly in West Africa, through excessive rainfall, higher temperatures and subsequent periods of dryness. Dealers therefore continue to anticipate lower regional production in 2026/27, although uncertainty remains over whether the decline will merely reduce the expected global surplus or eliminate it entirely.
Ecuadorian Exports Remain Resilient
Ecuador provided a secondary supply-side development. Total exports of cocoa beans and processed products reached 41,744 tonnes in July, broadly unchanged from June and 2.6% below July 2025.
Cocoa bean exports increased to 37,991 tonnes, while cocoa-product shipments declined to 3,753 tonnes. Cumulative exports during the first ten months of the 2025/26 cocoa year reached 484,708 tonnes, approximately 3.8% above the corresponding period last season.
The figures confirm that South American supply remains strong and continues to partially offset uncertainty in West Africa.
Futures performance
New York cocoa
| Contract | 17 Aug | 18 Aug | Change | Change % |
|---|---|---|---|---|
| Sep-26 | $6,049 | $5,920 | -$129 | -2.13% |
| Dec-26 | $6,078 | $5,924 | -$154 | -2.53% |
| Mar-27 | $6,158 | $5,995 | -$163 | -2.65% |
| May-27 | $6,164 | $5,996 | -$168 | -2.73% |
| Jul-27 | $6,152 | $5,995 | -$157 | -2.55% |
New York cocoa declined on 18 August, with every principal contract closing below the previous session. Sep-26 fell by $129 per tonne, or 2.13%, to $5,920. Dec-26 lost $154 to close at $5,924, while Mar-27 declined by $163 to $5,995. May-27 registered the largest loss among the five principal maturities, falling by $168, or 2.73%, to $5,996. Jul-27 declined by $157 to $5,995.
The sell-off was moderately weighted toward the middle of the curve rather than the nearby contract. Sep-26 recorded the smallest percentage loss, while May-27 experienced the largest. The far-deferred Dec-27 contract was weaker still, falling by $189, or 3.13%, although trading volume in that maturity was limited.
The decline retraced only part of the strong advance recorded on 17 August. All five principal contracts remained above their 14 August closing levels, by between $112 and $180 per tonne.
Liquidity remained heavily concentrated at the front of the curve. Sep-26, Dec-26 and Mar-27 generated 41,720 contracts, representing 89.6% of total volume. Dec-26 was the most actively traded maturity, with 21,990 contracts, equivalent to 47.2% of aggregate volume. Total New York cocoa volume reached 46,557 contracts, down 19.3% from 57,719 contracts on 17 August.
Spread volume amounted to 30,068 contracts, equivalent to 64.6% of total activity. EFP volume reached 4,283 contracts, EFS volume was 1,586 contracts and block volume amounted to 84 contracts.
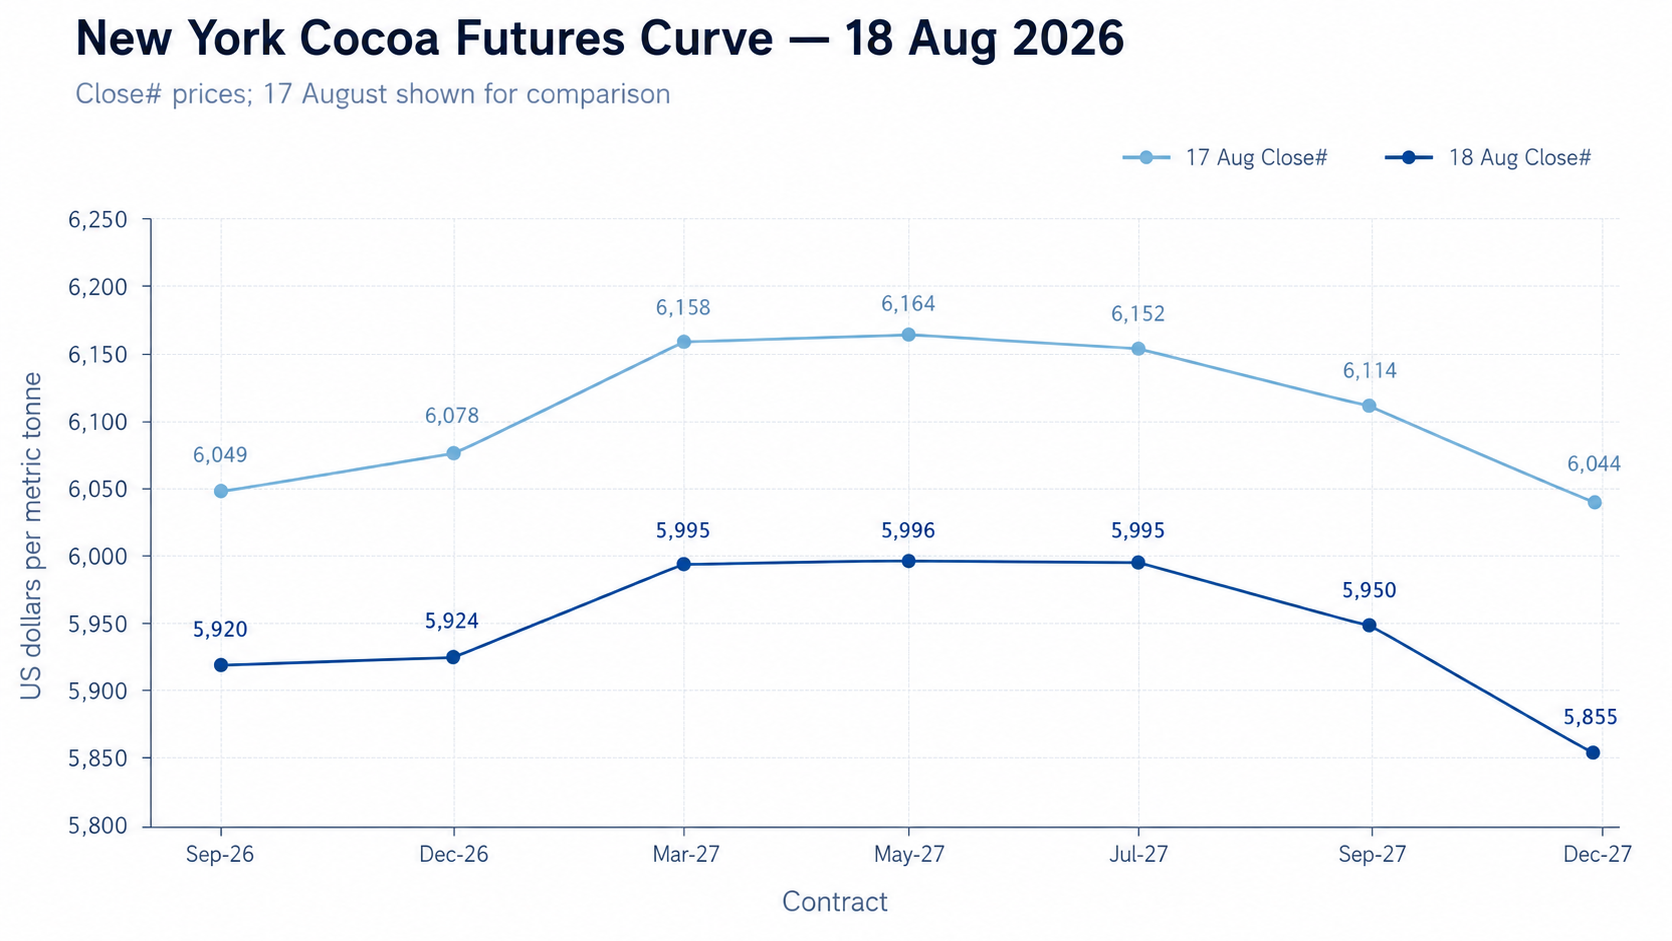
The front of the New York curve flattened significantly. Sep-26-to-Dec-26 contango narrowed from $29 on 17 August to only $4 on 18 August, as the nearby contract outperformed Dec-26 during the decline. Dec-26-to-Mar-27 contango also narrowed, from $80 to $71, while Mar-27-to-May-27 contango contracted from $6 to only $1.
The May-to-July relationship changed materially. May-27-to-Jul-27 backwardation narrowed from $12 to only $1. The curve was therefore almost completely flat between March and July, with Mar-27 and Jul-27 both closing at $5,995 and May-27 only $1 higher at $5,996.
The broader Sep-26-to-Jul-27 contango narrowed from $103 to $75. This confirms that the nearby contract strengthened on a relative basis against the middle of the curve, despite the substantial outright price decline.
The most pronounced structural change occurred between the nearby and far-deferred contracts. Sep-26-to-Dec-27 backwardation widened from only $5 to $65. Dec-27 declined by $189 compared with a $129 fall in Sep-26, producing clear relative weakness at the back of the curve.
Beyond July, the curve also became more inverted. Jul-27-to-Sep-27 backwardation widened from $38 to $45, while Sep-27-to-Dec-27 backwardation increased from $70 to $95. The overall result was a flatter front and middle section combined with a materially more inverted deferred tail.
London cocoa
| Contract | 17 Aug | 18 Aug | Change | Change % |
|---|---|---|---|---|
| Sep-26 | £4,298 | £4,227 | -£71 | -1.65% |
| Dec-26 | £4,360 | £4,274 | -£86 | -1.97% |
| Mar-27 | £4,484 | £4,398 | -£86 | -1.92% |
| May-27 | £4,492 | £4,407 | -£85 | -1.89% |
| Jul-27 | £4,481 | £4,400 | -£81 | -1.81% |
London cocoa also declined across the curve on 18 August, although percentage losses were smaller than in New York. Sep-26 fell by £71 per tonne, or 1.65%, to £4,227. Dec-26 and Mar-27 each declined by £86, closing at £4,274 and £4,398 respectively. May-27 lost £85 to close at £4,407, while Jul-27 declined by £81 to £4,400.
The losses were relatively evenly distributed across the five principal maturities. Sep-26 showed the greatest relative resilience, while Dec-26 recorded the largest percentage decline at 1.97%. Further along the curve, Sep-27 and Dec-27 fell by 2.23% and 2.22% respectively, indicating somewhat greater pressure in the deferred contracts.
As in New York, the decline did not erase the previous session’s rally. The five principal London contracts remained between £94 and £112 above their 14 August closing levels.
Trading activity was distributed more broadly across maturities than in New York. Sep-26, Dec-26 and Mar-27 generated 10,892 contracts, representing 62.1% of total volume. The first five maturities together accounted for 14,822 contracts, or 84.5% of activity. Dec-26 was the most active contract, with volume of 5,534 contracts, equivalent to 31.6% of the total.
Aggregate London cocoa volume reached 17,540 contracts, down 31.7% from 25,690 contracts on 17 August. Spread volume amounted to 12,186 contracts, representing 69.5% of total activity. EFP volume was 505 contracts, while no EFS or block volume was reported.
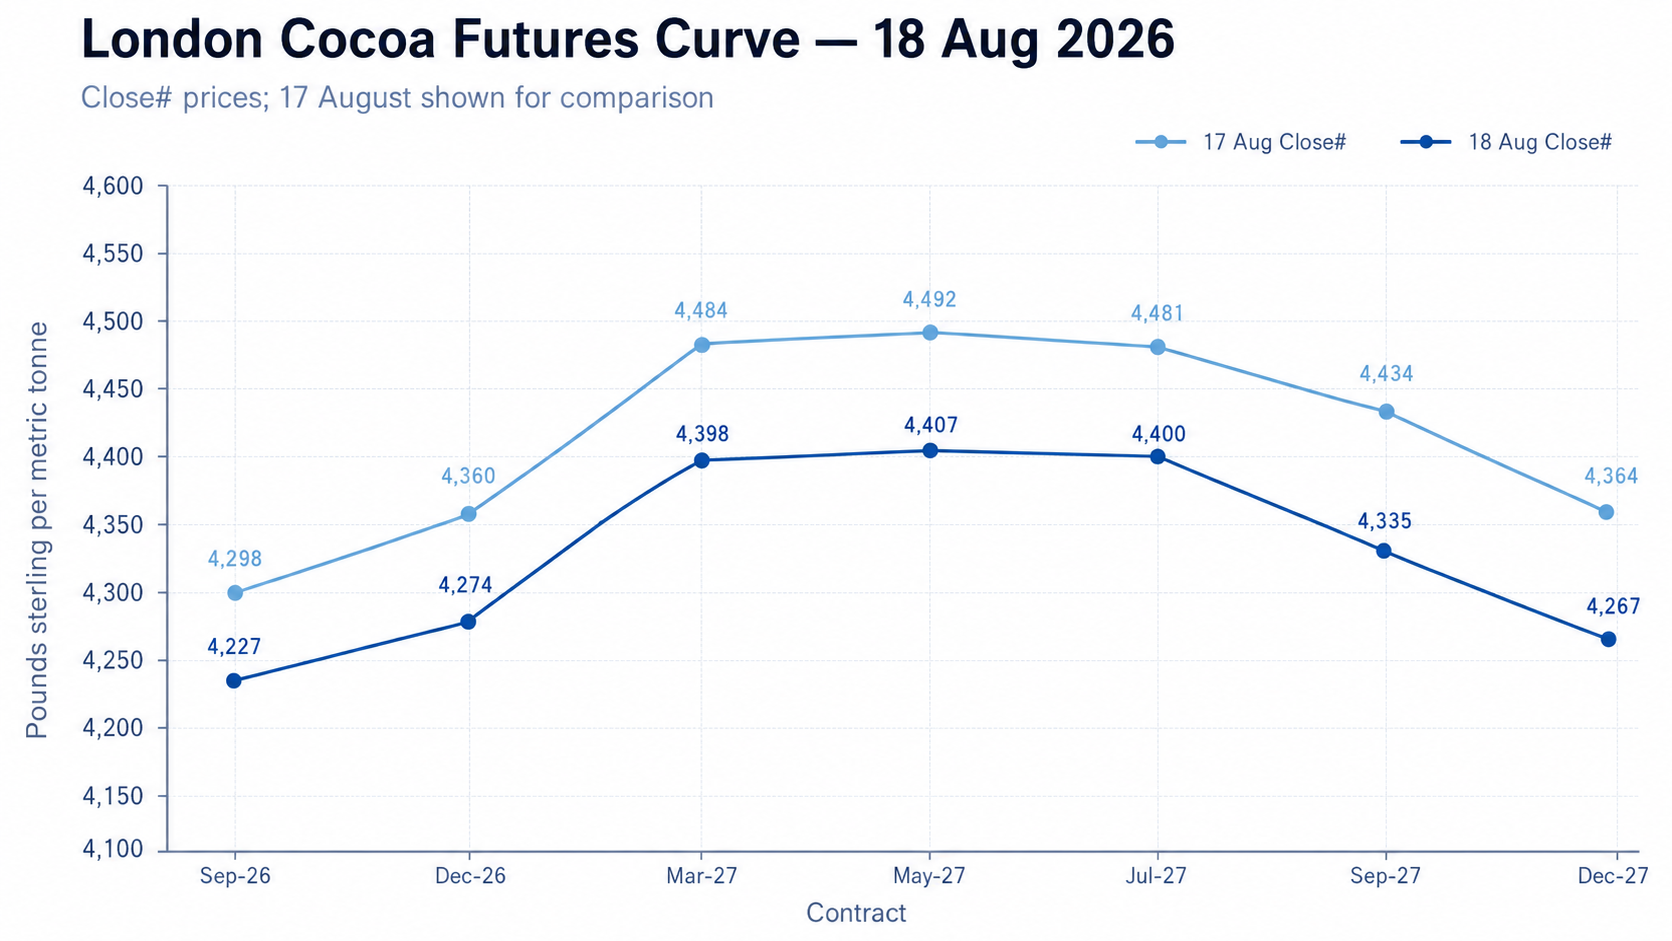
The London front curve also flattened. Sep-26-to-Dec-26 contango narrowed from £62 on 17 August to £47 on 18 August, reflecting the relative outperformance of the nearby contract.
The Dec-26-to-Mar-27 contango remained unchanged at £124 because both contracts declined by exactly £86. This remained the largest upward step in the active part of the London curve. Mar-27-to-May-27 contango widened marginally from £8 to £9.
The May-to-July inversion moderated. May-27-to-Jul-27 backwardation narrowed from £11 to £7, as Jul-27 declined slightly less than May-27. The curve nevertheless retained its highest point at May-27, which closed at £4,407.
The broader Sep-26-to-Jul-27 contango narrowed from £183 to £173. The Sep-26-to-Dec-27 structure also compressed materially, with contango narrowing from £66 to £40. London therefore remained in contango between the nearby and December 2027 contracts, but the positive carry was considerably smaller than one session earlier.
Beyond July, Jul-27-to-Sep-27 backwardation widened from £47 to £65, reflecting the comparatively large £99 decline in Sep-27. In contrast, Sep-27-to-Dec-27 backwardation narrowed marginally from £70 to £68 because Dec-27 slightly outperformed Sep-27.
The London curve consequently retained its pronounced rise from the nearby contracts into March and May 2027, followed by an increasingly inverted structure beyond July. The relative weakness in the deferred section was concentrated primarily in Sep-27.
US–UK Spread
(Dec Contract)
$5,924 − (£4,274 x 1.353$/£) =$141ton (down from $174 ton)
Volume and Open Interest
New York cocoa
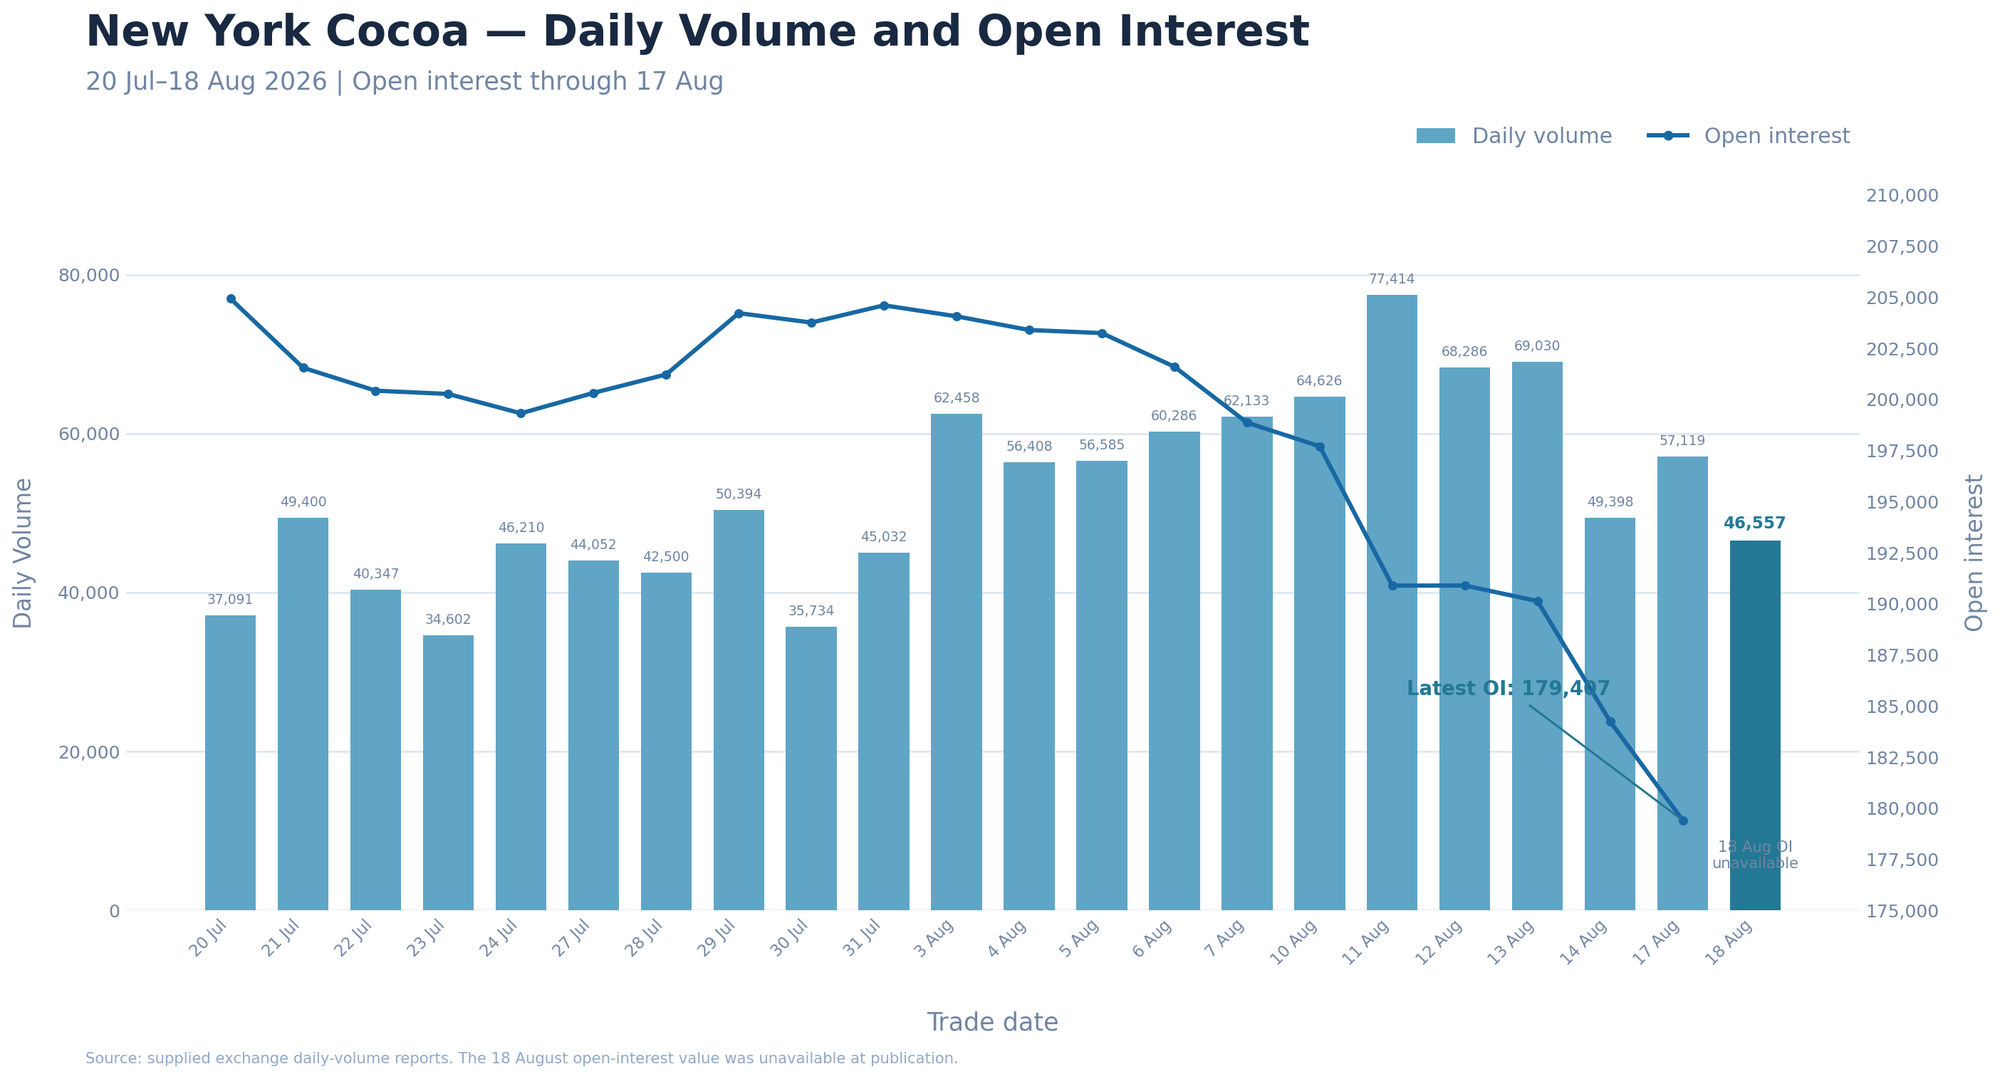
New York cocoa volume fell to 46,557 contracts on 18 August, a decrease of 10,562 contracts, or 18.5%, from 57,119 contracts on 17 August.
Activity was 13.1% below the preceding 20-session average of 53,601 contracts. This indicates that participation weakened during the price reversal and returned below its recent normal level. Volume was also 30,857 contracts, or 39.9%, below the recent peak of 77,414 contracts recorded on 11 August.
The latest available open interest was 179,407 contracts on 17 August, down 4,839 contracts, or 2.6%, from 184,246 contracts on 14 August. The contraction was substantial and extended the sharp reduction in outstanding positions visible during the second half of the period.
Since 20 July, New York open interest has fallen by 25,527 contracts, or 12.5%, from 204,934. The decline became particularly concentrated during the latest part of the period. Between 10 and 17 August alone, open interest dropped by 18,301 contracts, or 9.3%.
The combination of the strong price rally on 17 August and a 4,839-contract decline in open interest strengthens the interpretation that short covering and broader position reduction were important components of the advance. It provides less support for the view that the rally was primarily driven by extensive new long accumulation. Contract-roll activity may also have contributed to the reduction and should not be excluded.
Prices reversed lower on 18 August, but the decline occurred on below-average volume and materially less activity than the preceding rally. This suggests that the sell-off attracted less overall participation than the 17 August move. It does not, however, establish whether the decline was driven by long liquidation or the establishment of new short positions.
London cocoa
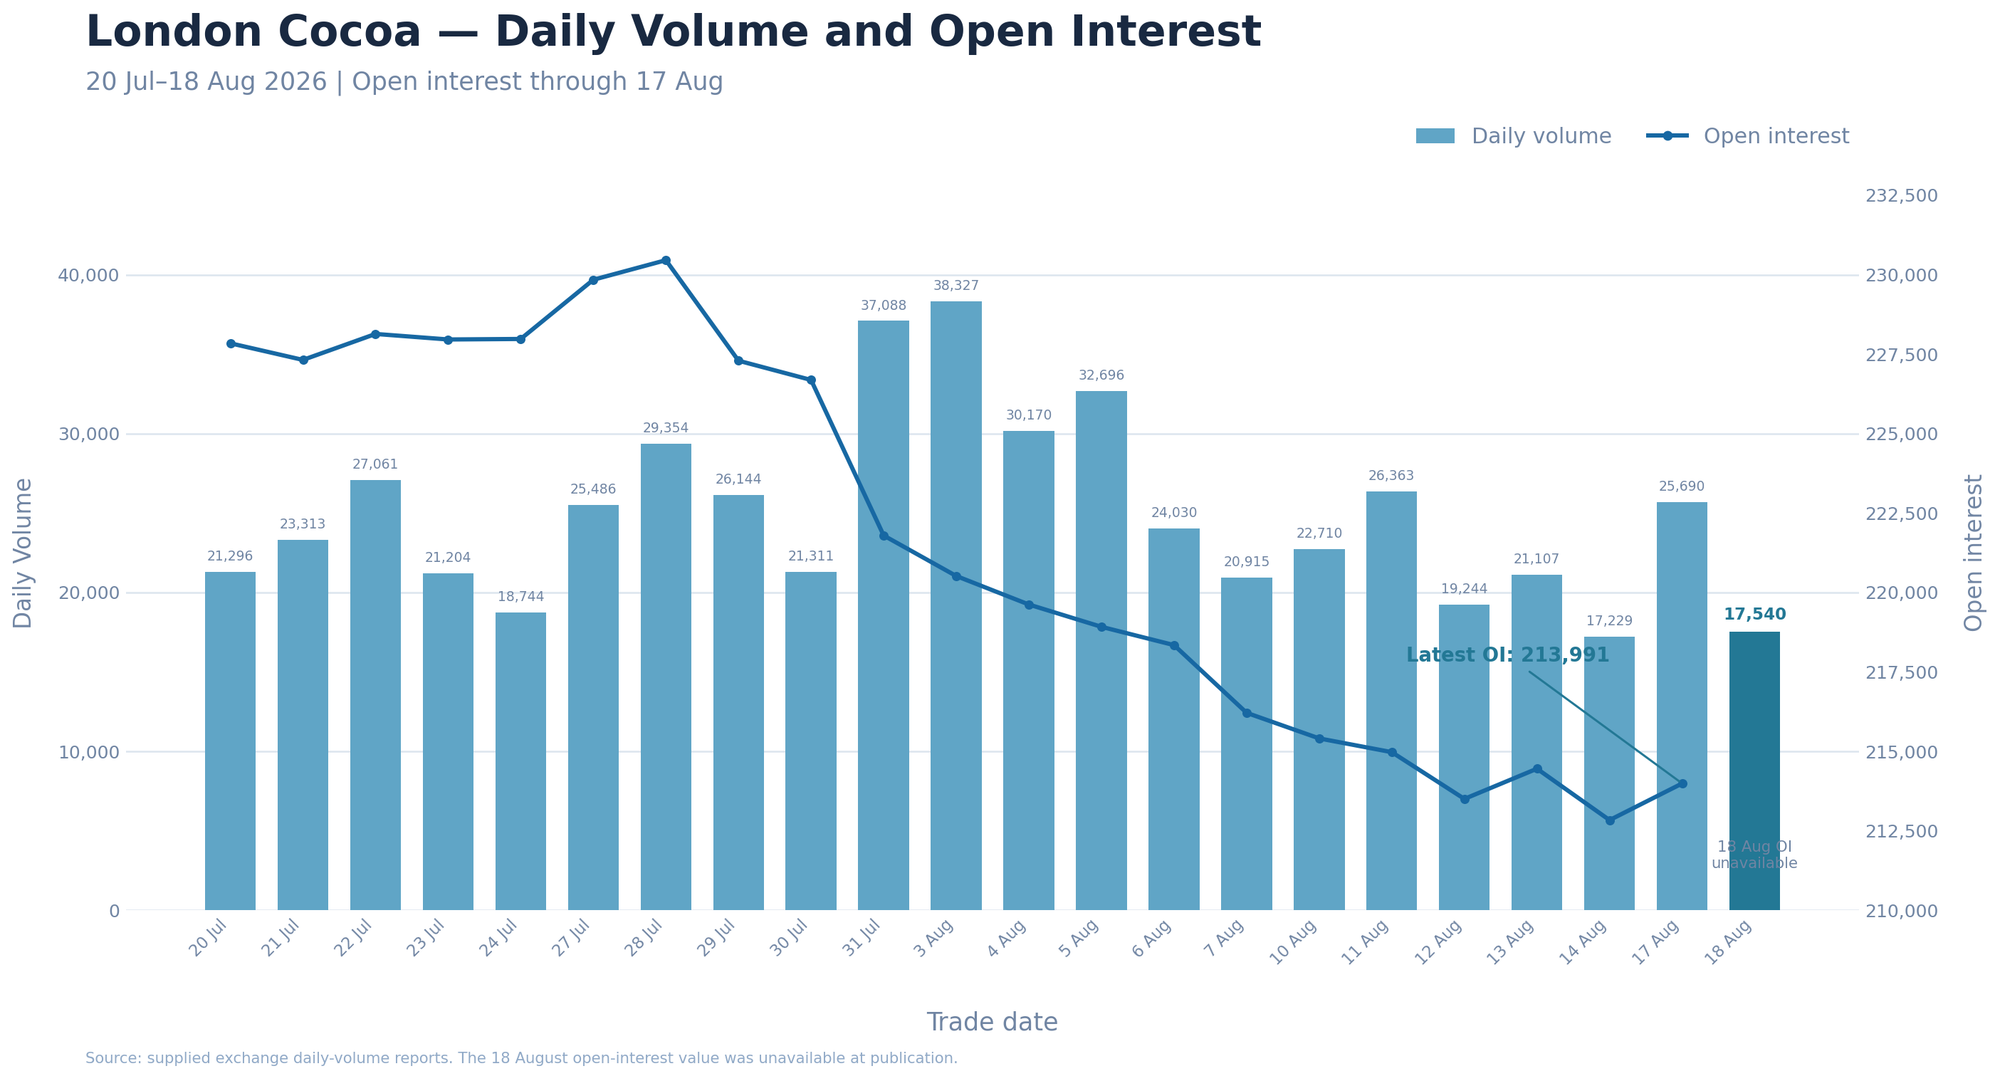
London cocoa volume declined to 17,540 contracts on 18 August, a decrease of 8,150 contracts, or 31.7%, from 25,690 contracts on 17 August.
Activity was 31.0% below the preceding 20-session average of 25,409 contracts. The 18 August total was the second-lowest daily volume in the displayed period, exceeding only the 17,229 contracts recorded on 14 August.
Volume was also 20,787 contracts, or 54.2%, below the period high of 38,327 contracts reached on 3 August. The substantial fall in turnover indicates that the 18 August price decline occurred without the broad participation seen during the more active sessions at the beginning of August.
The latest available London open interest was 213,991 contracts on 17 August, up 1,153 contracts, or 0.5%, from 212,838 contracts on 14 August. This modest increase interrupted the preceding contraction and represented a partial rebuilding of outstanding positions following the recent low.
Despite the latest increase, London open interest remained in a broader downward trend. Since 20 July, it has declined by 13,849 contracts, or 6.1%, from 227,840. Relative to the period high of 230,455 contracts on 28 July, open interest was lower by 16,464 contracts, or 7.1%.
The combination of rising prices and rising open interest on 17 August differs from the corresponding pattern in New York. It is consistent with new position creation and stronger directional participation rather than a rally driven predominantly by the closure of existing positions. Open interest alone cannot identify whether the newly established positions were initiated by buyers or sellers, but the simultaneous price increase indicates that buyers had the greater immediate influence.
London prices declined on 18 August, but volume fell to an unusually low level. This weakens the evidence that the reversal represented broad or aggressive bearish positioning.
Exchange Trading Volume
| MARKET | 17 AUG 2026 | 18 AUG 2026 | CHANGE | CHANGE % |
|---|---|---|---|---|
| US | 3,339,996 | 3,349,919 | +9,923 | +0.30% |
| UK | 1,146,719 | 1,146,719 | 0 | 0.00% |
The measure is not a complete regional stock-to-grind ratio, as it includes only exchange-certified cocoa held at U.S. and EU delivery ports and excludes commercial inventories outside the ICE warehouse system. North America NCA grindings cover processors across North America, while ICE U.S. certified stocks are stored at U.S. delivery ports. ECA reports bean usage in European countries and London-certified cocoa is held in European and UK delivery locations.
Readers can explore detailed cocoa market datasets, futures statistics, and historical indicators in the CocoaIntel Data Hub:
 Cocoa Intel
Wednesday Outlook Dec Contract
Wednesday is likely to remain volatile but range-bound, with a mild bearish bias while Dec-26 trades below $6,000. Initial support lies at $5,900 to $5,850. Because Tuesday’s close remained just above the 9-day SMA, buyers may defend this area and attempt a recovery toward $6,000, followed by $6,150.
A volume-supported break and close above $6,150 would confirm the bullish triangle breakout, initially targeting $6,300 to $6,600. The $8,000 area would remain a longer-term objective rather than an immediate target.
Failure to hold $5,850 would bring the key $5,700 support and 21-day SMA into focus. A decisive close below $5,700 would invalidate the immediate bullish setup and expose $5,000 support area.