Cocoa Swings Sharply but Remains Trapped in Consolidation (19 August 2026)


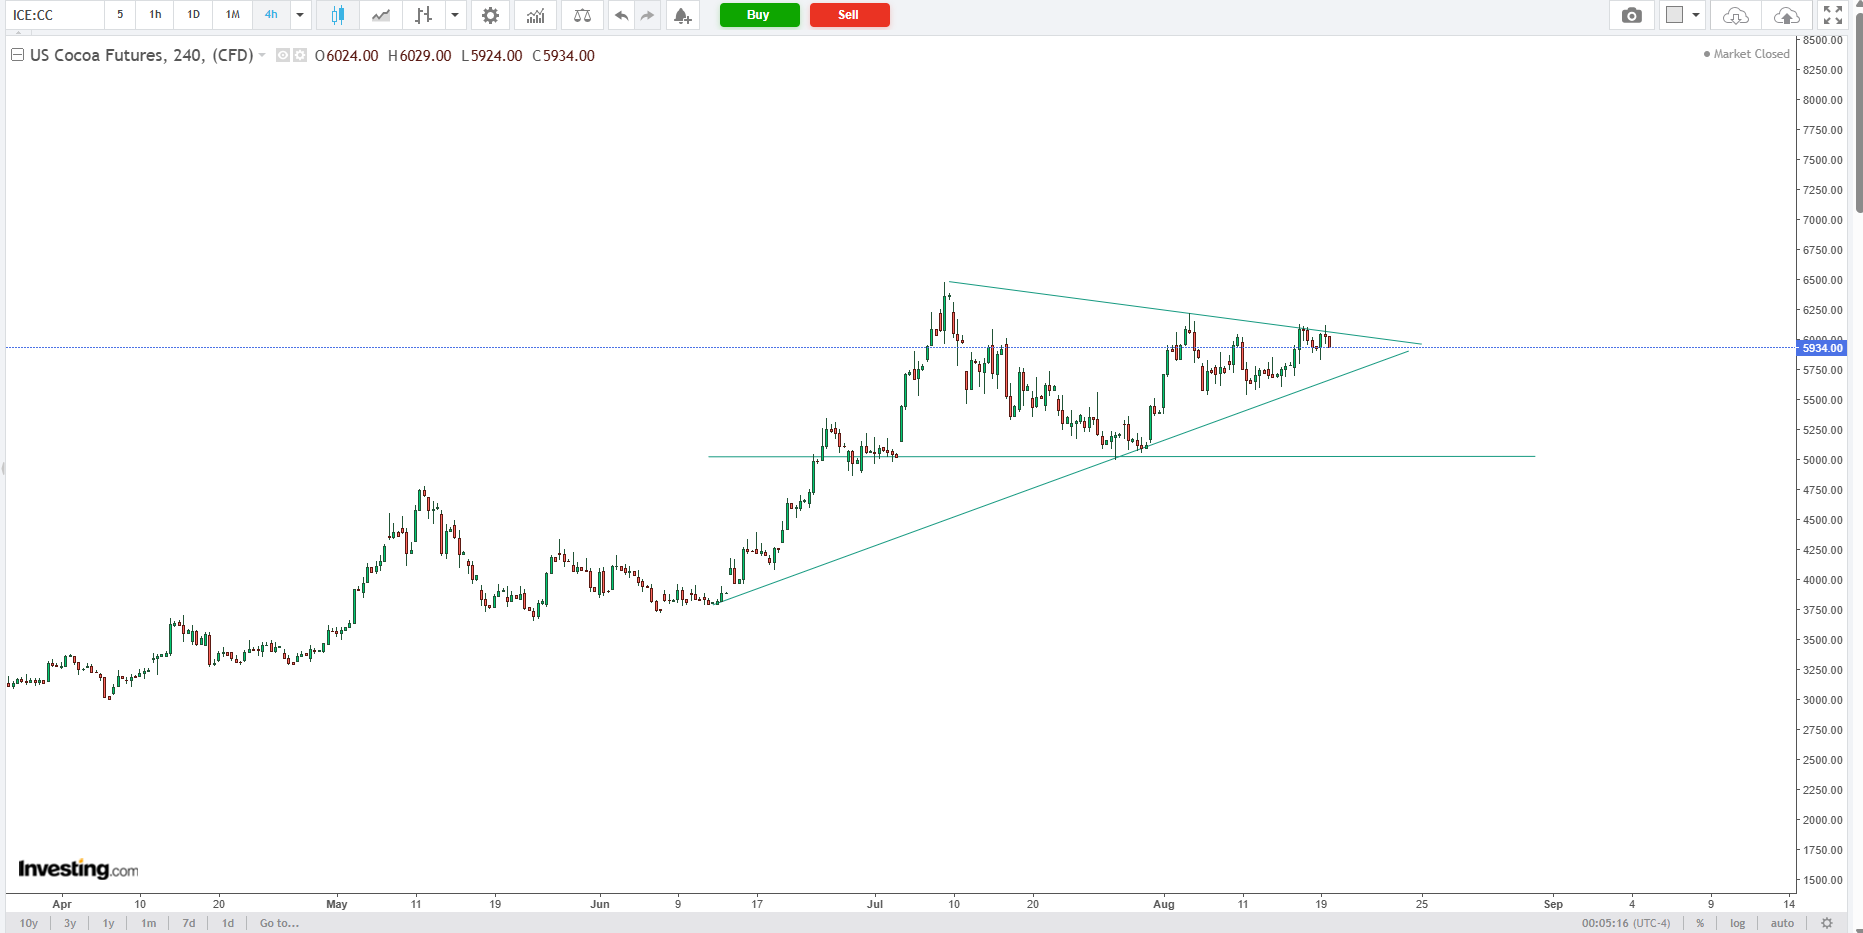
New York cocoa experienced another volatile session on 19 August. Dec-26 initially traded lower before rallying sharply to an intraday high of $6,119 per tonne, nearly 5.0% above the session low of $5,829. The move above $6,100 failed to hold, however, and prices reversed during the second half of the session. The contract eventually closed at $5,934, up only $10, or 0.17%, from the previous day. The wide $290 intraday range contrasted with the limited close-to-close change, highlighting continued uncertainty and strong two-way trading around the current consolidation structure.
Ghana light-crop purchasing period nears close
Ghana is approaching the end of its 2026 light-crop purchasing period. COCOBOD has given Licensed Buying Companies until 27 August to submit final returns for declared light-crop purchases. The producer price remains unchanged at GH¢1,241 per 30 kg load, despite lower international cocoa prices. The announcement is primarily administrative rather than a new supply signal, but the completion of the light-crop cycle will shift market attention toward final purchase volumes and the development of Ghana’s upcoming 2026/27 main crop.
Aftermarket news
Hedgepoint Global Markets expects the global cocoa surplus to narrow sharply to 111,000 tonnes in 2026/27, from 325,000 tonnes in 2025/26. The forecast assumes a 2% decline in global production alongside approximately 2.5% growth in cocoa processing. Although the market would remain in surplus, the significantly smaller buffer points to a tighter 2026/27 balance and leaves the market increasingly sensitive to weather and production risks.
Weather
Rainfall is expected to remain widespread across the main West African cocoa belt through the end of the week, with Côte d’Ivoire and Ghana both receiving regular precipitation. Most producing areas are likely to see moderate accumulations, while locally heavier pockets could receive around 40–50 mm by Sunday in Ghana. The wetter pattern should continue to support soil moisture and pod development, although persistently heavy rainfall in isolated areas may increase disease pressure and complicate fieldwork and drying conditions.
Futures performance
New York cocoa
| CONTRACT | 18 AUG | 19 AUG | CHANGE | CHANGE % |
|---|---|---|---|---|
| Sep-26 | $5,920 | $5,938 | +$18 | +0.30% |
| Dec-26 | $5,924 | $5,934 | +$10 | +0.17% |
| Mar-27 | $5,995 | $6,006 | +$11 | +0.18% |
| May-27 | $5,996 | $6,008 | +$12 | +0.20% |
| Jul-27 | $5,995 | $5,984 | -$11 | -0.18% |
New York cocoa finished mixed and close to unchanged on 19 August. Four of the five principal contracts recorded modest gains, while Jul-27 ended below the previous session.
The relatively small close-to-close changes concealed a highly volatile session. The five principal contracts traded through daily ranges of between $278 and $290 per tonne. Despite reaching substantially higher intraday levels, their final recorded trades finished only approximately 32.5% to 37.6% above the respective session lows.
Liquidity remained heavily concentrated in the front of the curve. Sep-26, Dec-26 and Mar-27 generated 41,248 contracts, representing 89.5% of total volume. Dec-26 remained the dominant maturity, with 23,179 contracts traded, equivalent to 50.3% of all New York cocoa activity.
Spread volume increased to 33,029 contracts from 30,068 contracts on 18 August, a rise of 2,961 contracts, or 9.8%. Spread transactions represented 71.7% of total volume, compared with 64.6% in the previous session.
The increase in spread activity occurred despite the slight decline in aggregate volume, indicating that a larger proportion of participation was directed toward calendar positioning and relative-value transactions rather than outright futures exposure.
EFP volume declined sharply to 1,051 contracts from 4,283 contracts on 18 August, a fall of 75.5%. EFS volume decreased from 1,586 to 276 contracts, while no block volume was recorded.
New York futures curve
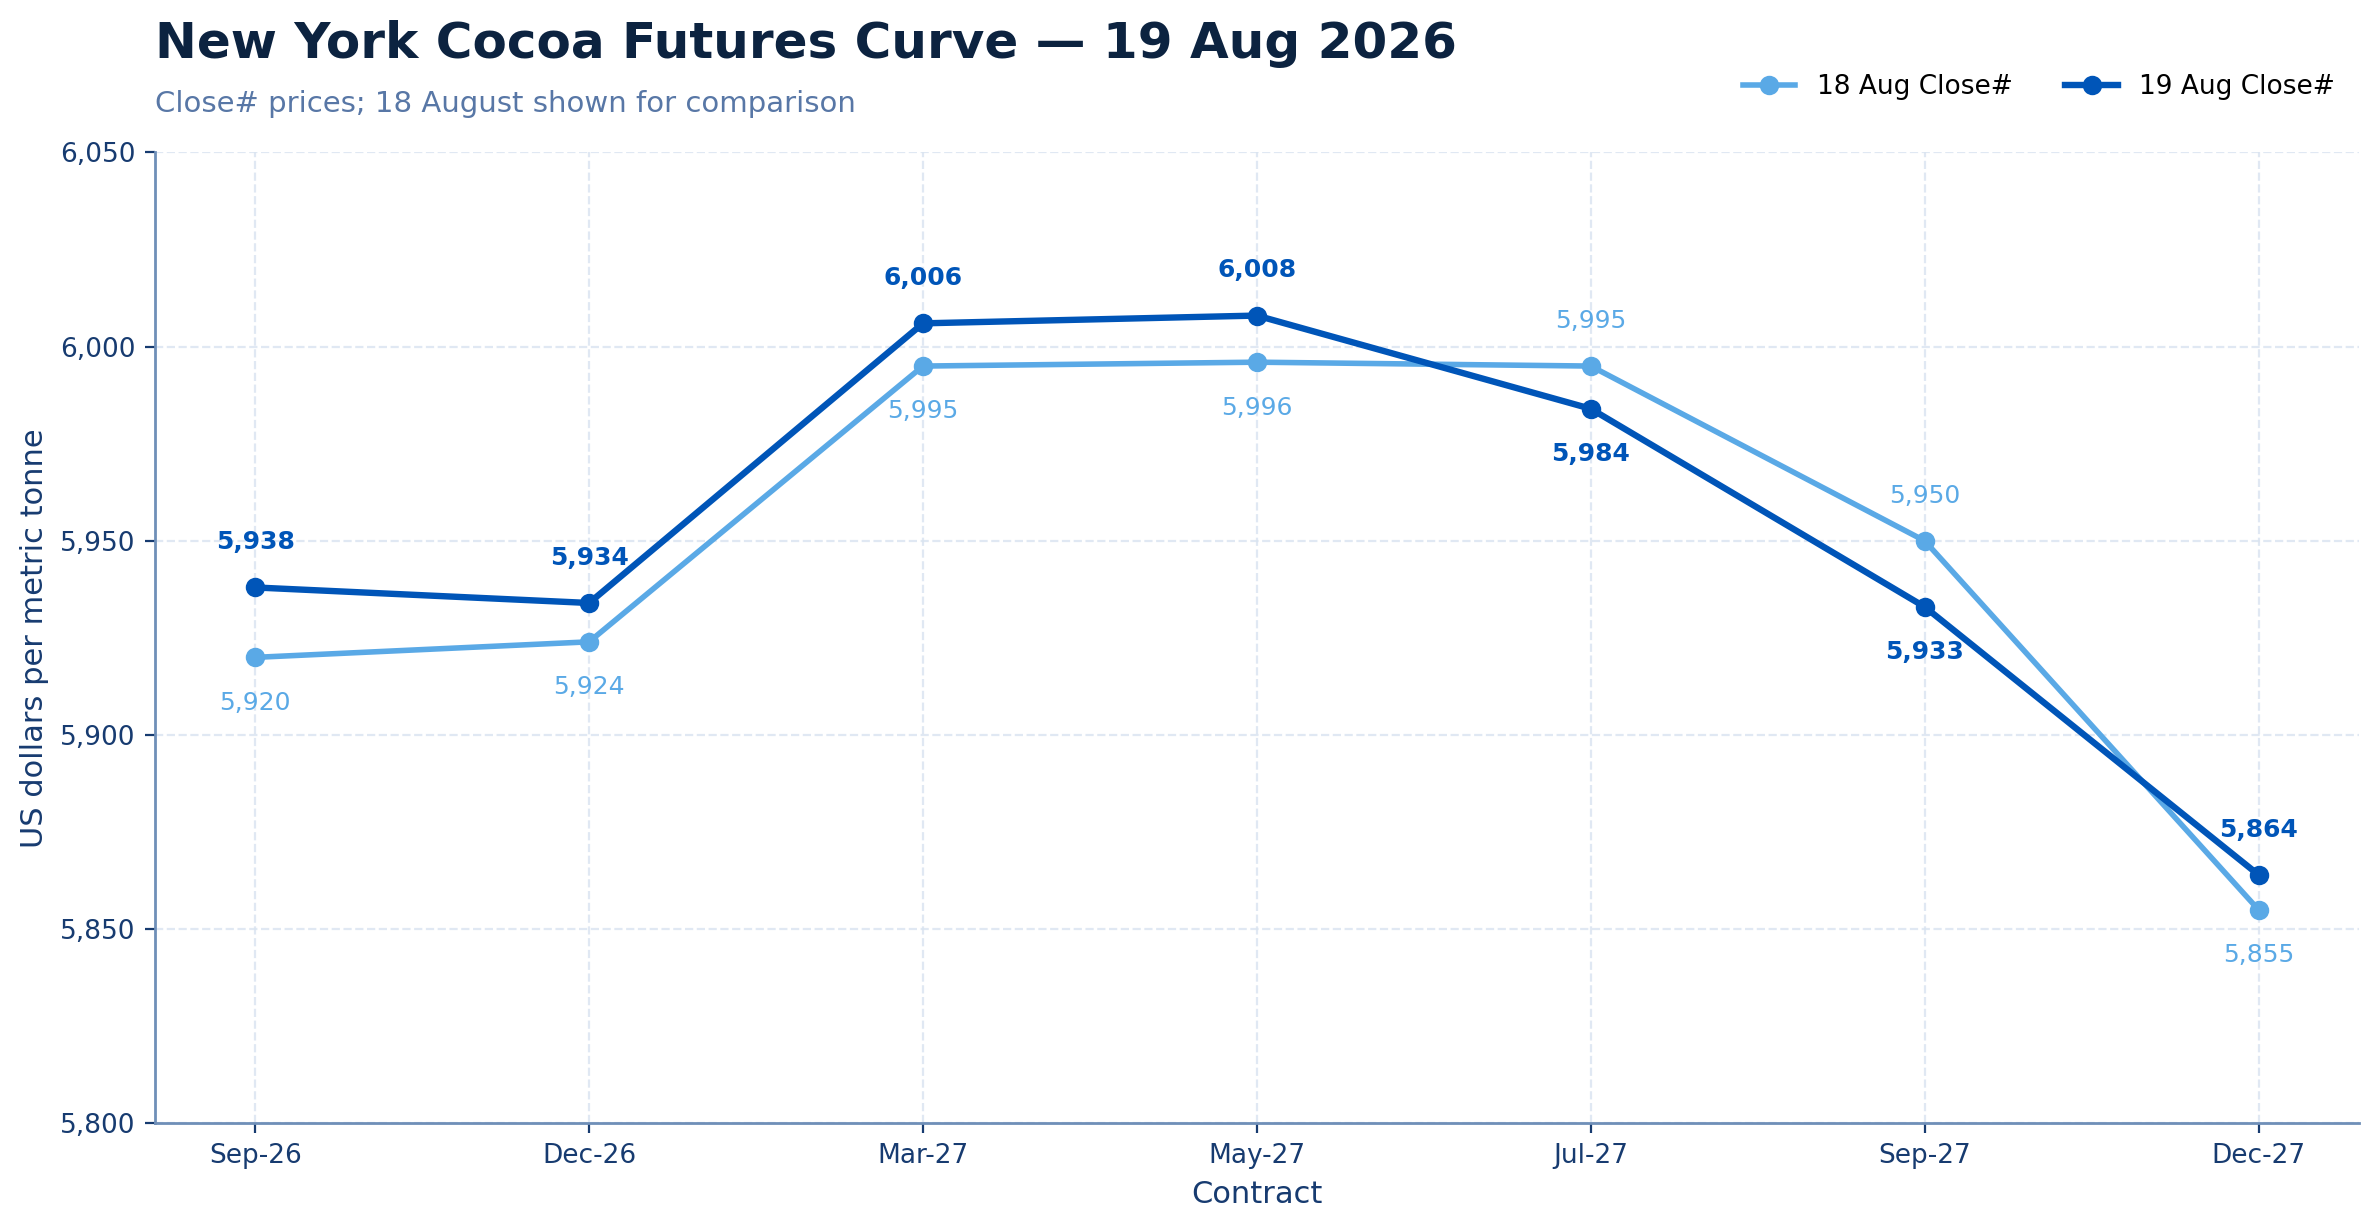
The front of the New York curve tightened further on 19 August. Sep-26-to-Dec-26 moved from a $4 contango on 18 August to a $4 backwardation on 19 August. The relative shift was therefore $8 per tonne in favour of the nearby Sep-26 contract.
The next two spreads changed only marginally. Dec-26-to-Mar-27 contango widened from $71 to $72, while Mar-27-to-May-27 contango increased from $1 to $2. The curve consequently remained almost flat between March and May, with May-27 only $2 above Mar-27.
The most pronounced structural adjustment occurred between May and July. May-27-to-Jul-27 backwardation widened from only $1 on 18 August to $24 on 19 August. May-27 increased by $12 while Jul-27 declined by $11, producing a $23 relative movement between the two contracts.
The broader Sep-26-to-Jul-27 contango narrowed from $75 to $46. This represents a $29 contraction and confirms that the nearby contract strengthened materially relative to Jul-27.
Beyond July, Jul-27-to-Sep-27 backwardation widened from $45 to $51 as Sep-27 underperformed. In contrast, Sep-27-to-Dec-27 backwardation narrowed substantially from $95 to $69 because Dec-27 gained $9 while Sep-27 fell by $17.
The Sep-26-to-Dec-27 structure remained inverted, with backwardation widening from $65 to $74. May-27 remained the highest-priced displayed maturity at $6,008, followed closely by Mar-27 at $6,006.
London cocoa
| CONTRACT | 18 AUG | 19 AUG | CHANGE | CHANGE % |
| Sep-26 | £4,227 | £4,276 | +£49 | +1.16% |
| Dec-26 | £4,274 | £4,322 | +£48 | +1.12% |
| Mar-27 | £4,398 | £4,439 | +£41 | +0.93% |
| May-27 | £4,407 | £4,443 | +£36 | +0.82% |
| Jul-27 | £4,400 | £4,436 | +£36 | +0.82% |
London cocoa recorded a broad close-to-close advance on 19 August.
The rally was moderately weighted toward Sep-26 and Dec-26. However, the strongest gains across the full displayed curve were recorded in the deferred section. Sep-27 rose by £55, or 1.27%, to £4,390, while Dec-27 gained £57, or 1.34%, to £4,324.
Unlike New York, London retained a considerably larger proportion of its intraday advance. The final recorded trades in the first five maturities finished approximately 68.4% to 70.1% above their respective daily lows.
Sep-26 reached a daily high of £4,332 before recording a close of £4,276, while Dec-26 traded as high as £4,381 and finished at £4,322. The relatively consistent range positions across the principal contracts indicate broad and comparatively orderly buying support.
Total London cocoa volume increased to 20,416 contracts, up 2,876 contracts, or 16.4%, from 17,540 contracts on 18 August.
Sep-26, Dec-26 and Mar-27 generated 15,511 contracts, representing 76.0% of total activity. Dec-26 remained the most actively traded maturity, with volume of 8,682 contracts, equivalent to 42.5% of the aggregate total.
The first five maturities through Jul-27 accounted for 18,921 contracts, or 92.7% of total London cocoa volume. Trading activity was therefore more broadly distributed across maturities than in New York, where the first five contracts represented 98.2% of volume.
Spread volume increased by 647 contracts, or 5.3%, to 12,833. However, because total volume expanded more rapidly, spread activity declined as a proportion of overall turnover, from 69.5% on 18 August to 62.9% on 19 August.
EFP activity increased sharply to 1,701 contracts from 505 contracts in the previous session, a rise of 1,196 contracts, or 236.8%. The activity was heavily concentrated in Dec-26, which recorded 1,592 EFP contracts and represented 93.6% of the London EFP total. No EFS or block volume was reported.
London futures curve
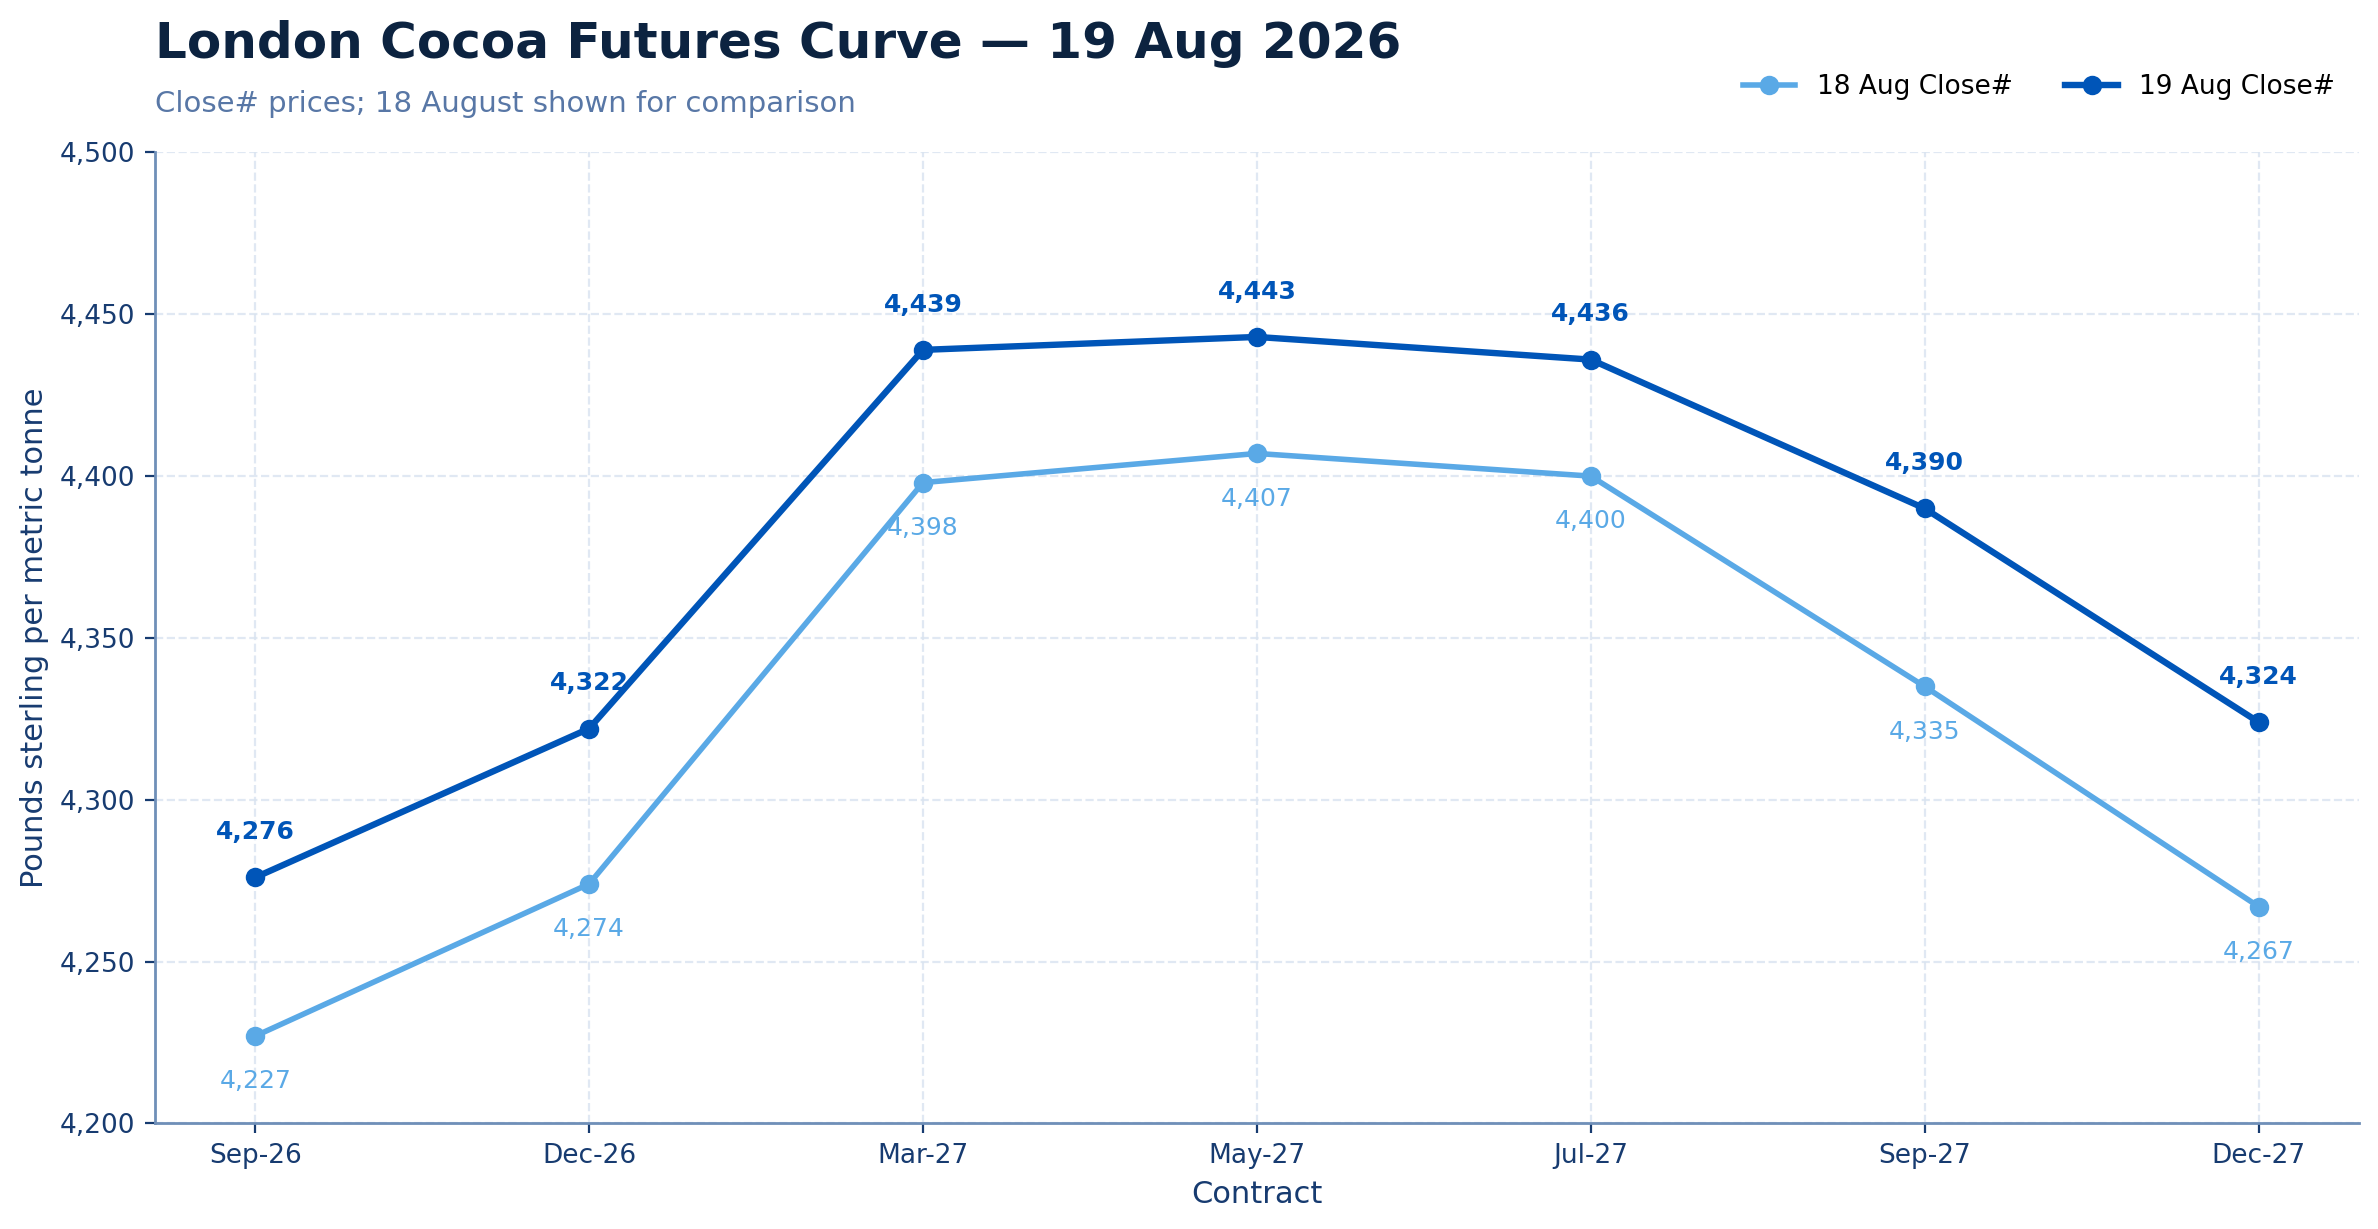
The London front curve flattened modestly. Sep-26-to-Dec-26 contango narrowed from £47 on 18 August to £46 on 19 August as Sep-26 slightly outperformed Dec-26.
Dec-26-to-Mar-27 contango contracted more materially, from £124 to £117. Mar-27-to-May-27 contango also narrowed, from £9 to only £4. The upward slope between December and May therefore became less pronounced.
May-27 remained the highest-priced contract at £4,443. May-27-to-Jul-27 backwardation was unchanged at £7 because both contracts gained £36.
The deferred inversion became less pronounced. Jul-27-to-Sep-27 backwardation narrowed from £65 to £46 as Sep-27 outperformed Jul-27 by £19. Sep-27-to-Dec-27 backwardation also narrowed slightly, from £68 to £66.
The broader Sep-26-to-Jul-27 contango contracted from £173 to £160. However, Sep-26-to-Dec-27 contango widened from £40 to £48 because Dec-27 registered a larger daily gain than the nearby contract.
London therefore retained its established curve profile, rising sharply from Sep-26 into the March-to-May 2027 area before moving into backwardation beyond May. The principal structural changes were a flatter front and middle section, combined with a materially less inverted Jul-27-to-Sep-27 relationship.
US–UK Spread
(Dec Contract)
$5,934 − (£4,322 x 1.360$/£) =$56ton (down from $141 ton)
Volume and Open Interest
New York cocoa
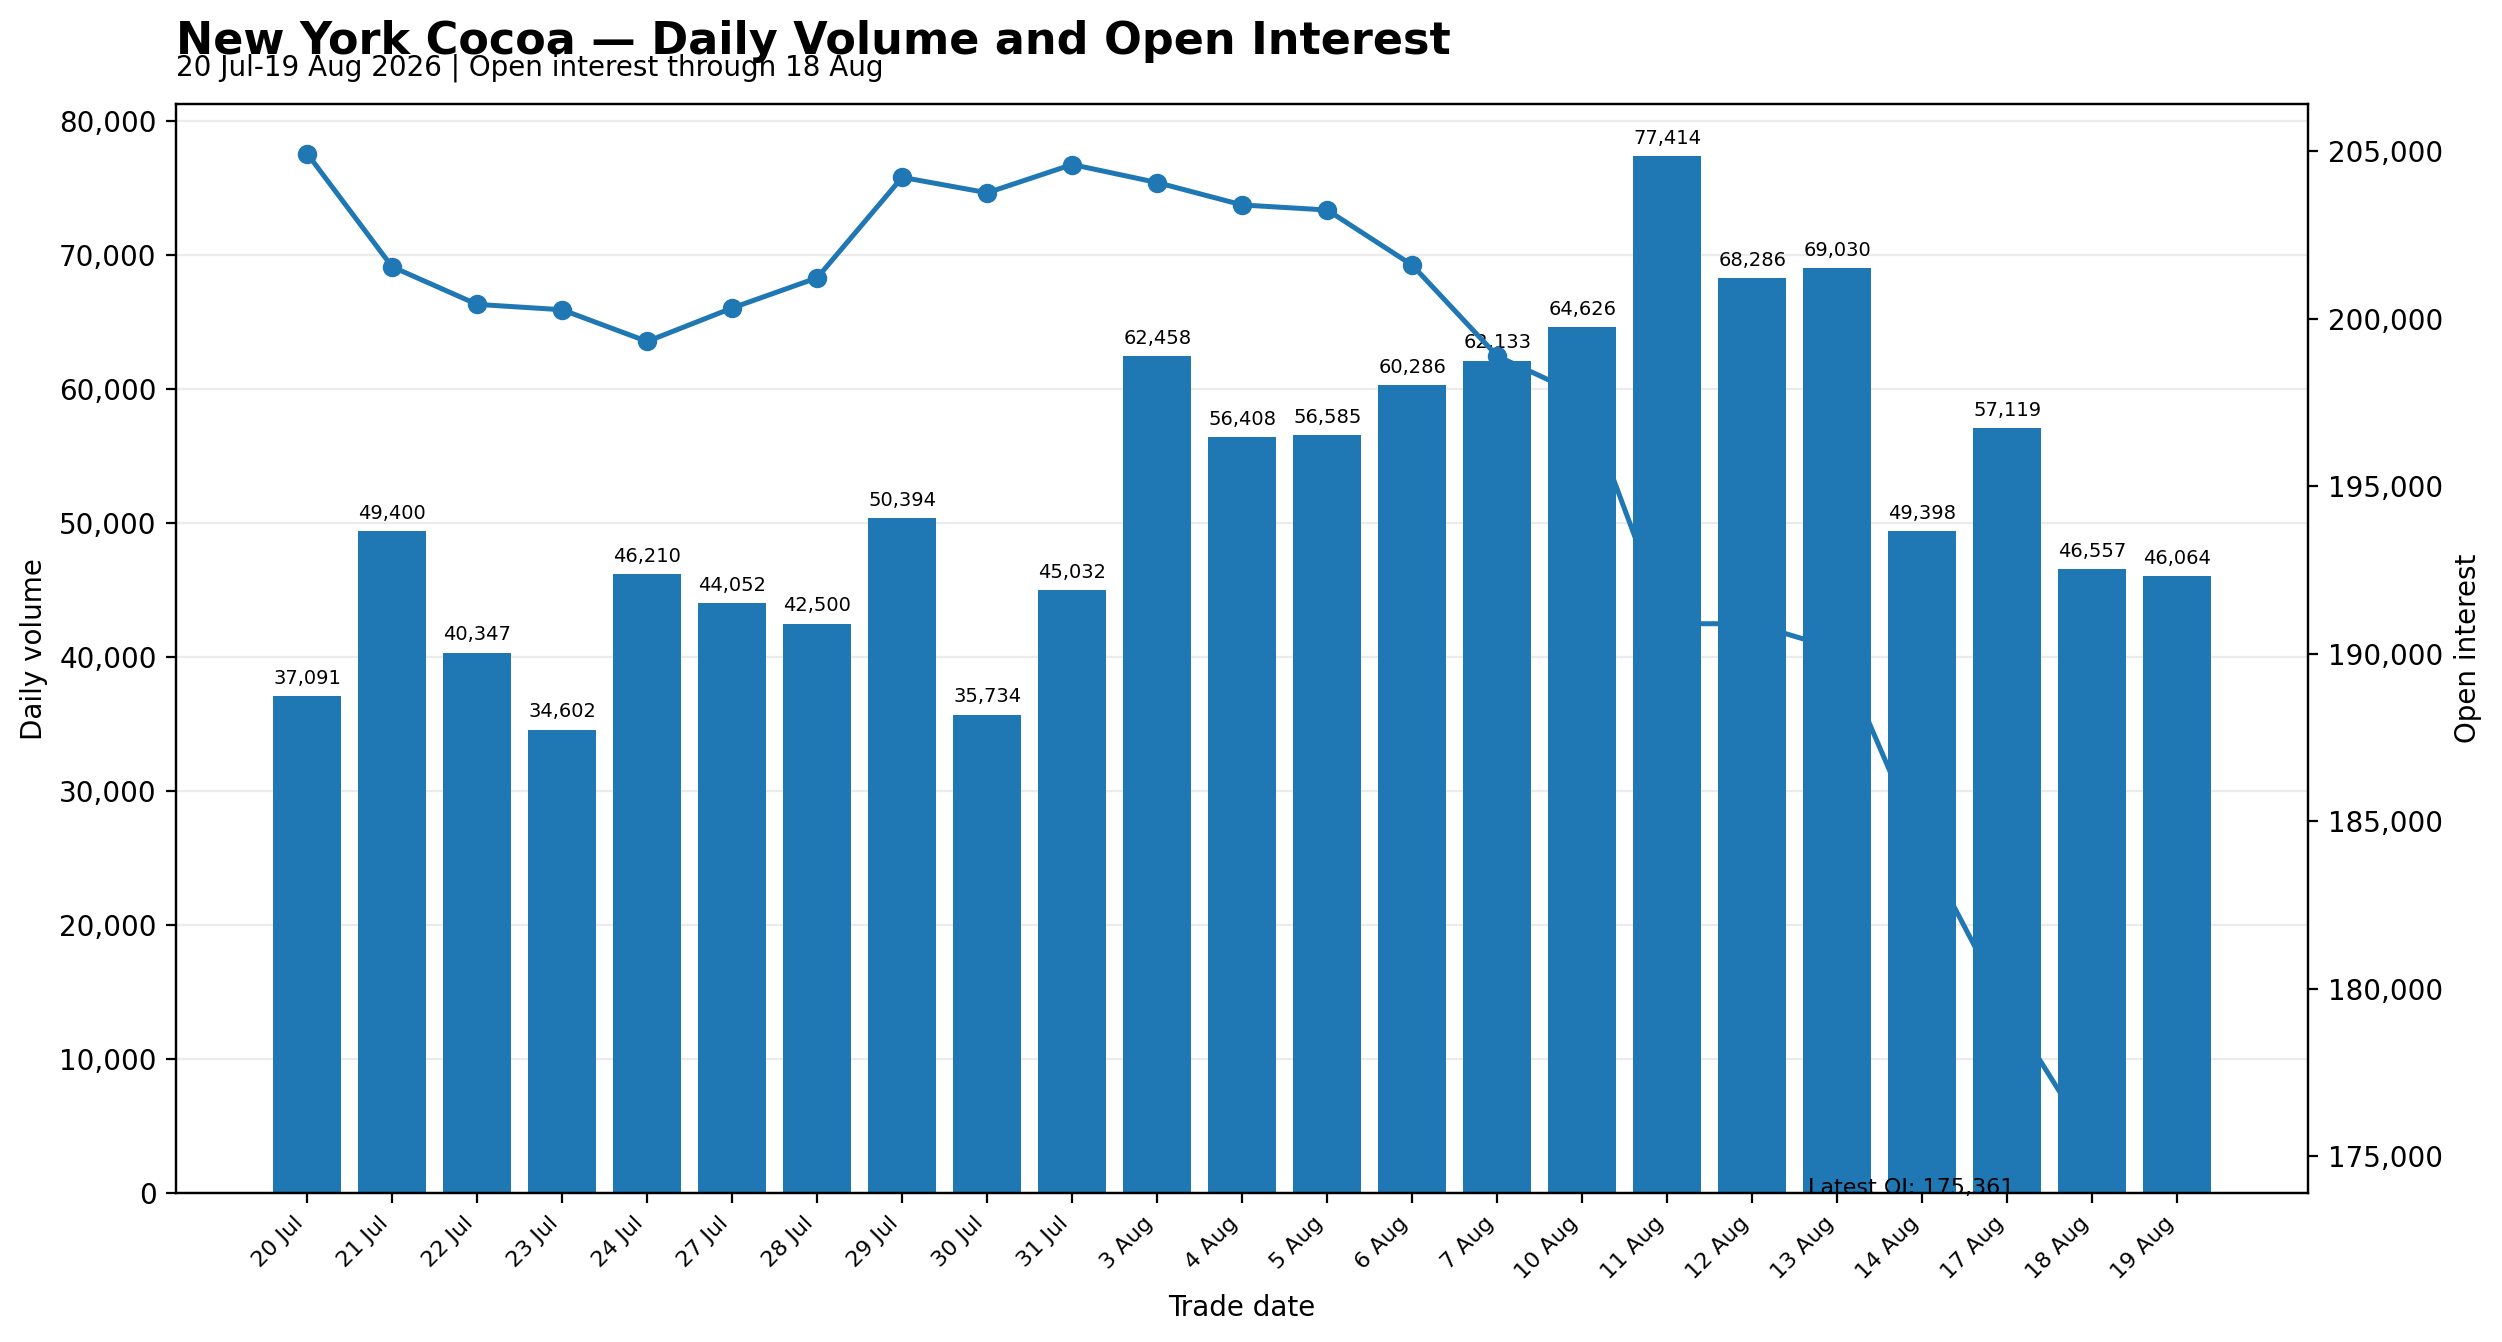
New York cocoa volume slipped to 46,064 contracts on 19 August, a decrease of 493 contracts, or 1.1%, from 46,557 contracts on 18 August.
Activity was 13.8% below the preceding 20-session average of 53,459 contracts. This indicates that participation remained subdued and stayed below the stronger trading levels seen earlier in August. Volume was also 31,350 contracts, or 40.5%, below the recent peak of 77,414 contracts recorded on 11 August.
The latest available open interest was 175,361 contracts on 18 August, down 4,046 contracts, or 2.3%, from 179,407 on 17 August. This extended the sharp contraction in outstanding positions visible through the second half of the period.
Since 20 July, New York open interest has fallen by 29,573 contracts, or 14.4%, from 204,934. The decline was particularly pronounced in the most recent part of the period. Between 10 August and 18 August alone, open interest dropped by 22,347 contracts, or 11.3%.
The combination of below-average volume and a continued decline in the latest available open interest suggests that overall participation remained weak and that the market was still shedding exposure rather than attracting broad new positioning. It provides more support for an interpretation of continued position reduction and rollover activity than for a renewed wave of aggressive accumulation.
London cocoa
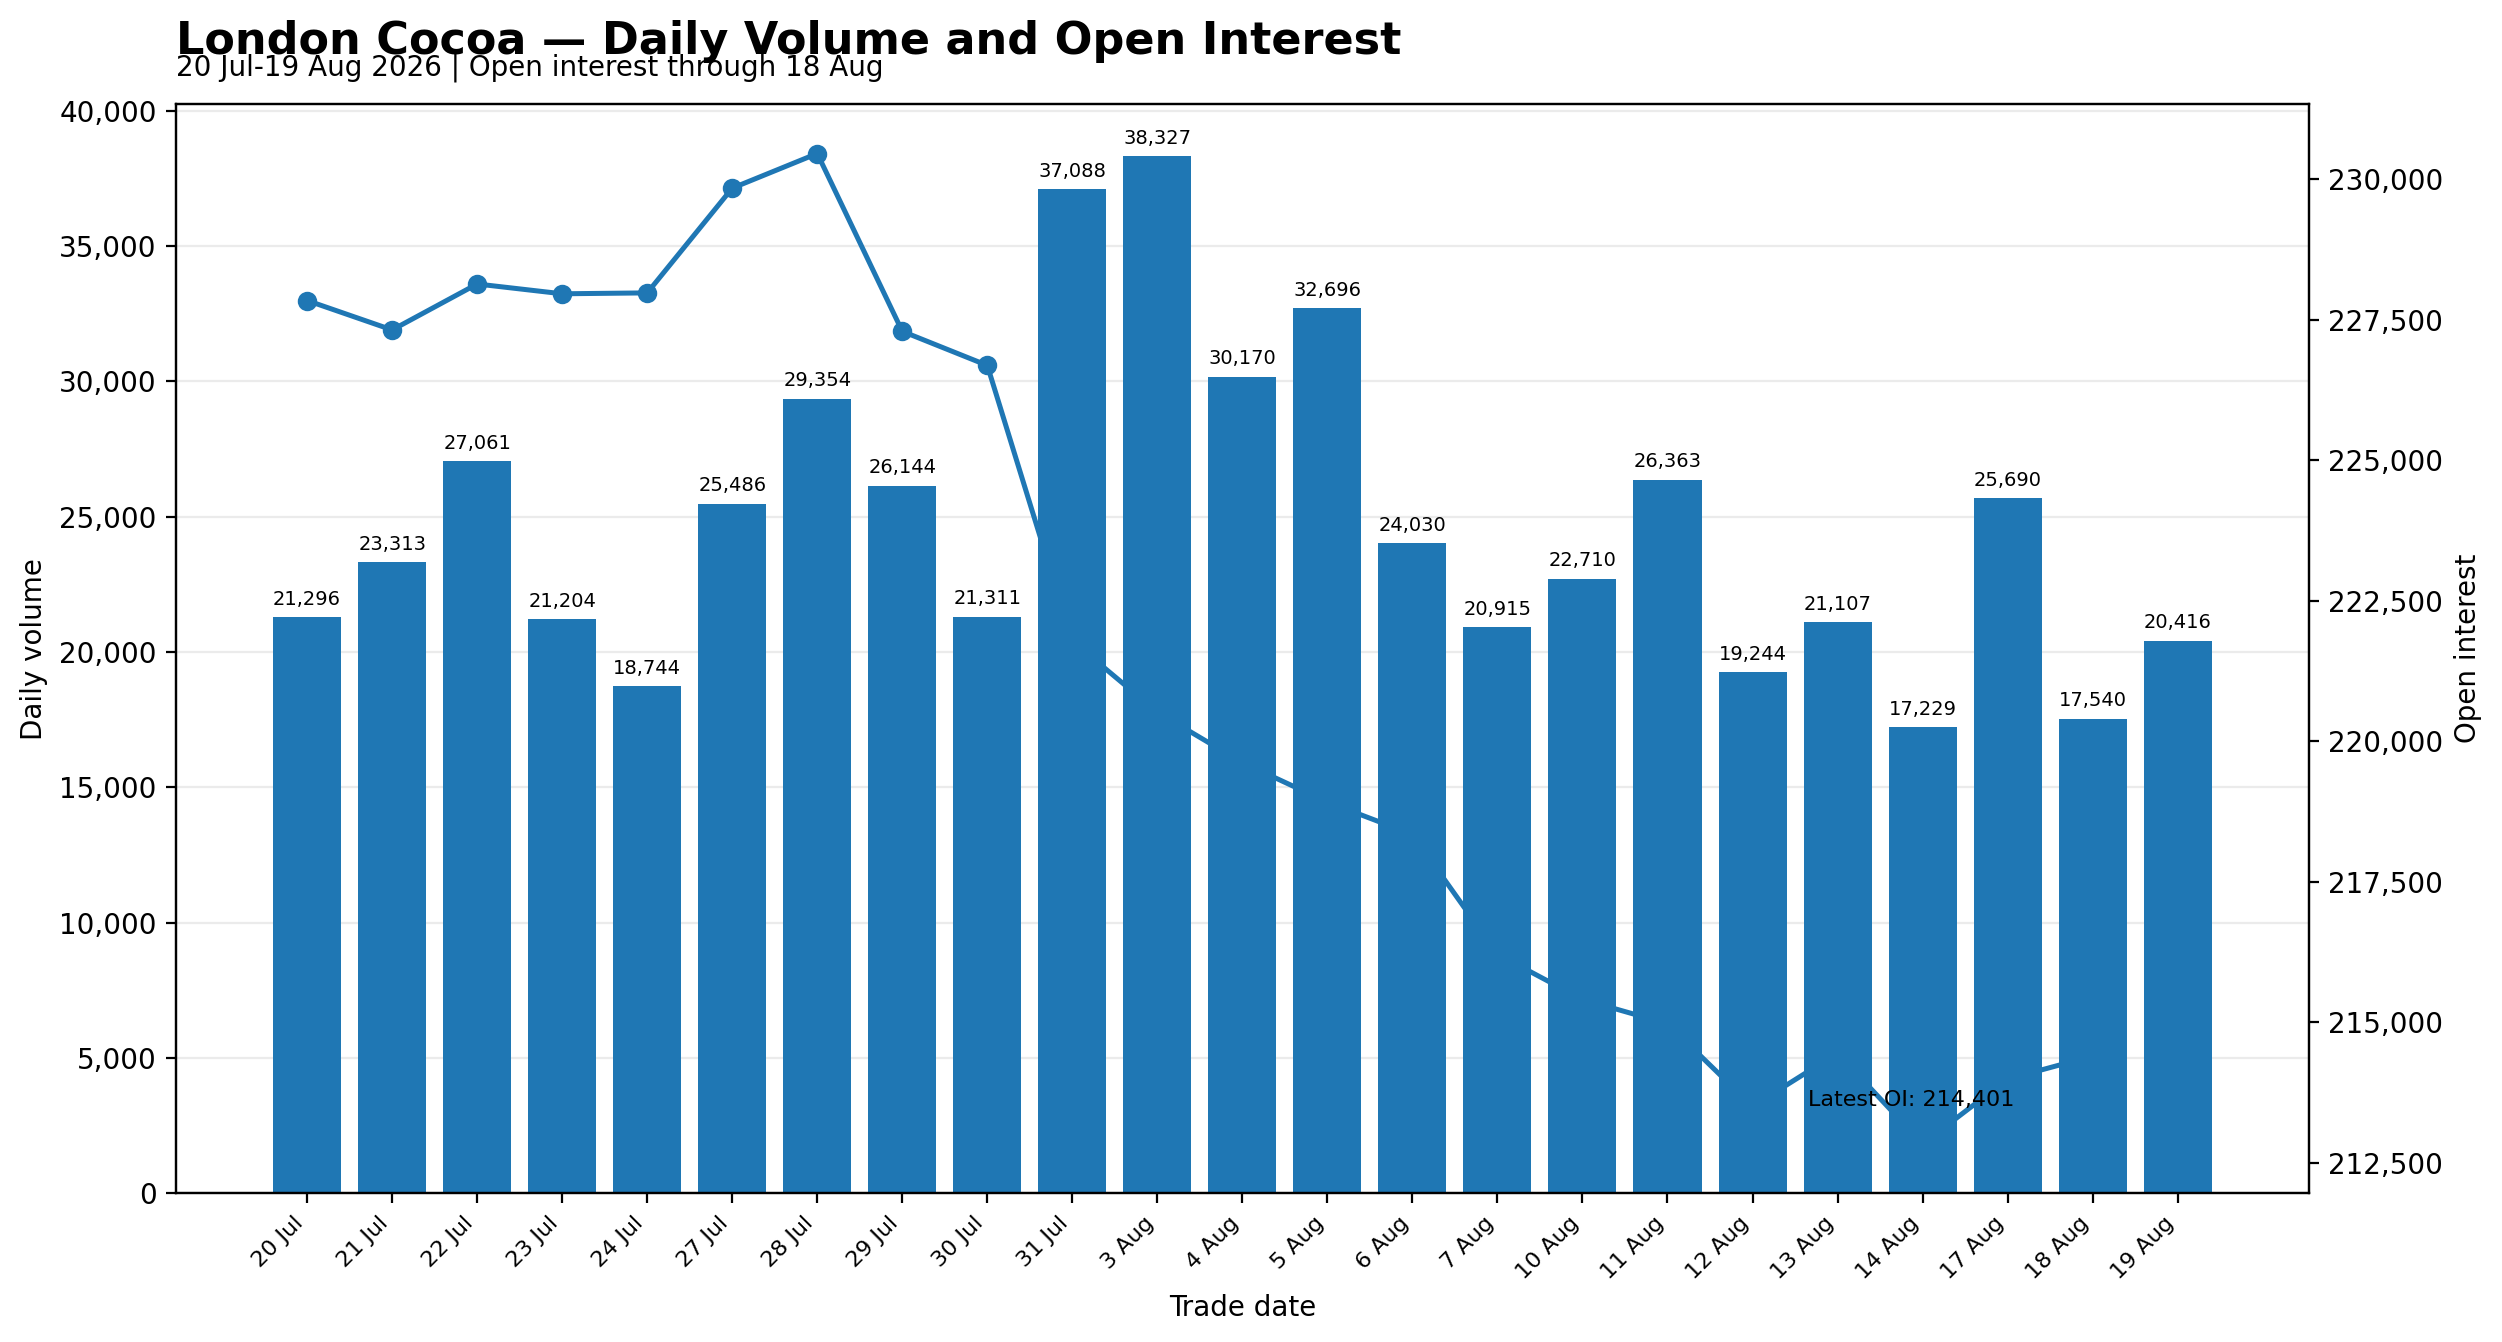
London cocoa volume recovered to 20,416 contracts on 19 August, an increase of 2,876 contracts, or 16.4%, from 17,540 contracts on 18 August.
Even with that rebound, activity remained 18.7% below the preceding 20-session average of 25,121 contracts. Volume was also 17,911 contracts, or 46.7%, below the recent peak of 38,327 contracts recorded on 3 August. This shows that the recovery in turnover was real, but still not strong enough to return activity to the more active levels seen earlier in the month.
The latest available open interest was 214,401 contracts on 18 August, up 410 contracts, or 0.2%, from 213,991 on 17 August. This marked a small stabilization after the broader decline seen during the previous weeks.
Since 20 July, London open interest has fallen by 13,439 contracts, or 5.9%, from 227,840. However, the pace of decline has been far less severe than in New York. Since 10 August, open interest has decreased by only 1,007 contracts, or 0.5%, from 215,408, indicating that the downtrend in outstanding positions had largely flattened by the latest available session.
The rebound in volume on 19 August, combined with the slight increase in the latest available open interest, suggests somewhat firmer participation than in the previous session. However, because total activity still remained below average, it does not yet indicate a decisive rebuild in market exposure. The data are more consistent with modest re-engagement after a weak session than with a major new inflow of positions.
Exchange Trading Volume
| MARKET | 18 AUG 2026 | 19 AUG 2026 | CHANGE | CHANGE % |
|---|---|---|---|---|
| US | 3,349,919 | 3,348,274 | -1,645 | -0.05% |
| UK | 1,146,719 | 1,146,719 | 0 | 0.00% |
The measure is not a complete regional stock-to-grind ratio, as it includes only exchange-certified cocoa held at U.S. and EU delivery ports and excludes commercial inventories outside the ICE warehouse system. North America NCA grindings cover processors across North America, while ICE U.S. certified stocks are stored at U.S. delivery ports. ECA reports bean usage in European countries and London-certified cocoa is held in European and UK delivery locations.
Readers can explore detailed cocoa market datasets, futures statistics, and historical indicators in the CocoaIntel Data Hub:
 Cocoa Intel
Thursday Outlook Dec Contract
New York Dec-26 cocoa closed at $5,934 on 19 August. The market is still trading inside a developing triangle, with resistance around $6,100 to $6,150 and support around $5,650. As the range continues to compress, the probability of a larger directional move is increasing. A confirmed break on either side could therefore trigger a much stronger move than the recent daily fluctuations.
The daily chart still gives a slightly constructive underlying picture. The 9-day SMA remains an important resistance level and price has so far failed to establish itself decisively above it. At the same time, the 21-day SMA is positioned close to the lower boundary of the triangle, creating a meaningful support confluence around the $5,600 to $5,700 area. As long as that zone holds, I would keep a modest bullish bias rather than turning bearish.
My preferred scenario is still an upside resolution, but I would not treat it as confirmed until price breaks and holds above roughly $6,150.
The downside scenario remains equally important because the structure is still unresolved. A break below $5,650 would damage the current bullish setup because it would take price below both the rising triangle support and the area of the 21-day SMA.