Mapped Is Not Compliant: How Ready Is the Global Cocoa Chain for the EUDR?


Contents
Executive judgment
1. Countries do not comply. Individual commercial chains do.
2. What an actual cocoa shipment must prove
3. The EU's exposure cannot be read from 2025 alone
4. The traceability funnel: where public readiness evidence disappears
5. Côte d'Ivoire: the decisive test is the indirect market
6. Ghana: the strongest architecture still has to prove the last mile
7. Cameroon: the denominator problem is the readiness problem
8. Nigeria: private compliant islands inside a first-mile market
9. Ecuador and Peru: credible programmes, incomplete conversion into national volume
10. Secondary origins: collectively large, publicly opaque
11. Are European buyer countries operationally ready?
12. How traceability can fail even when every farm is mapped
13. The political economy of readiness
14. Who pays, and who is excluded?
15. Processed cocoa hides the agricultural origin
16. The likely market outcome: documentable cocoa becomes a commercial attribute
17. Three scenarios for 2027
18. Final judgment
Research disclosure
Executive judgment
Executive judgment
With 131 days remaining before the principal application date of the European Union Deforestation Regulation, the global cocoa sector is neither wholly ready nor wholly unprepared. It is unevenly prepared across countries, companies, cooperatives, warehouses and individual trade corridors.
Producer countries have registered farmers, mapped farms and built traceability platforms. Major exporters have reorganised supplier networks, while European authorities have designated competent bodies and begun testing company procedures. The European Commission's Information System has reopened with updated technical specifications ahead of the 30 December 2026 application date for large and medium-sized operators. Other micro and small operators generally follow on 30 June 2027. (Sources: S01; S06)
The existence of those systems is not the decisive test. Readiness depends on whether physical cocoa can be connected from the actual production plot, through purchase and aggregation, to the export lot and the evidence assessed by the EU operator. That chain remains only partly visible in public data.
CocoaIntel's trade analysis uses monthly data from UN Comtrade merchandise-trade records. It separates the pre-crisis structure from the 2023/24 West African supply shock, the 2024/25 recovery and contract-rollover period, and the latest complete calendar-year exposure snapshot. (Sources: S28; S31)
Across 2019/20 through 2022/23, direct EU cocoa-bean imports averaged approximately 1.454 million tonnes per cocoa year. Imports rose to 1.538 million tonnes in 2023/24 despite ICCO's estimated 492,000-tonne global deficit, illustrating that customs flows reflect inventories, contract performance and shipment timing as well as current production. ICCO subsequently confirmed that Côte d'Ivoire and Ghana rolled part of their unfulfilled 2023/24 contracts into 2024/25. (Sources: S32; S33)
The delayed pressure became clearer in 2024/25, when direct EU bean imports fell to approximately 1.338 million tonnes, 13.0% below 2023/24 and 8.0% below the pre-crisis average, while declared value rose to approximately USD 11.80 billion. Calendar 2025 remains useful as an immediate EUDR exposure snapshot: the EU imported approximately 1.328 million tonnes, with Côte d'Ivoire, Nigeria, Cameroon and Ghana supplying 73.2% and the Netherlands receiving 52.6%. Those shares should not be read as the normal long-run sourcing structure.
A 20 August Reuters report adds a real-time stress test to that assessment. Côte d'Ivoire's cocoa regulator said the national system was ready for the 2026/27 season, while buyers, exporters and cooperative managers warned that missing producer cards and limited card-terminal availability could delay purchases and exports. Reuters also reported disputed estimates that cocoa produced in protected forests and national parks represents about 15% to around 30% of national output, with industry sources warning that such cocoa can still be mixed into legal flows because individual farm output is estimated rather than precisely measured. The evidence reinforces the distinction between technical readiness and operational assurance. (Source: S34)
The evidence points to five conclusions. First, farm registration and geolocation are more advanced than transaction-linked traceability. Second, readiness is strongest in direct and controlled commercial relationships. Third, the least transparent layer is the physical chain through aggregation, warehousing and processing. Fourth, producer and buyer readiness are inseparable because a break anywhere in the chain can undermine the evidence. Fifth, the most likely initial market outcome is segmentation rather than complete interruption.
|
The cocoa sector is
likely to have enough EUDR-documentable supply to avoid a complete breakdown,
but not enough uniformly demonstrated readiness to avoid premiums, diversion,
bottlenecks and smallholder exclusion. |
1. Countries do not comply. Individual commercial chains do.
Asking whether Ghana, Côte d'Ivoire or Ecuador is EUDR compliant is legally imprecise.
The EUDR does not normally impose direct obligations on non-EU farmers or producers unless they themselves place a relevant product on the EU market. The responsible EU operator must conduct the required due diligence before placing the product on the market or exporting it. Producer-country governments, exporters, cooperatives and traceability platforms provide the evidence and controls that allow the operator to do so, but they do not replace the operator's responsibility. (Sources: S30; S02)
The more useful concept is EUDR-enabling readiness. An origin is commercially enabling when its supply chain can reliably provide:
1. valid production-plot geolocation;
2. evidence that the production plots were not subject to prohibited deforestation after 31 December 2020;
3. evidence concerning relevant legislation in the country of production;
4. a credible link between the supplying plots and the purchased quantity;
5. physical controls that prevent unknown-origin material from entering the compliant lot;
6. records that can be transferred to and assessed by the responsible operator.
A national system can be strong in some of these functions and weak in others, while a private exporter can outperform the national market. The analysis therefore distinguishes claimed, technical, operational and verified readiness. Public evidence for most producer countries reaches the first three stages more often than the fourth.
|
Stage |
What it proves |
What it does not prove |
|
Claimed readiness |
A government or company
states that a system, map or programme exists |
That it covers the national
crop or works as described |
|
Technical readiness |
A platform, database,
procedure or satellite tool is operational |
That real commercial cocoa
is consistently processed through it |
|
Operational readiness |
Actual purchases and
shipments have used the system |
That the records and
physical chain are accurate |
|
Verified readiness |
The process has been tested
through independent audit or competent-authority inspection |
That every future shipment
will comply |
2. What an actual cocoa shipment must prove
The regulation is demanding because it is batch-specific. The relevant cocoa must be traceable to all production plots that contributed to it. Where cocoa from several plots is combined, the operator may provide the complete set of contributing geolocations. If the required geolocation cannot be collected for every contributing plot, the product should not be placed on or exported from the EU market. (Sources: S02) The practical chain can be expressed as:
|
Plot ID → producer ID
→ purchase record → first buyer → cooperative or aggregator → warehouse lot →
export lot → shipping document → EU operator → due-diligence statement |
Each arrow represents a potential break.
2.1 Geolocation is necessary, but it is not provenance
A polygon establishes the declared location of a farm. It does not prove that the cocoa in a bag came from that polygon.
For provenance, the chain must also establish who operated and sold from the farm, when and how much was purchased, whether the quantity is plausible, where it moved through the buying and warehouse system, and whether that physical volume remained inside the approved chain. A valid polygon attached to the wrong transaction creates digital traceability without physical truth.
2.2 Controlled aggregation is permitted
The EUDR does not require permanent identity preservation of every bean from one farm. Cocoa from multiple compliant plots can be combined. The operator must nevertheless know all contributing plots and must exclude unknown-origin or non-compliant material.
The Commission states that conventional mass-balance systems are not acceptable where they permit mixing with products of unknown origin or products that do not meet the regulation. If a non-compliant component cannot be identified and separated, the whole batch may become non-compliant. (Sources: S02)
For cocoa, this moves the compliance problem into depots, warehouses, silos and processing lines. The relevant questions become operational:
- Was every bag accepted only after its supplier record was validated?
- Can the stock system identify every approved lot in the warehouse?
- Can unknown or conventional cocoa enter the same storage location?
- Can input and output quantities be reconciled?
- Can a rejected component be physically isolated?
The Commission's silo examples confirm that operators may need to associate the product with all relevant plots represented in the storage system, depending on how inventory is managed. The system cannot be used as a reservoir into which unknown-origin material is introduced. (Sources: S02)
2.3 Due diligence is not a software submission
The Commission describes due diligence as information collection, risk assessment and, where necessary, risk mitigation. Operators must consider supply-chain complexity, document reliability, corruption, data falsification, weak law enforcement, circumvention and mixing risk. Due diligence is not a fixed tick-box exercise. The operator must be able to show how the information was assessed and why the remaining risk is negligible. (Sources: S03; S07)
This matters because a company can be technically capable of submitting a due-diligence statement while remaining operationally weak. A platform can validate file format, polygon geometry and satellite alerts. It cannot independently know whether the declared farmer supplied the beans, whether the quantity is plausible, or whether another lot entered the warehouse.
2.4 Low-risk status is a procedural advantage, not a product guarantee
Operators sourcing exclusively from low-risk countries may use simplified due diligence when the conditions are met. They still have to collect the required information and must be confident that the product has not been mixed with standard-risk, high-risk or unknown-origin material. (Sources: S05; S02)
This distinction is especially important for Ghana. Its low-risk classification may reduce the procedural burden for a verified Ghana-only chain. It does not validate every cocoa lot declared as Ghanaian, nor does it remove the need to control cross-border or warehouse mixing.
3. The EU's exposure cannot be read from 2025 alone
The completed 2025 calendar year is useful for identifying the trade corridors, buyers and origins that were most active immediately before EUDR application. It is not a neutral structural baseline. The 2023/24 West African crop failure, the depletion and reallocation of inventories, contract rollovers and extreme prices materially changed the timing and origin of subsequent trade. The correct analytical sequence is:
|
pre-crisis structure
-> 2023/24 supply shock -> 2024/25 recovery and rollover -> current
EUDR exposure |
3.1 The pre-crisis baseline and the delayed trade impact of the crop failure
|
Cocoa year |
Direct extra-EU bean imports |
Declared value |
Interpretation |
|
2019/20 |
1,562,593 t |
USD 4.09 bn |
Pre-crisis baseline |
|
2020/21 |
1,522,443 t |
USD 4.33 bn |
Pre-crisis baseline |
|
2021/22 |
1,370,179 t |
USD 3.41 bn |
Pre-crisis baseline |
|
2022/23 |
1,359,580 t |
USD 3.71 bn |
Last pre-crisis cocoa year |
|
2019/20-2022/23 average |
1,453,699 t |
USD 3.88 bn |
Structural reference |
|
2023/24 |
1,538,191 t |
USD 6.83 bn |
Crisis year, but customs
deliveries remained high |
|
2024/25 |
1,337,503 t |
USD 11.80 bn |
Recovery and rollover year;
physical imports fell sharply |
|
2025/26, Oct-May |
808,361 t |
USD 6.07 bn |
Provisional current-period
comparison |
Source: CocoaIntel analysis of World Bank WITS data. (Sources: S28; S31)
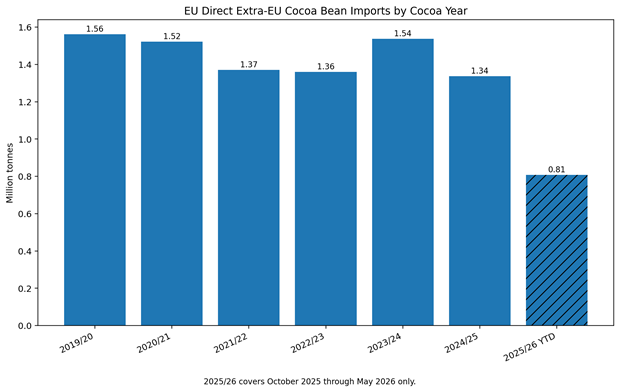
EU direct cocoa bean imports by cocoa year
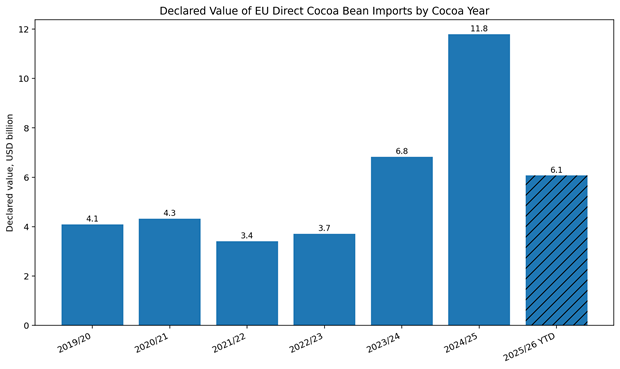
Declared value of EU direct cocoa bean imports by cocoa year
The 2023/24 import total was 13.1% above 2022/23 and 5.8% above the four-season pre-crisis average. That does not mean the crop crisis increased physical supply. ICCO estimates that global production fell to 4.362 million tonnes and that the season ended with a 492,000-tonne deficit and a stocks-to-grindings ratio of 26.4%. (Source: S32)
The higher customs total is evidence that production, shipment and import timing are not interchangeable. EU buyers were able to receive cocoa through a combination of contracts fixed earlier, stocks, delayed reporting, destination prioritisation and deliveries crossing crop-year boundaries. ICCO stated in November
2024 that Côte d'Ivoire and Ghana had rolled part of their 2023/24 contracts into 2024/25. (Source: S33)
The delayed physical stress is clearer in 2024/25. Import volume fell by 13.0% from the crisis-year customs total and by 8.0% relative to the pre-crisis average. Declared import value nevertheless rose by 72.7% from 2023/24. The average declared unit value increased from approximately USD 2,730 per tonne in 2022/23 to USD 4,440 in 2023/24 and USD 8,820 in 2024/25.
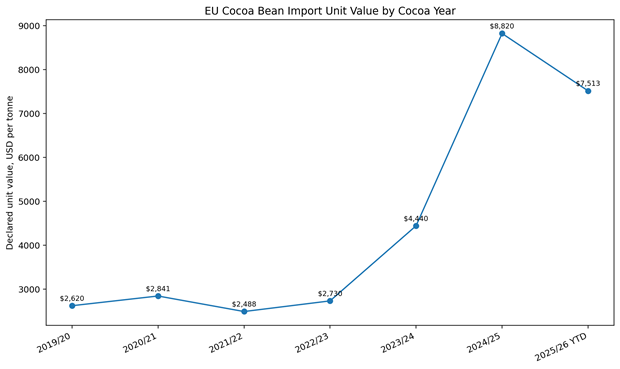
EU cocoa bean import unit value by cocoa year
The current 2025/26 data should be treated cautiously. October 2025 through May 2026 imports were 14.4% below the same eight-month window in 2024/25 and 19.4% below the equivalent four-season pre-crisis average. This may reflect lower physical demand, supply tightness, inventory use and reporting lag. It should not be presented as a final full-season result.
3.2 The shock changed the origin mix
|
Origin |
Pre-crisis average |
2023/24 crisis |
2024/25 recovery/rollover |
2025/26 Oct-May share |
|
Côte d'Ivoire |
699,209 t; 48.0% |
628,595 t; 40.9% |
521,147 t; 39.0% |
38.6% |
|
Ghana |
190,635 t; 13.1% |
131,391 t; 8.5% |
129,517 t; 9.7% |
13.7% |
|
Nigeria |
128,798 t; 8.8% |
229,483 t; 14.9% |
179,100 t; 13.4% |
13.1% |
|
Cameroon |
199,810 t; 13.8% |
165,596 t; 10.8% |
152,366 t; 11.4% |
13.2% |
|
Ecuador |
69,527 t; 4.8% |
87,451 t; 5.7% |
113,980 t; 8.5% |
7.9% |
|
Peru |
23,293 t; 1.6% |
32,413 t; 2.1% |
39,061 t; 2.9% |
3.7% |
Source: CocoaIntel analysis of World Bank WITS data. (Sources: S28; S31)
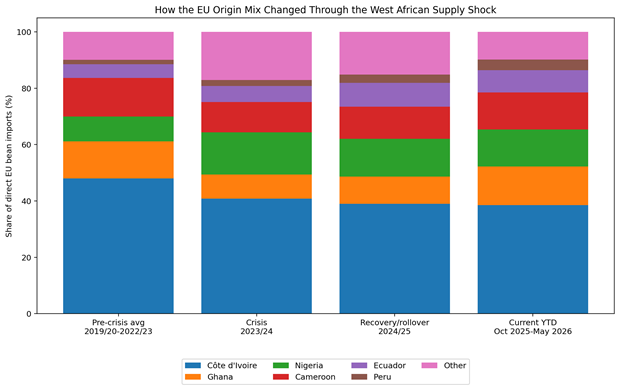
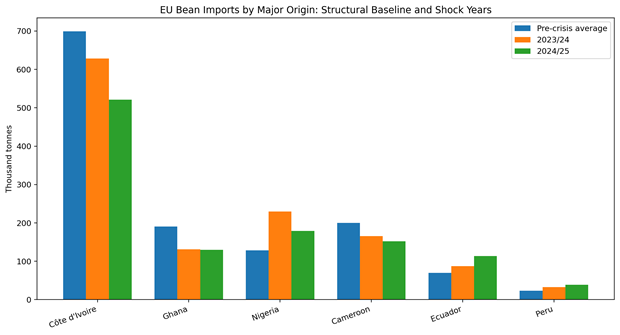
The historical comparison changes the interpretation of the 2025 snapshot.
Côte d'Ivoire supplied 37.7% of calendar-year 2025 imports, but its structural pre-crisis share was approximately 48.0%. Its recent share therefore understates its normal strategic importance to the EU cocoa complex.
Ghana's share fell from approximately 13.1% in the pre-crisis baseline to 8.5% in 2023/24 and 9.7% in 2024/25. Its share recovered to 13.7% in the provisional October-May 2025/26 window, although the tonnage remained below the equivalent pre-crisis average.
Nigeria was the clearest major substitution origin. Its share increased from 8.8% before the crisis to 14.9% in
2023/24 and remained at 13.4% in 2024/25. The persistence of that gain suggests more than a single-season statistical anomaly, although the final degree of structural change cannot be determined until West African crops and European demand normalise.
Ecuador and Peru also gained durable share. Ecuador rose from 4.8% of the pre-crisis market to 8.5% in 2024/25. Peru rose from 1.6% to 2.9%. Their higher 2025 importance partly reflects substitution away from constrained West African supply, but also expanding commercial relationships that may persist under EUDR.
Cameroon requires a different interpretation. Its tonnage fell materially from the pre-crisis average, while its share recovered toward the baseline because total EU imports also contracted. A stable share does not necessarily mean stable physical availability.
3.3 Buyer-country concentration remained structural
|
EU entry country |
Pre-crisis share |
2023/24 |
2024/25 |
2025/26 Oct-May |
|
Netherlands |
53.7% |
58.6% |
53.2% |
58.9% |
|
Germany |
12.1% |
8.4% |
10.2% |
9.8% |
|
France |
10.7% |
8.3% |
9.9% |
3.5% |
|
Belgium |
6.9% |
7.4% |
7.2% |
7.5% |
|
Italy |
6.2% |
5.9% |
5.7% |
9.3% |
|
Spain |
6.1% |
6.1% |
7.8% |
7.4% |
Source: CocoaIntel analysis of World Bank WITS data. Current-period shares remain provisional and may be affected by reporting lags. (Sources: S28; S31)
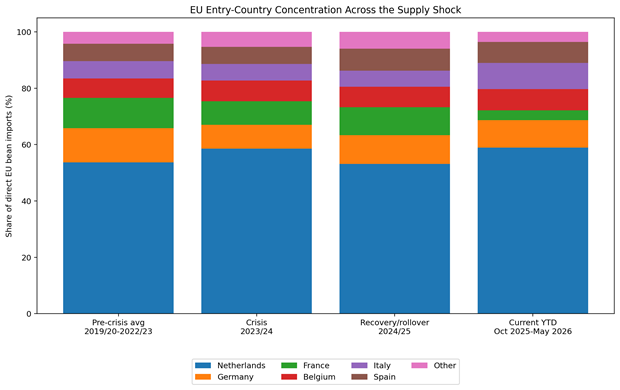
The Netherlands was the dominant entry country before, during and after the shock. Its role is therefore structural rather than a temporary 2025 effect. Germany and France lost share during the crisis, while Spain and Italy gained relative importance in 2024/25 or the current partial period. Some of these movements may reflect routing, reporting and inventory decisions rather than final consumption.
The largest origin-to-buyer corridors also persisted, but their volumes changed materially. Côte d'Ivoire to the Netherlands remained the leading corridor, while Nigeria to the Netherlands expanded sharply during the crisis. Ecuador to the Netherlands also gained importance in 2024/25.
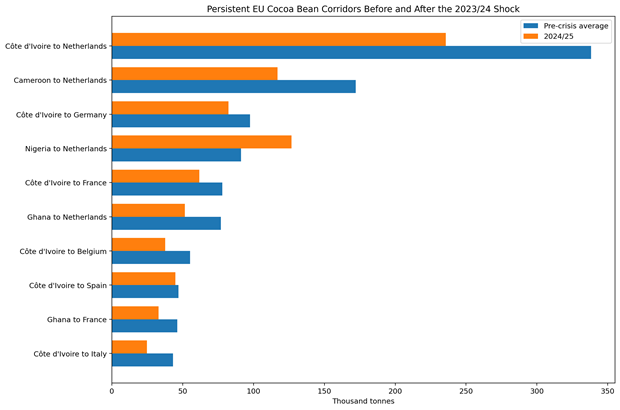
Persistent EU cocoa bean corridors before and after the 2023/24 shock
3.4 The 2025 snapshot remains useful for immediate EUDR exposure
The latest complete calendar year still matters because EUDR implementation will confront current procurement systems, warehouses and counterparties rather than a theoretical average market.
In calendar 2025, the EU imported approximately 1.328 million tonnes of cocoa beans directly from outside the Union, with a declared value of approximately USD 12.045 billion. Côte d'Ivoire, Nigeria, Cameroon, Ghana and Ecuador supplied 81.6%. The Netherlands received 52.6%, and the six largest producer-to-buyer corridors represented 49.6%.
The correct interpretation is therefore dual:
- Тhe structural baseline determines which origins and gateways matter over a normal cycle;
- Тhe 2025 snapshot identifies the commercial lanes most exposed immediately before EUDR application. Neither view is sufficient alone.
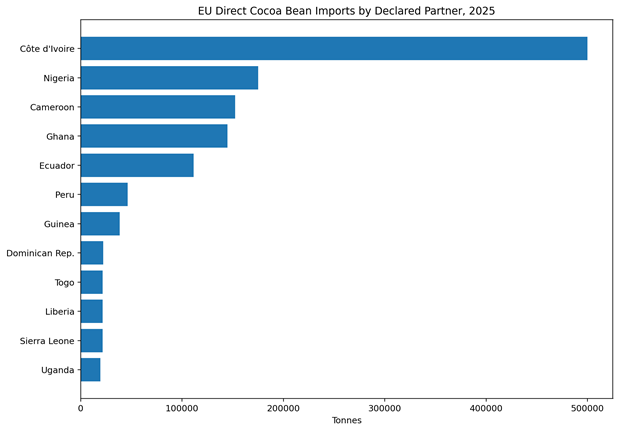
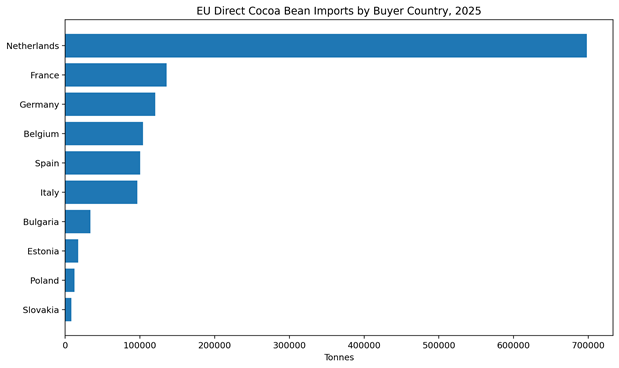
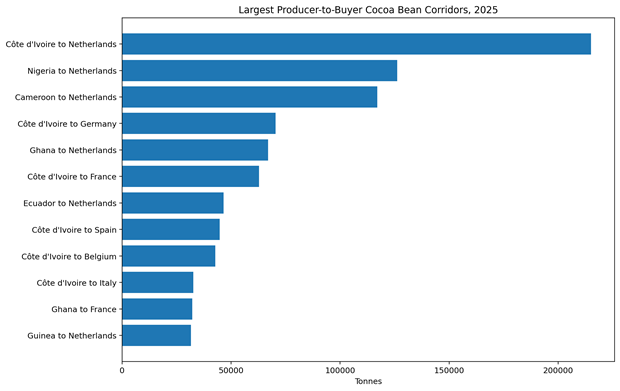
Processed cocoa creates a separate exposure problem because the immediate customs partner may be a processing country rather than the agricultural origin of the underlying cocoa. Section 15 examines that issue in detail.
3.5 What the historical correction changes
The readiness scorecard should use two exposure measures: structural exposure based on the pre-crisis multi-season average, and current operational exposure based on the latest complete and sufficiently reported trade period.
That distinction materially changes interpretation. Côte d'Ivoire and Ghana remain more structurally important than the 2025 snapshot suggests. Nigeria, Ecuador and Peru gained commercial importance during the supply shock, though part of that gain may prove cyclical. Cameroon remained important even as its absolute tonnage declined, while the Netherlands was the dominant EU entry gateway throughout. Using both measures prevents an abnormal crop cycle from being mistaken for a permanent sourcing structure.
4. The traceability funnel: where public readiness evidence disappears
National readiness should be assessed as a funnel rather than a single percentage. Registration and mapping show how much of the production base is visible. The harder indicators are active transacting suppliers, purchases linked to valid plots, warehouse-controlled volume, shipment-linked cocoa, importer-usable evidence and independently tested volume.
|
Funnel stage |
What should be measured |
Public evidence across major origins |
|
Estimated cocoa producers |
Active farmers or farm
operators |
Usually available, but
often approximate |
|
Registered producers |
Individuals entered into a
national or private database |
Frequently reported |
|
Mapped farms or plots |
Valid points or polygons
linked to producers |
Frequently reported |
|
Active transacting
suppliers |
Registered producers who
actually sold during the current season |
Rarely reported |
|
Transaction-linked
purchases |
Tonnes linked to a farmer,
plot, date and quantity |
Incompletely reported |
|
Warehouse-controlled cocoa |
Tonnes kept free from
unknown-origin mixing |
Rarely disclosed |
|
Shipment-linked cocoa |
Tonnes connected to an
export lot and complete plot set |
Limited public evidence |
|
Importer-usable evidence |
Shipments producing a
usable due-diligence package |
Very limited public
evidence |
|
Independently tested volume |
Commercial volume examined
by an external auditor or authority |
Scarce |
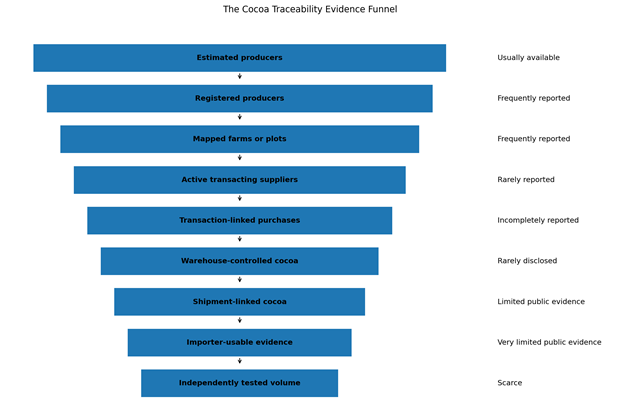
Public reporting is strongest at the top of that funnel and weakest near the physical shipment. This is the principal evidence gap used throughout the country assessments below.
Producer-country assessment
|
Origin |
2025 EU bean volume |
Assessment of publicly demonstrated readiness |
Confidence |
Distinctive unresolved question |
|
Côte d'Ivoire |
500,081 t |
Substantial but incomplete |
High |
Can indirect cocoa be
integrated without creating artificial traceability? |
|
Ghana |
144,882 t |
Leading enabling
architecture |
Medium-high |
Can the strongest national
system prove the complete commercial chain at scale? |
|
Cameroon |
152,366 t |
Fragmented readiness |
Medium |
Which coverage claims are
national, and which apply only to participating supply chains? |
|
Nigeria |
175,040 t |
Fragmented nationally,
stronger private lanes |
Medium |
Can exporter-controlled
systems include the wider first-mile market? |
|
Ecuador |
111,600 t |
Institutional build-out,
incomplete operational proof |
Medium |
Can registration and
training become transaction-linked export volume? |
|
Peru |
46,512 t |
Strong pilots and organised
chains, incomplete national proof |
Medium |
Can cooperative capability
be scaled across a fragmented production base? |
|
Secondary origins |
139,889 t |
Insufficient or uneven
public evidence |
Low |
How much commercial volume
is actually linked to plots and shipments? |
5. Côte d'Ivoire: the decisive test is the indirect market
Côte d'Ivoire is the most important producer-country case. It supplied 37.7% of direct EU bean imports in calendar 2025, but its pre-crisis structural share was approximately 48.0%. The lower recent share reflects the West African supply shock and should not be interpreted as a permanent reduction in its strategic importance.
The national foundations are substantial. An EU-funded preparedness assessment reported that by December 2024 approximately 1.1 million farmers had been registered, more than 3.2 million hectares had been recorded and close to 891,000 farmer cards had been distributed. The national system was designed to connect producer identification, commercial transactions and labelled bags. At that stage, 1,165 of about 2,000 relevant operators had been integrated, while the pilot had covered approximately 15,205 tonnes from more than 40,000 producers. (Sources: S11)
The programme has advanced since then. The Conseil du Café-Cacao reported a successful pilot involving nearly 2,300 cooperatives and 80 buyers before the planned general deployment. Public reporting in June 2026 stated that more than 160,000 tonnes had been commercialised with complete farm-to-shipment traceability between October 2025 and March 2026, and that the producer card would become mandatory for transactions from 1 September 2026. (Sources: S13)
These numbers show genuine operational progress. They do not yet prove national commercial coverage.
5.1 Why the headline percentages cannot be combined
Côte d'Ivoire's headline figures measure different things: registered producers, cards distributed, mapped hectares, pilot tonnes, traced commercial volume and EU imports. They also cover different periods and destinations. Dividing the reported 160,000 traced tonnes by the 500,081 tonnes imported by the EU in calendar 2025 would therefore create a false readiness percentage.
The defensible conclusion is narrower: the national system has moved beyond a small demonstration, but public data still do not reveal the share of the current exportable crop that can generate a complete, importer-usable evidence package.
5.2 Indirect sourcing is the structural weakness
The EU-funded assessment found that 56% of cocoa was indirectly sourced or not traceable under the market structures it examined. It also identified weak interoperability between national and private systems, low recording of national farmer identifiers in exporter systems, and unresolved questions concerning audit, data updating and financing. (Sources: S11)
A separate 2026 Trase analysis estimated that only 48% of 2024 export volume could be connected through publicly disclosed trader relationships to specific production departments. This is not a measurement of the national platform's current performance, but it is evidence of the commercial structure that the platform must transform. (Sources: S14)
Indirect sourcing is difficult because cocoa may be aggregated before the supplying farmer, plot and quantity are reliably recorded. The specific failure routes are examined in Section 12. The national system can accommodate intermediaries only if origin is captured at the point where cocoa changes hands, before physical identity is lost.
5.3 The 1 September test is operational, not ceremonial
The mandatory producer card can improve transaction discipline if buyers cannot purchase without validating the card and assigning the cocoa to an approved lot.
Reuters reporting on 20 August, less than two weeks before the planned mandatory rollout, provides the clearest current operational stress test. Conseil du Café-Cacao head Yves Brahima Koné said the system had been tested for two years and was ready. However, Reuters reported that nine buyers, seven exporters and four cooperative managers warned that farmers who had not received cards, or who had lost them, could be unable to sell cocoa, and they cited a shortage of card terminals. These are reported industry concerns rather than evidence that disruption will necessarily occur, but they move the risk from a hypothetical implementation issue to an immediate execution test. (Source: S34)
- The critical indicators after general deployment will be:
- percentage of national purchases recorded through the system;
- number and volume of rejected transactions;
- percentage of purchases linked to complete plot records;
- quantity entering through intermediaries;
- number of corrections to farmer and farm data;
- volume maintained under controlled warehousing;
- export lots for which the full plot set is successfully generated;
- evidence-transfer failures reported by EU buyers.
Publishing only card distribution and mapped area would not reveal whether the system is working.
5.4 Forest legality remains more complex than map accuracy
Côte d'Ivoire has developed a 2020 land-use map with reported accuracy of about 91%. The preparedness assessment nevertheless identified differences between forest frameworks and unresolved boundary and status questions in classified forests, protected areas and admitted agricultural zones. (Sources: S11)
Reuters also reported a wide disagreement over the scale of cocoa produced illegally in protected forests and national parks. Côte d'Ivoire estimates roughly 15% of national output, while exporters and European environmental groups cited around 30%. Neither figure should be treated as independently verified. More important for EUDR control design, industry sources told Reuters that cocoa from protected areas can still enter export channels through Abidjan and San Pedro and be mixed with legally produced beans because individual farmer output is estimated rather than precisely measured. (Source: S34)
This illustrates a broader EUDR reality. A farm can be mapped correctly and still present a legality problem. The relevant question is not only whether trees were cleared after 2020. It is whether cocoa production is permitted under the applicable national rules and whether the supporting evidence is reliable.
Assessment
Côte d'Ivoire has a credible national architecture and materially more traced volume than its early pilots. The 20 August evidence strengthens, rather than changes, the assessment that readiness is substantial but incomplete: technical deployment is advanced, but mandatory rollout, protected-area legality and quantity-control integrity remain operationally fragile. The central risk is still that valid identities and polygons can become attached to cocoa after physical origin has already become uncertain.
6. Ghana: the strongest architecture still has to prove the last mile
Ghana presents the strongest national enabling model among the major West African origins.
An EU-funded technical assessment reported 792,954 registered farmers, 1,239,169 farms and approximately 1.374 million mapped hectares. The Ghana Cocoa Traceability System was designed to connect the Cocoa Management System with purchasing, payment, bag identification and export data. Pilots and a dry run had been undertaken with licensed buying companies and Dutch authorities. (Sources: S10)
The Commission's 2026 implementation review stated that Ghana had rolled out the national traceability system, linking farmer registration with export data and buyer-facing due-diligence reports. Ghana is also classified as low risk under the Commission's benchmarking system. (Sources: S08; S04)
These factors make Ghana the leading national case. They do not remove the need for evidence at shipment level.
6.1 Ghana's institutional advantage
Ghana's regulated marketing structure can support common standards more effectively than a fragmented market. In principle, one national architecture can assign farmer and farm identities, standardise licensed-buyer transactions, link bags to purchases, reconcile delivery through takeover centres and produce common buyer-facing records. This reduces some of the fragmentation visible in Nigeria or Cameroon.
6.2 The central public evidence gap is commercial volume
COCOBOD's earlier public reporting described a pilot shipment of approximately 77.25 tonnes and claimed complete first-mile traceability as a system objective. The technical assessment, however, warned that private-system origin visibility could be lost after delivery into the central marketing chain and identified unresolved questions concerning interoperability, independent audit and financial sustainability. (Sources: S10)
The Commission's later statement that the system had been rolled out is important, but it did not publish the volume of current exports that had passed through the complete process or the results of independent transaction and warehouse testing.
The correct description is therefore not “Ghana is fully compliant.” It is “Ghana has the strongest publicly documented national enabling architecture, but commercial-scale verification remains insufficiently disclosed.”
6.3 Low-risk status creates a second control problem
Ghana's low-risk classification can reduce the operator's procedural burden and may increase the commercial value of cocoa declared as Ghanaian relative to standard-risk neighbouring supply. That makes origin integrity more important, not less. The system must detect implausible purchases, cross-border inflows, relabelling and mixing after the first traceable transaction.
6.4 Forest and legality evidence still require transparency
The earlier technical assessment found that the methodology and access arrangements for national forest-risk tools required greater transparency and that operational monitoring was still being developed. (Sources: S10)
Public evidence should now clarify the authoritative forest baseline, alert investigation and polygon correction procedures, treatment of reserve and admitted-farm status, legality documents supplied to buyers and the mechanism for independent validation.
Assessment
Ghana has the leading enabling architecture in the producer group reviewed. The unresolved question is commercial-scale proof: whether the system can demonstrate the complete physical and evidentiary chain with independent assurance and reliable buyer access.
7. Cameroon: the denominator problem is the readiness problem
Cameroon illustrates how the same country can appear advanced or far behind depending on the statistic selected.
An EU-funded assessment reported that by April 2025 approximately 150,000 plots belonging to about 100,000 producers had been geolocated. It identified an additional mapping initiative covering around 28,000 plots and 24,700 producers. The same assessment estimated a national population of roughly 300,000 cocoa producers. (Sources: S12)
It also reported that approximately half of traded cocoa was geolocated through certified or data-sharing supply chains. Mapping was constrained by a shortage of trained surveyors and by security conditions in the Southwest, a region responsible for a material share of national production. Informal first-mile transactions, commonly described as coxing, remained a significant weakness. (Sources: S12)
Other programme communications have cited much higher coverage among participating organisations or exporter-linked cocoa. Those figures may be valid within their stated programmes. They cannot be treated as national readiness without a common denominator.
7.1 Four percentages can describe four different realities
Cameroon can simultaneously report high mapping coverage among participating exporters, lower coverage across the national farmer population, a different share of traded tonnes carrying geolocation data, and a still smaller share linked through transactions to export lots. A headline such as “90% georeferenced” is therefore incomplete unless the denominator is explicit.
7.2 Data-sharing solves one problem and leaves another
Cameroon's GeoShare approach can reduce duplicated farm mapping and help exporters identify existing geolocation records. But a shared polygon does not prove a shared transaction. An exporter still needs to know whether the farmer supplied the cocoa, whether the quantity is plausible and whether aggregation preserved the link to the declared origin. Data-sharing is useful infrastructure, not a substitute for transaction capture.
7.3 Conflict and informality create asymmetric exclusion
Where security conditions prevent field teams from entering production areas, the farms that are hardest to verify may be excluded from EU-linked procurement regardless of their actual deforestation status.
The same is true of informal purchasing. Mobile buyers provide liquidity and access in remote communities. Removing them abruptly may disrupt farmer sales. Keeping them without digital transaction controls preserves the origin gap.
The operational solution is not simply to ban intermediaries. It is to register them, record purchases at the first point of aggregation, reconcile quantities and make them accountable within the traceability system.
7.4 Forest monitoring remains incomplete
The technical assessment identified limitations in national forest monitoring and uncertainty around some forest definitions and land-status information. (Sources: S12)
This weakens both deforestation and legality assessment. A buyer can receive accurate farm coordinates but still lack an authoritative basis for deciding whether the farm is inside a restricted area or whether an alert reflects cocoa expansion, agroforestry or another land-cover change.
Assessment
Cameroon has fragmented readiness. Some exporter-linked chains may be advanced, but national capability is not demonstrated. The missing disclosure is not another headline mapping percentage, but active suppliers, transaction-linked tonnes, controlled warehouse volume and shipment-linked exports.
8. Nigeria: private compliant islands inside a first-mile market
Nigeria supplied 13.2% of direct EU bean imports in calendar 2025. Its pre-crisis share was only 8.8%, rising to 14.9% during 2023/24 and remaining at 13.4% in 2024/25. Nigeria is therefore both an EUDR readiness case and one of the principal origins through which European buyers substituted for constrained Ivorian and Ghanaian supply. Approximately 72% of its calendar-year 2025 EU-bound volume entered through the Netherlands.
The country's cocoa market is structurally different from Ghana's. An EU-supported value-chain assessment estimated that local buying agents purchase about 80% of available cocoa, while cooperatives account for about 20%. The agents are close to farmers, provide finance and inputs, and sell onward to exporters and processors. (Sources: S15)
This commercial structure makes the first-mile intermediary central to EUDR readiness.
8.1 The national architecture is still incomplete
The National Cocoa Management Committee has called for a consolidated database covering farms, farmers, processors, exporters, intermediaries and government agencies. The EU-supported assessment found that information on traceability, certification, forest maps, legality and due diligence remained scattered. It also reported a need to update national forest and crop maps and noted that private firms were developing their own systems, with data generally retained for company use. (Sources: S15) This creates private capability without national interoperability.
A large exporter may know its suppliers. A smaller exporter buying through local agents may not have access to the same farm data. A farmer may be mapped in one private system but invisible to another buyer. Moving to a different buyer may therefore mean losing access to the EU-linked channel.
8.2 Exporter-controlled lanes are materially more advanced
Some major Nigerian exporters have invested heavily in mapping, field staff and verification. Sunbeth reported mapping 124,000 hectares connected to about 60,000 tonnes of cocoa and estimated costs of $30 to $70 per tonne; Starlink Global and Ideal reported $40 to $80 per tonne. Industry experts cited by Reuters estimated that farmers producing more than half of Nigerian cocoa could initially struggle to meet the requirements. (Sources: S16)
The figures are company-specific, but they show that strong private lanes can be built at material cost without automatically including the wider market.
8.3 The local buying agent is both the problem and part of the solution
Local buying agents aggregate cocoa from many farms, but they are also embedded in rural financing and market access. A realistic EUDR strategy must therefore integrate them rather than simply bypass them, using registered identities, farmer validation at purchase, dated quantity records, lot assignment before aggregation, production-plausibility checks and controls against unregistered cocoa entering approved stocks.
Removing agents may create cleaner direct chains for a limited group of exporters while excluding farmers who depend on them for credit and market access.
8.4 Protected-area legality is commercially material
The EU-supported assessment reported stakeholder concern that a material portion of Nigerian cocoa production was associated with protected forest areas that had been converted to agriculture, while official forest maps required updating. The report should be read as a preparedness assessment, not a definitive legal classification of individual farms. It nevertheless shows that the legality problem is not theoretical. (Sources: S15)
Where cultivation has occurred for decades on land still classified as protected, geolocation can expose a conflict that mapping alone cannot resolve. The answer depends on national law, authoritative boundaries and any lawful regularisation process.
Assessment
Nigeria has fragmented national readiness with stronger exporter-controlled lanes. The likely early outcome is selective access: organised suppliers remain in EU-linked channels while farmers dependent on incompatible smaller-buyer systems risk diversion.
9. Ecuador and Peru: credible programmes, incomplete conversion into national volume
Latin American cocoa supply chains differ from West Africa, but they face the same evidentiary test. Registration and training must become transaction-linked, physically controlled export volume.
9.1 Ecuador: broad institutional preparation without a published national funnel
Ecuador has built a multi-agency framework involving agriculture, environment, labour, tax and land legality functions. The “Mi finca, mi huella” campaign aims to register more than 100,000 cocoa and coffee producers in the Agrocalidad GUIA system. Registration includes producer identity, crop information, address and farm polygon, with access to deforestation reports and land-use mapping. The target combines cocoa and coffee, so it cannot be treated as a cocoa-only coverage figure. (Sources: S17)
A training-of-trainers programme has reached more than 2,000 people across nine provinces, including technical staff from collection centres, exporters, associations and cooperatives. The modules include EUDR, traceability, georeferencing and the GUIA system. (Sources: S18)
The missing evidence is commercial rather than educational: cocoa-specific registrations, active EU suppliers, purchases linked to polygons, controlled collection-centre volume and real shipments producing complete importer evidence. Ecuador's institutional design is a strength; its public weakness is the absence of one commercial-scale cocoa traceability funnel.
9.2 Peru: practical export evidence, but combined commodity statistics
Peru has developed national geolocation and traceability programmes covering coffee, cocoa and oil palm. MIDAGRI has reported more than 181,000 geolocated plots across these combined chains, exceeding its national target. The number demonstrates scale but does not reveal the cocoa share. (Sources: S19)
Peru has also demonstrated a real cocoa transaction. An official programme reported the export of 100 tonnes of organic cocoa with geographic traceability from San Martín to Italy. (Sources: S20)
This is stronger evidence than a training target because physical cocoa moved through the process. It remains a pilot-sized proof relative to national exports.
Organised cooperatives provide Peru with an important advantage. They can maintain member lists, internal control systems, purchase records and long-term buyer relationships. The national challenge is extending equivalent capability to independent and less formal producers, while resolving land documentation and data interoperability.
Assessment
Ecuador and Peru show substantial institutional preparation and credible pilot capability, but not national transaction-linked coverage. Ecuador's test is conversion of registration into commercial volume; Peru's is scaling cooperative capability while separating cocoa-specific evidence from combined commodity statistics.
10. Secondary origins: collectively large, publicly opaque
Origins outside the six main country chapters supplied approximately 140,000 tonnes of direct EU beans in 2025, a volume close to Ghana's total. They include Guinea, the Dominican Republic, Togo, Liberia, Sierra Leone, Uganda, the Democratic Republic of the Congo, Madagascar, São Tomé and Príncipe and several smaller origins.
Some appear highly dependent on the EU. CocoaIntel's directional mirror analysis suggests that the EU received approximately 96% of Sierra Leone's globally reported bean exports, 77% of Togo's, 60% of Liberia's and 53% of Guinea's in 2025. These ratios are affected by reporting and transit differences but indicate material exposure.
The group also spans different EUDR risk classifications. The Dominican Republic, Togo, Madagascar and São Tomé and Príncipe are low risk, while Guinea, Liberia, Sierra Leone, Uganda and the Democratic Republic of the Congo are standard risk. (Sources: S04)
Public evidence is much thinner than for Ghana or Côte d'Ivoire and often consists of project announcements, certification coverage or mapping campaigns rather than shipment-linked commercial volume. The correct rating for many of these origins is therefore insufficient public evidence, not “unprepared.” Their smaller scale may also raise the per-tonne burden of fixed traceability and audit costs.
11. Are European buyer countries operationally ready?
Buyer-country readiness has four layers:
1. designation and capability of the competent authority;
2. customs integration and consignment-control procedures;
3. company due-diligence systems;
4. physical controls in warehouses and processing facilities.
Most public evidence is strongest in the first two layers. The third and fourth are less visible because companies do not normally publish system failure rates, stock-control tests or rejected shipments.
Buyer-country scorecard
|
Country |
Share of direct EU bean imports |
Institutional evidence |
Public operational evidence |
Assessment |
|
Netherlands |
52.6% |
Strong |
Trial inspections disclosed |
Most advanced and
transparent, but company readiness remains uneven |
|
France |
10.2% |
Clear authority and customs
framework |
Limited cocoa-specific
disclosure |
Institutionally
established, commercial proof limited |
|
Germany |
9.1% |
Competent authority,
guidance and training |
Limited published dry-run
results |
Institutionally
established, company readiness not publicly measurable |
|
Belgium |
7.8% |
Competent authority and
gateway procedures |
Limited company and
warehouse disclosure |
Established gateway
structure, operational transparency limited |
|
Spain |
7.5% |
National portal, system
training and implementation work |
Limited cocoa-specific
testing evidence |
Material preparation, lower
public confidence |
|
Italy |
7.3% |
Cocoa authority designated
within ICQRF |
Limited cocoa-specific
testing evidence |
Strong inspection base,
lower public operational visibility |
11.1 Netherlands: the best evidence is also a warning
The Dutch Food and Consumer Product Safety Authority conducted voluntary trial inspections with companies that were already relatively advanced in their EUDR preparation.
The authority found that many companies had collected substantial information without fully assessing the identified risks or linking them to mitigation measures. It found that software platforms can support due diligence but cannot replace company judgment, and that certification does not replace due diligence. Systems worked better when integrated with procurement, sales and inventory administration. The authority also highlighted processing-site risks, input-output reconciliation and the need to prove that the physical product placed on the market is the same product connected to the approved origin. (Sources: S21)
This is the strongest public evidence of buyer readiness because it shows actual weaknesses rather than only planned procedures.
The participating companies volunteered and were comparatively advanced. It is therefore reasonable to infer that average readiness across the broader market is unlikely to be stronger. This is an inference, not a measured EU-wide result.
The Netherlands remains best placed institutionally because it has combined guidance, trial inspection and future enforcement planning. It should not be described as universally ready. More than half of EU bean imports pass through it, and 75.2% of Dutch volume came from four West African origins. Any failure in data integration or warehouse control would therefore have Union-wide consequences. The NVWA has confirmed that inspections will begin when the regulation applies. (Sources: S22)
11.2 Germany: administrative preparation without public cocoa stress tests
Germany's Federal Office for Agriculture and Food is the central EUDR implementation authority and maintains guidance, updates and practical training for companies. In August 2026 it announced additional seminars focused on control preparation and software providers. (Sources: S23)
Germany is institutionally active, but public cocoa-specific stress-test evidence comparable to the Dutch trial inspections is not available. Côte d'Ivoire supplied 58.4% of direct German bean imports, making Germany especially exposed to the Ivorian rollout. The defensible assessment is institutionally established, operationally insufficiently disclosed.
11.3 France: clear rules, concentrated origin dependence
France has designated a joint competent-authority structure and published detailed guidance on operator roles, due diligence, country classification, checks and customs declarations. The DDS reference must be available before customs release and entered through the relevant declaration code. (Sources: S24)
France received 70% of its direct beans from Côte d'Ivoire and Ghana. This creates a concentrated but potentially manageable supplier structure.
The public gap is commercial testing: completed cocoa dry runs, rejection rates, warehouse segregation and integration with procurement and stock systems. France appears institutionally ready, while company and physical-chain readiness remain not publicly measurable at national level.
11.4 Belgium: gateway readiness depends on stock control
Belgium's federal authority has published current EUDR information and identified the national implementation structure. (Sources: S25)
Its commercial role is not limited to domestic consumption. Belgium is a major import, warehousing and onward-trade gateway. That makes stock attribution and cross-border information transfer central.
A Belgian importer may place beans on the EU market and then sell them to a processor in another Member State. The initial operator retains the core upstream due-diligence responsibility under the revised model, while reference and supplier information must remain available downstream according to the applicable role. (Sources: S08; S30)
The key operational questions are:
- can Belgian warehouse stocks be tied to the correct DDS references;
- can approved and non-approved cocoa be physically separated;
- can a competent authority reconstruct onward movements;
- and can downstream users identify the operator responsible for the original placement? Public evidence of these cocoa-specific tests is limited.
11.5 Spain: system preparation is visible, enforcement completion less so
Spain maintains an extensive official EUDR portal covering the timetable, operator duties and the EU
Information System. It has published tutorials and distinguishes correctly between submitting a declaration and performing the underlying due diligence. Spain also began national legislative work to establish the implementation, control, coordination and sanction structure. (Sources: S26)
Spain imported approximately 100,000 tonnes of beans directly from outside the EU, with material exposure to Côte d'Ivoire, Ecuador, Cameroon and Peru.
The public record demonstrates preparation and training, but not cocoa-specific trial-inspection evidence comparable to the Netherlands.
11.6 Italy: an experienced agri-food authority, limited public cocoa testing
Italy designated the Central Inspectorate for Quality Protection and Fraud Repression, ICQRF, as the competent authority for cocoa and the other non-wood agricultural commodities covered by the regulation. ICQRF has 29 territorial offices and an established agri-food control network. (Sources: S27)
That is an institutional advantage. Italy also has a diversified bean-origin profile across Côte d'Ivoire, Ecuador, Peru, Ghana, Nigeria and Uganda. Public evidence on cocoa-specific importer dry runs, warehouse tests and processor reconciliation remains limited, so operational readiness is not sufficiently disclosed.
12. How traceability can fail even when every farm is mapped
The most important reality is that digital traceability can be formally complete and physically false.
The following are structural failure routes. They are not allegations that a particular actor is using them.
|
Failure route |
What the digital record may show |
What may have happened physically |
Control required |
|
Borrowed identity |
Registered farmer sold the
cocoa |
Neighbour or unregistered
farmer supplied it |
Seller authentication and
farm-level transaction record |
|
Polygon substitution |
Cocoa linked to a valid
mapped plot |
Cocoa produced on another
plot |
Field verification,
production plausibility and supplier history |
|
Cooperative leakage |
Cocoa attributed to members |
Cooperative purchased from
non-members |
Member validation at intake
and lot separation |
|
Intermediary aggregation |
One transaction recorded at
delivery |
Several origins were mixed
before recording |
Purchase capture at first
aggregation point |
|
Yield inflation |
Declared volume supported
by mapped area |
Quantity exceeds plausible
production |
Yield and carry-over checks |
|
Duplicate registration |
Same farm appears in
several systems |
Several buyers claim the
same production capacity |
Interoperable identifiers
and duplicate detection |
|
Cross-border relabelling |
Cocoa declared from a
preferred origin |
Beans entered from a
neighbouring country |
Border controls, quantity
balances and origin-risk analytics |
|
Warehouse contamination |
Approved lot recorded
correctly |
Unknown cocoa entered the
same stock |
Controlled intake,
segregation and inventory reconciliation |
|
Retrospective data
attachment |
Export lot has complete
polygons |
Polygons were assigned
after aggregation |
Timestamped transaction
chain and audit log |
|
Processed-product opacity |
Immediate supplier country
is known |
Raw cocoa came from several
hidden origins |
Upstream ingredient-origin
disclosure |
|
Alert closure without
investigation |
Satellite risk marked
resolved |
No reliable field check
occurred |
Documented alert protocol
and independent review |
|
False exclusion |
Farm flagged as risky |
Mapping or satellite
interpretation was wrong |
Appeal, correction and
remediation process |
12.1 Quantity reconciliation is the missing fraud control
The strongest way to test whether traceability is physically plausible is to reconcile quantities. For each farm or producer group, the system should estimate:
- mapped productive area;
- expected yield range;
- current production stage and tree age;
- sales already recorded to other buyers;
- carry-over stocks where applicable;
- and total quantity declared during the season.
An operator should not assume that a valid polygon can support unlimited volume. At warehouse and processor level, the same principle applies:
- opening approved stock;
- plus approved incoming lots;
- minus rejected, lost or transferred quantities;
- should reconcile with approved closing stock and outputs.
A large unexplained surplus is not a clerical detail. It may indicate unknown-origin cocoa entering the compliant pool.
The 20 August Reuters reporting from Côte d'Ivoire shows why this control is not theoretical. Industry sources said protected-area cocoa can enter export flows and mix with legally produced beans partly because individual farmer output is estimated rather than precisely measured. A system can therefore possess valid cards, polygons and purchase records yet remain vulnerable if declared quantities are not reconciled against plausible farm production and warehouse balances. (Source: S34)
12.2 Cross-border cocoa is a foreseeable circumvention risk
Ghana's low-risk classification and neighbouring standard-risk classifications create different procedural burdens. Producer prices and buying conditions also vary across borders.
Where commercial incentives favour one origin, cocoa may move across a porous border and enter another country's purchasing system. The regulation expressly requires operators to consider circumvention and mixing risk. (Sources: S05)
A credible system should therefore compare:
- declared purchases with regional production estimates;
- sudden volume growth in border districts;
- supplier histories;
- transport routes;
- and inconsistencies between national export volume and plausible crop availability.
12.3 Data quality is a governance problem
A polygon can be inaccurate because of weak GPS reception, poor surveying, operator error, overlapping farms or intentional manipulation.
The critical governance questions are:
- Who may create or edit a farm record?
- Is every change timestamped?
- Can a farmer inspect and challenge the record?
- Who resolves overlaps?
- Can an exporter correct a national record?
- Does the original version remain visible for audit?
- Can a farm be transferred to a new operator without losing its history? Readiness requires a correction system, not only a collection system.
13. The political economy of readiness
Readiness is shaped not only by technology and law, but by the incentives of the actors producing the evidence.
Producer-country governments
Governments need to preserve access to a high-value market, giving them strong incentives to accelerate registration and communicate high coverage. The response should not be automatic distrust, but transparent denominators, definitions and independent testing.
Exporters
Exporters need reliable suppliers and market access while treating supplier lists, farm data and procurement volumes as commercially sensitive. Private systems can therefore be more advanced than public evidence suggests while remaining inaccessible to smaller competitors. This raises a competition question: does traceability become shared infrastructure or a proprietary barrier to entry?
Cooperatives
Cooperatives are well placed to maintain member records and first-mile traceability, but they also need volume to cover fixed costs and fulfil contracts. A credible system must therefore make purchases from non-members or neighbouring communities visible rather than simply prohibiting them on paper.
First-mile intermediaries
Intermediaries aggregate low volumes, provide finance and connect remote farmers to exporters. Excluding them can improve formal traceability in selected lanes while damaging rural liquidity. Integrating them requires incentives, training and enforceable transaction controls.
Technology providers and certification schemes
Platforms and certifications can improve data collection, screening and audit, but they cannot replace the operator's assessment or physical controls, as the Dutch trial inspections demonstrated. (Sources: S21)
Competent authorities
Authorities must prioritise checks across seven commodities, many products and thousands of operators. Effective enforcement therefore requires risk models capable of identifying implausible quantities, repeated polygons, risky intermediaries and unusual trade patterns rather than relying only on random document checks.
The distribution of compliance cost and the resulting incentives for European buyers and farmers are addressed separately in Section 14.
14. Who pays, and who is excluded?
EUDR implementation costs extend well beyond satellite screening. They include farmer identification, surveying and polygon correction, digital purchase and lot controls, field investigation, legality research, training, audit, data integration, warehouse segregation and remediation.
Nigerian exporters reported programme costs of $30 to $80 per tonne. Applied mechanically to the EU's 1.328 million tonnes of direct bean imports, that range would equal roughly $40 million to $106 million. This is an illustration, not an estimate of total EU compliance cost, because existing systems, fixed investments, origin differences, processed-product requirements and downstream costs vary materially. (Sources: S16)
14.1 The commercial allocation problem
The cost can ultimately sit with farmers, cooperatives, exporters, traders, processors, manufacturers, retailers, consumers, producer-country governments or development finance. In practice, bargaining power determines the allocation. Large buyers can change suppliers more easily than smallholders can change the regulatory destination of their crop, so weak cost-sharing mechanisms risk pushing the burden toward the producer end of the chain.
14.2 The exclusion paradox
A farmer can lose EU access because the farm presents a real deforestation or legality risk, or because the farm is simply difficult or expensive to document. Those outcomes are not equivalent.
A genuinely deforestation-free farmer may be excluded because the farm is remote, the record is wrong, the local buyer is not integrated or acceptable documents are missing. Another farmer may remain inside the market because a sophisticated chain can produce a complete digital file even where physical verification is weak.
|
Will implementation
reward actual environmental performance, or primarily the ability to produce
acceptable documentation? |
A credible system needs remediation before exclusion. The Commission identifies supplier support, including capacity building and investment for smallholders, as a possible risk-mitigation measure. (Sources: S03) Minimum protections should include notice of rejection, access to the farm record, correction of polygon errors, field investigation of disputed alerts, a defined remediation period and a route back into the approved supply chain.
15. Processed cocoa hides the agricultural origin
The direct bean trade is the most visible part of EU exposure. Processed cocoa is harder.
In 2025, the EU directly imported approximately 377,000 tonnes of cocoa paste, 247,000 tonnes of cocoa butter, 66,000 tonnes of cocoa powder and 333,000 tonnes of chocolate and cocoa-containing preparations.
For these products, the customs partner may be a processing country rather than a cocoa-producing country.
CocoaIntel's data show:
- Switzerland supplied 11.3% of EU imports of non-defatted cocoa paste, 7.1% of cocoa butter and 20.3% of cocoa powder;
- the United Kingdom and Switzerland were major suppliers across several chocolate categories.
The Commission's 2026 staff analysis makes the same conceptual point. Raw commodities are often traded and processed in another country, so the country of production of the agricultural commodity can diverge from the origin of the derived product. It uses Swiss chocolate containing Ivorian and Ghanaian cocoa as an illustrative example. (Sources: S09)
15.1 The evidence chain becomes longer
An EU importer of cocoa butter from a non-producing processor may need evidence transmitted through:
|
farm → first buyer →
exporter → bean importer or processor → grinding batch → butter lot → non-EU
exporter → EU operator |
The immediate supplier may provide high-quality documentation. The EU operator still needs confidence in the underlying cocoa origin and chain of custody.
15.2 Customs data cannot reveal embedded farm exposure
Public customs data can identify the country from which the processed product arrived. They generally cannot identify:
- the producing countries embedded in that product;
- the proportions of each origin;
- the contributing plots;
- or whether the processor used controlled pooling.
This means that direct bean-import analysis understates total producer-country exposure and cannot produce a complete EUDR risk map for chocolate and semi-finished cocoa.
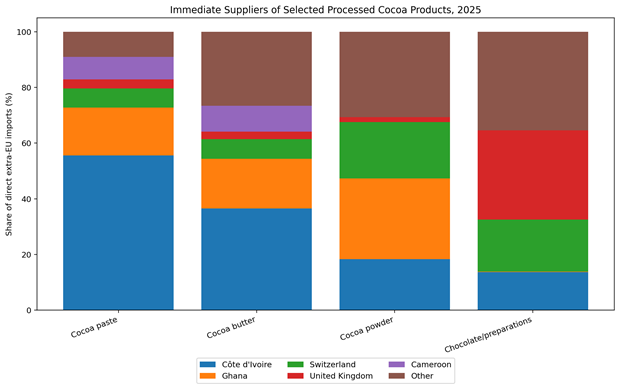
Immediate suppliers of selected processed cocoa products, 2025
The only reliable solution is commercial data transmission from the upstream operator and processor.
16. The likely market outcome: documentable cocoa becomes a commercial attribute
The EUDR does not formally create a new cocoa grade, but the market is likely to price the ability to demonstrate compliance.
16.1 Premium or discount
Documentable cocoa may gain value through an explicit EUDR premium, stronger origin differential, preferred-supplier access, lower rejection risk or longer-term contracts. The same effect may appear on the other side of the market as a discount for cocoa that cannot enter EU-linked channels. The spread will depend on scarcity, buyer urgency and the availability of alternative destinations.
Origins with high EU dependence and weak documentation are most exposed to diversion toward the United States, Asia, the Middle East, the United Kingdom or regional processors.
16.2 Large exporters gain structural advantage
Large exporters can spread mapping, software, audit and warehouse costs across more tonnes and maintain dedicated procurement and compliance teams. Smaller exporters face a higher cost per tonne and may depend on data held by competitors or governments. Without neutral national infrastructure, EUDR can accelerate concentration in the export market.
16.3 Port choice may become a risk-management decision
The regulation is common across the EU, but inspections are conducted by national authorities. Differences in guidance, system maturity, processing speed or enforcement practice may affect how companies perceive ports during the initial implementation period. There is not yet enough evidence to conclude that material port diversion will occur, so this should be monitored through entry-country shares, customs delays and unusual routing.
17. Three scenarios for 2027
Scenario 1: Managed segmentation
This is the central scenario. Ghana and Côte d'Ivoire provide usable national data for a large share of direct supply, while leading exporters create controlled lanes in Nigeria, Cameroon, Ecuador and Peru. Major EU buyers restrict procurement to approved suppliers and reserve compliant warehouse capacity.
The EU remains supplied, but the physical market divides between documentable and weakly documented cocoa. Likely effects include moderate traceability premiums, tighter approved-supplier lists, temporary customs and data corrections, diversion of weaker-documented cocoa and greater exporter concentration.
Scenario 2: Material origin bottlenecks
National systems function but cover less commercial volume than buyers require. Triggers could include slower Ivorian transaction adoption, unresolved indirect sourcing, data-access failures in Ghana, incomplete first-mile coverage in Cameroon and Nigeria, high rates of polygon or legality alerts, or insufficient controlled warehouse capacity.
The result would be stronger premiums for accepted cocoa, delayed purchases from smaller suppliers, greater diversion and competition for direct chains, with pressure on individual grinding plants even if global bean supply remains adequate.
Scenario 3: Acute implementation disruption
The severe scenario requires several failures at once: producer systems cannot generate usable files, EU digital infrastructure becomes materially unstable, authorities apply inconsistent interpretations, physical mixing prevents separation, transitional stocks are insufficient or companies cannot correct errors quickly.
Possible effects include shipment holds, contract disputes, sharp premiums, grinding-schedule disruption, accelerated non-EU diversion and urgent renegotiation of cost and liability clauses.
Advanced systems make a complete breakdown less likely than managed segmentation, but the concentration of EU cocoa supply means the severe scenario cannot be dismissed.
18. Final judgment
The cocoa sector has built substantial EUDR infrastructure, but the public evidence remains strongest for registration, mapping and system design and weakest for the physical stages that determine whether an actual shipment can be defended: first-mile transaction capture, quantity plausibility, warehouse control, shipment allocation, legality evidence and independent testing.
The market is therefore approaching implementation with three broad categories of cocoa: supply already inside strong and controlled chains; supply that can become documentable with additional work; and supply whose physical origin or legality cannot yet be demonstrated under current commercial practices. The first should preserve EU access. The second will determine whether the transition is orderly. The third is most exposed to diversion or exclusion.
Are producer countries prepared? Some national and private systems are advanced enough to support substantial volume, but no major origin has publicly demonstrated complete national plot-to-shipment coverage under commercial conditions.
Are European buyer countries prepared? The institutional framework is broadly in place, while public evidence of company risk assessment, system integration and physical-chain control remains uneven.
Will the EU obtain cocoa? Probably yes. The harder questions are which cocoa, from which suppliers, at what premium and with how many farmers left outside the accepted chain.
The first enforcement year will therefore test more than whether farms appear on a map. It will test whether the cocoa in a warehouse, shipment or processed product can be connected to reliable evidence without a break in the commercial chain.
That is the difference between mapped cocoa and defensible cocoa.
Source register
S01. European Commission, DG Environment. Regulation on Deforestation-free Products. Source link
S02. European Commission. Frequently Asked Questions on the EUDR, fifth iteration, May 2026. Source link
S03. European Commission, Green Forum. Understand Due Diligence. Source link
S04. European Commission, Green Forum. Country Classification Lis. Source link
S05. European Commission, Green Forum. Countries and Partnerships. Source link
S06. European Commission, DG Environment. Commission updates product scope and digital tools to support implementation of EUDR, 13 July 2026. Source link
S07. European Commission. Guidance Document for the Regulation on Deforestation-Free Products, May 2026. Source link
S08. European Commission. Report to the European Parliament and Council on the EUDR, 2026. Source link
S09. European Commission. Staff Working Paper on the 2026 product-scope review, 2026. Source link
S10. European Forest Institute, Cocoa Insight. Preparedness check of Ghana for the EU Deforestation Regulation, March 2025, published 2026. Source link
S11. European Forest Institute, Cocoa Insight. Preparedness check of Côte d'Ivoire for the EU Deforestation Regulation, 2025, published 2026. Source link
S12. European Forest Institute, Cocoa Insight. Preparedness check of Cameroon for the EU Deforestation Regulation, April 2025, published 2026. Source link
S13. Agence Ivoirienne de Presse. Côte d'Ivoire launches the national traceability system and makes the producer card mandatory, 12 June 2026. Source link
S14. Trase. Côte d'Ivoire cocoa exports and deforestation, 12 May 2026. Source link
S15. European Union External Action Service. Nigeria: Mapping of cocoa and other value chains for EUDR preparedness, 2024. Source link
S16. Reuters. West Africa cocoa sector struggles to meet EU anti-deforestation rules, raising supply concerns, 17 August 2026. Source link
S17. Agrocalidad. Ecuador will register more than 100,000 cocoa and coffee producers to support deforestation-free exports, 2025. Source link
S18. Agrocalidad. More than 2,000 people in nine provinces trained in traceability and EUDR, 2025. Source link
S19. MIDAGRI. MIDAGRI strengthens traceability and exceeds the national geolocation target under the EUDR, 26 March 2026. Source link
S20. MIDAGRI / Agromercado. San Martín producers export 100 tonnes of geographically traceable cocoa to Europe, 14 May 2025. Source link
S21. NVWA. Useful insights from trial inspections for the EUDR, 21 August 2025, updated December 2025. Source link
S22. NVWA. EUDR Deforestation Regulation. Source link
S23. Federal Office for Agriculture and Food (BLE). Deforestation-free products: supply chains. Source link
S24. French Ministry for Ecological Transition. The European Deforestation-free Regulation, 13 July 2026. Source link
S25. FPS Public Health. Regulation on deforestation-free products (EUDR), 5 May 2026. Source link
S26. MITECO. EUDR implementation portal. Source link
S27. MASAF. ICQRF as the competent authority for Regulation (EU) 2023/1115. Source link
S28. World Bank, World Integrated Trade Solution (WITS). Monthly cocoa trade-flow data supplied by the researcher after download from worldbank.org, data through July 2026. Source link
S29. EUR-Lex. Consolidated Regulation (EU) 2023/1115, consolidated through 26 December 2025. Source link
S30. European Commission, Green Forum. Roles and Responsibilities under the EUDR. Source link
S31. World Bank, World Integrated Trade Solution (WITS). About WITS. Source link
S32. International Cocoa Organization. May 2026 Quarterly Bulletin of Cocoa Statistics, 29 May 2026. Source link
S33. International Cocoa Organization. Cocoa Market Review, November 2024, November 2024. Source link
S34. Reuters. Ivory Coast says ready for EU cocoa rules as exporters warn of delays, 20 August 2026. Source link
Research disclosure
Producer: Georgi Uzunov
Research type: Independent desk-based regulatory and market analysis
Research cutoff: 20 August 2026
Regulatory sources: Official European Commission and official EU material
Readiness sources: Public government, regulator, EU-funded technical, competent-authority, company and selected independent material
Trade analysis: CocoaIntel calculations using World Bank WITS trade data
Readiness ratings: Analytical assessments of publicly demonstrated enabling capacity, not legal determinations
Investment disclosure: This report is informational and does not constitute investment advice
Forward-looking statements: Market scenarios are analytical judgments and may not occur as described
Corrections policy: Material factual corrections should be recorded with the publication date, the original wording and the revised wording.