
Cocoa in the Age of Financialisation: Why Fundamentals Alone No Longer Explain Price

How a historic cocoa deficit collided with record speculative positioning and collapsing liquidity to produce one of the largest commodity rallies of modern times.
Unless otherwise stated, all prices in this article refer to ICE US cocoa futures and are expressed in U.S. dollars per tonne.
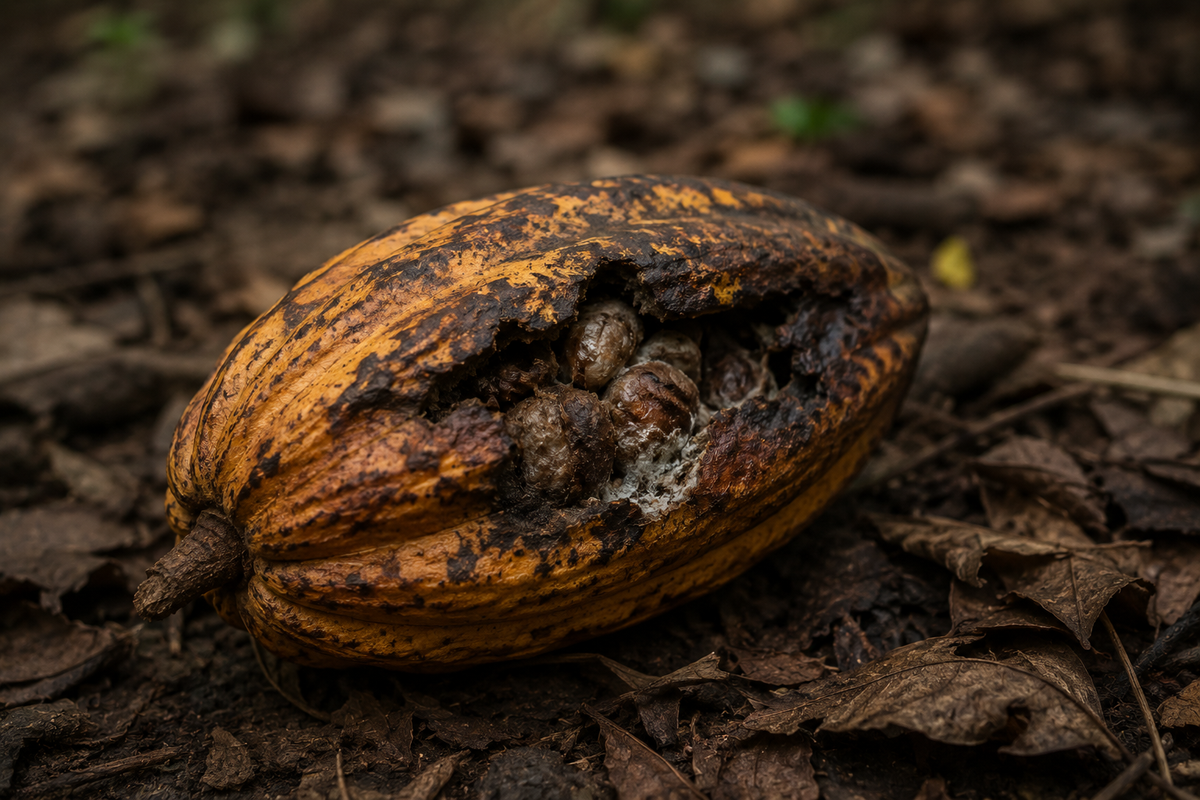
The cocoa rally of 2023–2024 was one of the most extraordinary commodity market events of modern times. ICE US cocoa futures rose from approximately US$2,700 per tonne in early 2023 to nearly US$13,000 per tonne in 2024, making cocoa one of the best-performing major commodities in the world. For many observers, the explanation appeared straightforward. Production in Côte d'Ivoire and Ghana, which together account for roughly two-thirds of global cocoa supply, declined sharply due to adverse weather, disease pressure and years of structural underinvestment. At the same time, demand remained more resilient than many expected. The result was one of the largest cocoa deficits recorded in decades.
This explanation is correct. Yet it is also incomplete.
The deficit explains why cocoa prices should have risen. It does not fully explain why prices increased by more than 300% within little more than a year. To understand the scale and speed of the rally, it is necessary to examine not only agricultural fundamentals but also speculative positioning, market liquidity, trend-following capital and the increasing financialisation of commodity markets. The cocoa market has increasingly become a hybrid system in which physical fundamentals determine direction, while financial flows influence magnitude and volatility. The events of 2023–2024 provide perhaps the clearest example of this phenomenon.
There is little doubt that the market entered 2023 in a fundamentally bullish position. Production forecasts across West Africa deteriorated steadily as weather conditions became increasingly unfavourable and concerns about crop disease intensified. Years of underinvestment had already weakened the productive capacity of many cocoa-growing regions, leaving the market vulnerable to shocks. As crop estimates were revised lower, the global balance sheet tightened rapidly. According to ICCO estimates, the market moved into one of the largest deficits recorded in recent decades. Initial forecasts projected a deficit of approximately 320,000 tonnes, but subsequent revisions increased the estimate to more than 460,000 tonnes as the severity of the crop shortfall became clearer.
The tightening balance sheet was reflected most clearly in global inventories. As production declined and demand remained relatively resilient, cocoa stocks were drawn down at an unusually rapid pace. Within two seasons, global inventories fell by more than half a million tonnes while the stocks-to-grindings ratio collapsed from nearly 37% to below 28%. According to ICCO, this represented the lowest stocks-to-grindings ratio in approximately forty-five years.
Global Cocoa Stocks and Stocks-to-Grindings Ratio
| Season | Grindings (Mt) | Ending Stocks (Mt) | Stocks-to-Grindings |
|---|---|---|---|
| 2021/22 | 4.99 | 1.84 | 36.9% |
| 2022/23 | 5.00 | 1.74 | 34.9% |
| 2023/24 | 4.75 | 1.32 | 27.9% |
| 2024/25* | 4.60 | 1.32 | 28.8% |
ICCO estimate.
These figures leave little room for doubt that the cocoa market was experiencing genuine scarcity. Inventories were not merely tight; they were historically tight. The market had far less capacity to absorb additional supply shocks than at any point during much of the previous two decades. Yet while this explains why cocoa became increasingly vulnerable, it does not fully explain why prices increased by more than 300%. Commodity markets have experienced deficits, inventory drawdowns and political disruptions before. Few have produced a comparable price response.
A historical comparison makes this point particularly clear. Cocoa has experienced several periods of severe market stress during the last two decades, including the 2007–2008 commodity boom, the 2010–2011 Ivory Coast political crisis, the supply-driven rally of 2015–2016 and the broad commodity recovery following the COVID-19 pandemic. Each of these events generated significant price appreciation. None, however, approached the scale of the 2023–2024 rally.
Historical Comparison of Major Cocoa Market Stress Events
| Period | Fundamental Trigger | Start Price (US$/t) | Peak Price (US$/t) | Price Change | Max Noncommercial Net Position |
|---|---|---|---|---|---|
| 2007–2008 Commodity Boom | Commodity inflation cycle | ~1,800 | ~3,300 | +80% | +58,827 |
| 2010–2011 Ivory Coast Crisis | Political disruption | ~2,700 | ~3,750 | +39% | +30,614 |
| 2015–2016 Tight Market | Supply concerns | ~2,300 | ~3,340 | +45% | +59,319 |
| 2020 Commodity Recovery | Macro liquidity | ~2,100 | ~2,800 | +33% | +84,066 |
| 2023–2024 Cocoa Crisis | Crop failure and low stocks | ~2,700 | ~12,900 | +378% | +88,262 |
The comparison is striking. Previous cocoa crises generally produced rallies between 30% and 80%, even when accompanied by significant supply disruptions. The Ivory Coast crisis of 2010–2011 represented one of the most serious threats to global cocoa supply in modern history, yet prices increased by less than 40% from the onset of the crisis to the market peak. By contrast, the 2023–2024 rally generated gains approaching 400% while speculative positioning reached record levels. The difference in price response is simply too large to ignore.
The explanation becomes clearer when the behaviour of financial participants is examined alongside the physical market. As cocoa prices began to rise in response to tightening fundamentals, the market increasingly attracted speculative capital. Hedge funds, commodity trading advisors (CTAs) and systematic trend-following strategies expanded long exposure as momentum strengthened. Commercial participants faced mounting pressure while quantitative strategies continued to add exposure to an already bullish market. A self-reinforcing feedback loop emerged in which rising prices attracted additional capital, which in turn contributed to further price appreciation.
At this stage, the market was no longer responding solely to changes in physical supply and demand. Positioning itself had become a meaningful driver of price behaviour.
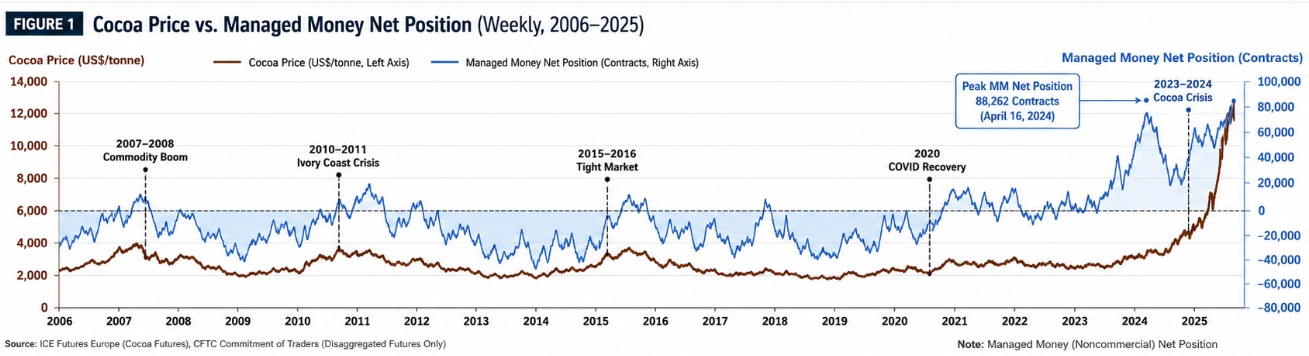
The Commitment of Traders data provides compelling evidence of this shift. During the 2023–2024 rally, noncommercial traders accumulated a net long position exceeding 88,000 contracts, the highest level observed. This was nearly three times larger than the speculative positioning observed during the Ivory Coast crisis and substantially above previous cocoa market peaks. Importantly, this does not imply that speculative traders created the deficit. The shortage was real, inventories declined sharply and the market was fundamentally tight. However, the historical comparison strongly suggests that speculative participation amplified the market's response to that shortage. Physical scarcity created the bullish narrative, but financial capital amplified its expression through price.
Perhaps the most compelling evidence emerges from the open-interest data. During the early stages of the rally, rising prices were accompanied by expanding participation. Open interest reached approximately 403,000 contracts in April 2023 while cocoa prices were still trading below US$3,000. This behaviour is consistent with a conventional bull market, in which tightening fundamentals attract new capital and encourage broader participation.
What happened afterwards was markedly different.
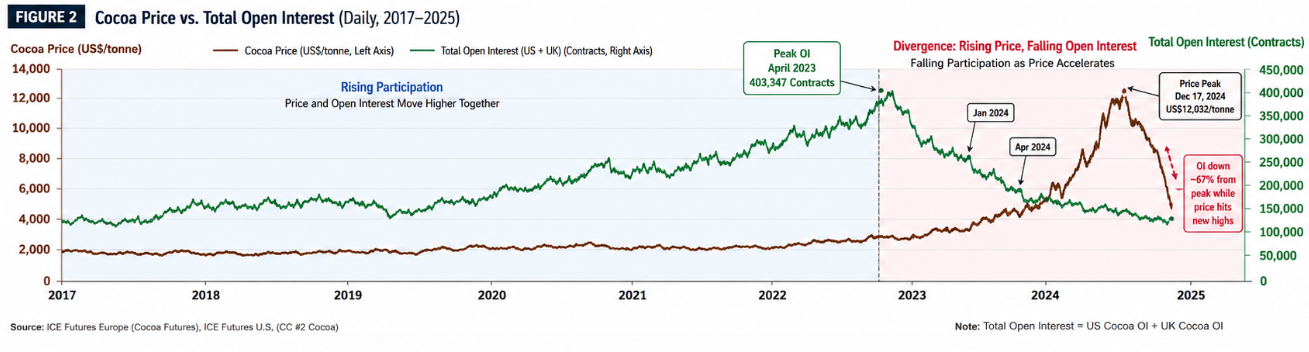
As prices accelerated higher, participation began to contract. By January 2024, open interest had already fallen substantially despite cocoa prices having almost doubled. The divergence became even more pronounced during the most explosive phase of the rally. While prices approached US$12,000 during the spring of 2024, open interest collapsed to roughly 154,000 contracts and continued declining throughout the remainder of the year. By the December price peak, participation had fallen by nearly seventy percent from its 2023 high.
This is not the profile typically associated with a broad and liquid bull market. Rather than attracting increasing participation, the market became progressively thinner as prices accelerated. Such behaviour is more commonly associated with squeeze dynamics, where liquidity withdrawal, margin pressure and forced repositioning become increasingly important drivers of price discovery. The shortage itself remained real, but the mechanism through which prices responded to that shortage appears to have changed dramatically.
Conclusion
The evidence suggests that the cocoa rally of 2023–2024 cannot be explained through a purely fundamental lens.
The underlying shortage was genuine. Production declined sharply across West Africa, inventories fell to multi-decade lows and the stocks-to-grindings ratio reached its lowest level in approximately forty-five years. These conditions justified a major repricing of cocoa and help explain why the market entered a powerful bull cycle.
Yet the historical record suggests that scarcity alone does not explain the magnitude of the move. Previous cocoa crises generated rallies measured in tens of percentage points, not hundreds. During the 2023–2024 rally, speculative positioning reached record levels while open interest collapsed by almost seventy percent from its peak. Rather than attracting broader participation as prices accelerated, the market became progressively thinner and increasingly sensitive to liquidity conditions.
The most convincing interpretation is therefore that two forces operated simultaneously. Physical scarcity determined the direction of prices, while financial participation, momentum-driven strategies and deteriorating liquidity amplified the magnitude of the move.
In that sense, the cocoa rally of 2023–2024 was not merely a shortage event. It was also a market-structure event.
As commodity markets become increasingly financialised, understanding cocoa requires analysing both the physical balance sheet and the behaviour of market participants. Neither on its own is sufficient to explain what occurred.
Sources
- International Cocoa Organization (ICCO)
- CFTC Commitment of Traders Reports
- ICE Futures U.S.
- ICE Futures Europe


