
New York Cocoa Reverses Sharply as Ivory Coast Crop Outlook Improves (27 July 2026)


New York September cocoa traded through an exceptionally volatile and strongly bearish session on Monday. After opening at 5,360, the contract initially rallied to an intraday high of 5,561, an increase of 201 points or 3.75% from the opening level. The advance failed to hold, however, as aggressive selling reversed the entire move and pushed prices below 5,400, 5,300 and 5,200 before the contract reached a session low of 5,080. This represented a decline of 481 points or 8.65% from the daily high and 280 points or 5.22% below the opening price. Prices recovered modestly during the final part of the session, but the rebound remained limited. September officially closed at 5,156, 76 points or 1.50% above the intraday low, but 204 points or 3.81% below the opening level and 405 points or 7.28% below the daily high. Compared with the 24 July close of 5,331, the contract declined by 175 points or 3.28%. The price action reflected a complete rejection of the early rally, a sharp intraday reversal and persistent selling pressure, with the contract finishing in the lower portion of its unusually wide daily range.
Ivory Coast weather improves main-crop prospects
Reuters reported that sunnier and drier conditions improved the outlook for Ivory Coast’s September-to-February main cocoa crop during the week ended 27 July. Farmers across several producing regions said soil-moisture reserves remained adequate despite rainfall falling below seasonal averages, while increased sunshine supported cherelle survival and pod development.
In Soubre, rainfall totalled 14 millimetres, around 14 millimetres below the five-year average, while Daloa received only 2.8 millimetres, approximately 16.7 millimetres below normal. Farmers in southern, eastern, central and western regions nevertheless reported a high number of developing pods and generally favourable crop conditions. Plantations are expected to benefit from continued sunshine combined with occasional light rainfall through late August or early September.
Ivory Coast cocoa arrivals remain sharply above last season
Cumulative cocoa arrivals at Ivory Coast ports reached 1.981 million tonnes by 26 July, up 22.3% from the same stage of the previous season. The comparison was based on revised last-season figures aligned with data from the Coffee and Cocoa Council.
Deliveries during the week of 20–26 July totalled approximately 12,000 tonnes, including 7,000 tonnes sent to Abidjan and 5,000 tonnes to San Pedro. This was slightly below the 13,000 tonnes delivered during the corresponding week last year.
Guan Chong expects stronger cocoa grindings in 2026
Reuters reported that Malaysian cocoa processor Guan Chong expects its grinding activity to increase in 2026 as demand recovers from last year’s slowdown. The company plans to operate its plants at approximately 90% of capacity, up from around 85% in 2025, although utilisation would remain below its normal rate of more than 95%.
Chief Executive Brandon Tay warned that the outlook could weaken in 2027. Expected El Niño conditions may reduce global cocoa production, tighten bean availability and push prices higher, potentially forcing Guan Chong to lower grinding volumes next year.
Nigeria urged to expand cocoa production
Nigerian cocoa stakeholders called for greater investment in plantation rehabilitation, improved planting materials and higher farm productivity, warning that export earnings remain vulnerable without a sustained increase in physical output. The Cocoa Association of Nigeria projected 2025/26 production at approximately 305,000 tonnes, down 11% from an estimated 344,000 tonnes in the previous season. Heavy rainfall, black pod disease, brown rot, ageing plantations and restricted access to improved planting materials were cited as the principal constraints.
Cameroon cocoa export revenue declines sharply
Cameroon’s revenue from cocoa and cocoa products fell to CFA199.3 billion in the first quarter of 2026, compared with CFA319.9 billion during the same period last year. This represented a decline of CFA120.6 billion, or 37.7%, and accounted for almost two-thirds of the country’s overall reduction in export earnings.
The report did not provide export volumes, making it impossible to determine whether the revenue decline resulted from fewer shipments, lower realised prices or a change in the balance between beans and processed products.
West African pod counts reportedly improving
Recent sunnier and drier conditions appear to have improved the survival of cherelles across several Ivorian growing regions. However, this represents stabilisation from a weak June position rather than confirmation of a fully recovered main crop.
A Reuters survey involving four pod counters and five major exporters found that more than 20% of flowers and cherelles died between May and June. Excessive rainfall caused young pods to yellow and fall, while cooler and wetter conditions increased black-pod disease pressure. Based on those late-June field assessments, Ivory Coast’s 2026/27 main crop was estimated at 1.35–1.45 million tonnes, compared with approximately 1.6 million tonnes during the current season.
The more favourable weather observed during July may slow further cherelle losses and improve pod retention, but crop development remains highly dependent on conditions through August. Farmers have stressed that flowering will continue until September and that the eventual crop size will depend on how many flowers successfully develop into cherelles and mature pods. A clearer assessment is therefore unlikely before late August.
Another concern is that the strong current mid-crop may have exhausted some trees ahead of the next main crop. Field surveys reported widespread large green pods and bean counts near 110 beans per 100 grams, compared with the more typical 130–160 range. The lower numerical bean count indicates unusually large beans, supporting the current crop, but exporters warned that the heavy pod load could reduce the trees’ ability to sustain strong production next season.
Futures performance
New York cocoa
| Contract | 24 Jul | 27 Jul | Change | Change % |
|---|---|---|---|---|
| Sep-26 | 5,331 | 5,156 | -175 | -3.28% |
| Dec-26 | 5,467 | 5,298 | -169 | -3.09% |
| Mar-27 | 5,569 | 5,395 | -174 | -3.12% |
| May-27 | 5,578 | 5,409 | -169 | -3.03% |
New York cocoa recorded a sharp and broad-based decline on 27 July, with all monitored contracts finishing more than 3% below their 24 July closing levels. September 2026 registered the largest percentage loss, falling by 175 points from 5,331 to 5,156, equivalent to a decline of 3.28%.
December 2026 dropped by 169 points to 5,298, while March 2027 declined by 174 points to 5,395. May 2027 proved marginally more resilient, although it still lost 169 points and closed at 5,409.
The session was characterised by a significant bearish reversal. September initially advanced to an intraday high of 5,561, 230 points above its previous close, before selling accelerated and pushed the contract to a low of 5,080. It subsequently recovered to close at 5,156, 76 points above the session low, but still finished within the lower portion of its exceptionally wide 481-point daily range.
A similar pattern was observed across the deferred contracts. December reached a high of 5,692 before falling to 5,223, while March traded between 5,783 and 5,319. May recorded a high of 5,789 and a low of 5,333. Each contract recovered by approximately 75 points from its intraday low, but the rebound was insufficient to reverse the strongly negative direction of the session.
The New York forward curve remained upward sloping. The December-to-September premium widened from 136 points on 24 July to 142 points, while the March-to-December premium narrowed from 102 to 97 points. The May-to-March premium increased from 9 to 14 points. The widening premium between September and December suggests that the nearby contract experienced slightly greater selling pressure than the next delivery month.
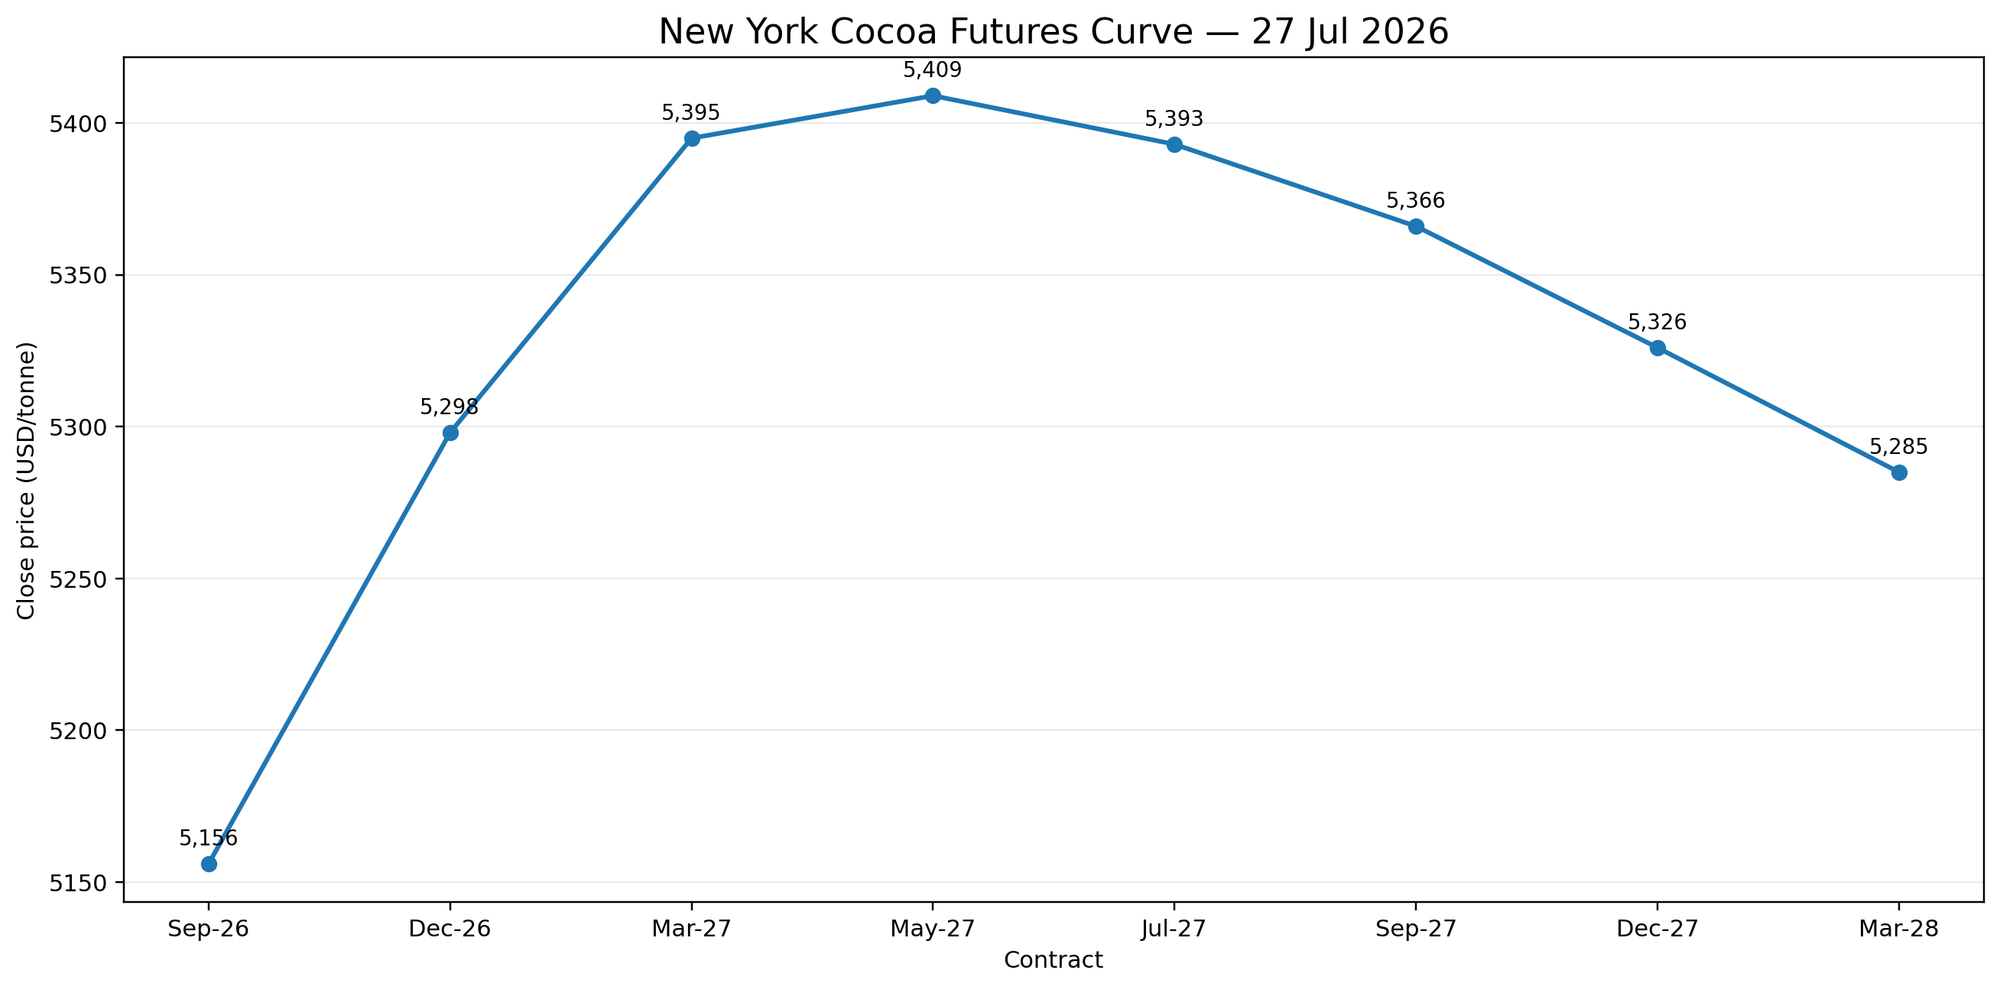
Official exchange settlements were weaker than the last-traded closing prices. September settled at 5,100, down 276 points or 5.13% from the previous settlement. December settled at 5,243, down 267 points, while March and May settled at 5,339 and 5,352, declines of 264 and 256 points respectively.
London cocoa
| Contract | 24 Jul | 27 Jul | Change | Change % |
|---|---|---|---|---|
| Sep-26 | 4,014 | 3,834 | -180 | -4.48% |
| Dec-26 | 4,081 | 3,897 | -184 | -4.51% |
| Mar-27 | 4,163 | 3,983 | -180 | -4.32% |
| May-27 | 4,171 | 3,988 | -183 | -4.39% |
London cocoa also experienced heavy selling, with losses exceeding 4% across the monitored portion of the curve. December 2026 recorded the largest absolute and percentage decline, falling by 184 points from 4,081 to 3,897, equivalent to a loss of 4.51%.
September 2026 declined by 180 points to 3,834, while March 2027 also lost 180 points and closed at 3,983. May 2027 fell by 183 points to 3,988. The consistency of the losses indicates a market-wide repricing rather than isolated weakness in a particular delivery period.
As in New York, London initially traded higher before reversing sharply. September advanced to an intraday high of 4,150 but subsequently fell to 3,824 and closed at 3,834, only 10 points above the daily low. December closed 13 points above its low, while March and May finished just 8 and 13 points above their respective lows. This exceptionally weak positioning within the daily ranges shows that selling pressure remained firmly in control into the end of the session.
The London forward curve remained upward sloping on a closing-price basis. The December-to-September premium narrowed from 67 points to 63 points. The March-to-December premium widened from 82 to 86 points, while the May-to-March premium narrowed from 8 to 5 points.
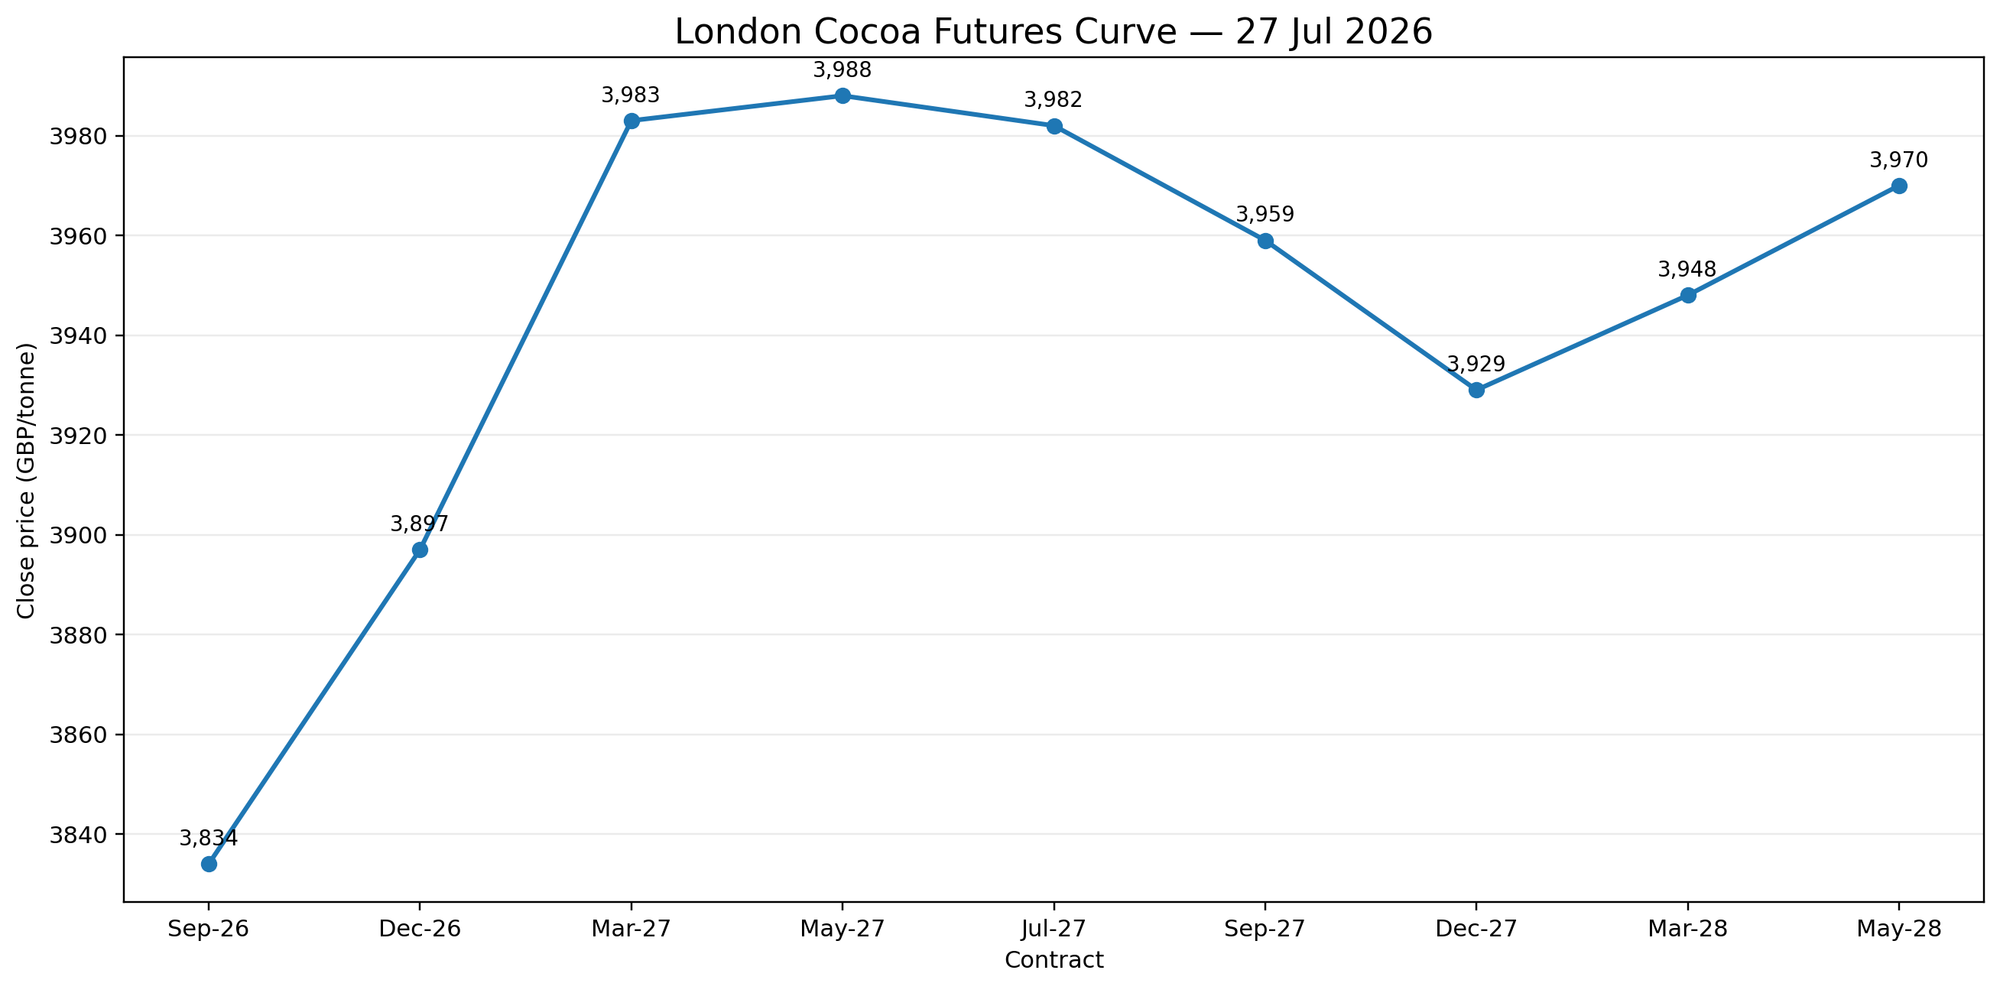
Official settlements confirmed the scale of the decline. September settled at 3,832, down 188 points or 4.68%. December settled at 3,890, down 191 points, while March and May settled at 3,981 and 3,980, declines of 190 and 186 points respectively.
EFP, EFS and Spread Activity
New York recorded 508 EFPs, 623 EFSs and 29,324 spread contracts, with spreads representing 66.6% of total volume. Activity was concentrated in September and December 2026, with December leading EFP, EFS and spread volume.
London recorded 626 EFPs, 670 EFSs and 16,628 spread contracts, equal to 65.2% of total volume. December 2026 dominated EFP and spread activity, while EFS volume was distributed across September, December and March.
In both markets, the high share of spread volume points to strong calendar-spread, rolling and curve-positioning activity rather than purely outright trading.
US–UK Spread
(Sep Contract)
$5,156 − (£3,834 x 1.329$/£) =$60ton (up from $-15ton)
Volume and Open Interest
New York cocoa
| Date | Volume | Open Interest |
|---|---|---|
| 21 Jul 2026 | 49,400 | 201,552 |
| 22 Jul 2026 | 40,347 | 200,429 |
| 23 Jul 2026 | 34,602 | 200,269 |
| 24 Jul 2026 | 46,210 | 199,322 |
| 27 Jul 2026 | 44,052 | — |
New York cocoa volume reached 44,052 contracts on 27 July, down 2,158 contracts, or 4.7%, from the 46,210 contracts traded on 24 July. Despite the day-on-day decline, activity remained 4.6% above the preceding ten-session average of 42,102 contracts, indicating relatively strong participation during the sell-off.
Volume was nevertheless below the recent highs of 49,400 contracts on 21 July and 47,602 contracts on 13 July. This suggests that the sharp price decline attracted meaningful participation but did not represent an exceptional volume event compared with other active sessions during the month.
New York open interest had already been declining steadily before the 27 July sell-off. It fell from a recent peak of 208,055 contracts on 17 July to 199,322 on 24 July, a reduction of 8,733 contracts, or 4.2%. This indicated substantial position reduction ahead of the latest session.
London cocoa
| Date | Volume | Open Interest |
|---|---|---|
| 21 Jul 2026 | 23,313 | 227,317 |
| 22 Jul 2026 | 27,061 | 228,134 |
| 23 Jul 2026 | 21,204 | 227,960 |
| 24 Jul 2026 | 18,744 | 227,976 |
| 27 Jul 2026 | 25,486 | — |
London cocoa volume increased sharply to 25,486 contracts, up 6,742 contracts, or 36.0%, from the unusually low 18,744 contracts traded on 24 July. The increase confirms that participation strengthened materially as prices fell.
However, volume remained 9.7% below the preceding ten-session average of 28,208 contracts and 20.8% below the average across all earlier July sessions. The sell-off therefore generated a clear rebound in activity, but overall London participation remained moderate compared with the more active sessions earlier in the month.
London open interest had previously fallen from a July high of 236,125 contracts on 9 July to 227,976 on 24 July, a decline of 8,149 contracts, or 3.5%. After this reduction, open interest stabilised around 227,000–228,000 contracts during the final sessions preceding the latest sell-off.
Exchange Trading Volume
| Exchange | 24 Jul 2026 | 27 Jul 2026 | Change | % Change |
|---|---|---|---|---|
| ICE U.S. Cocoa | 3,319,249 | 3,361,762 | +42,513 | +1.28% |
| ICE Europe Cocoa | 1,150,313 | 1,150,313 | 0 | 0.00% |
| Combined | 4,469,562 | 4,512,075 | +42,513 | +0.95% |
The measure is not a complete regional stock-to-grind ratio, as it includes only exchange-certified cocoa held at U.S. and EU delivery ports and excludes commercial inventories outside the ICE warehouse system. North America NCA grindings cover processors across North America, while ICE U.S. certified stocks are stored at U.S. delivery ports. ECA reports bean usage in European countries and London-certified cocoa is held in European and UK delivery locations.
Readers can explore detailed cocoa market datasets, futures statistics, and historical indicators in the CocoaIntel Data Hub:
 Cocoa Intel
Tomorrow's Outlook
The most likely scenario is an early test of the 5,080–5,100 support zone, followed by either consolidation or a technical rebound. Oversold momentum indicators increase the possibility of short covering, but any recovery is likely to face resistance around 5,200–5,250.
A sustained break below 5,080 would expose the psychological 5,000 level and could trigger another wave of technical selling. Conversely, a recovery above 5,250 could extend toward 5,300–5,350, although the broader short-term trend would remain bearish until that area is reclaimed.
The expected trading bias is therefore bearish to neutral, with downside risk still dominant but a temporary oversold rebound possible.
If you notice any discrepancies in these figures or have extra information, please email hello@cocoaintel.com or leave a comment – corrections and additional insights are always welcome.