Cocoa Breaks Support as Selling Accelerates (17 September 2026)


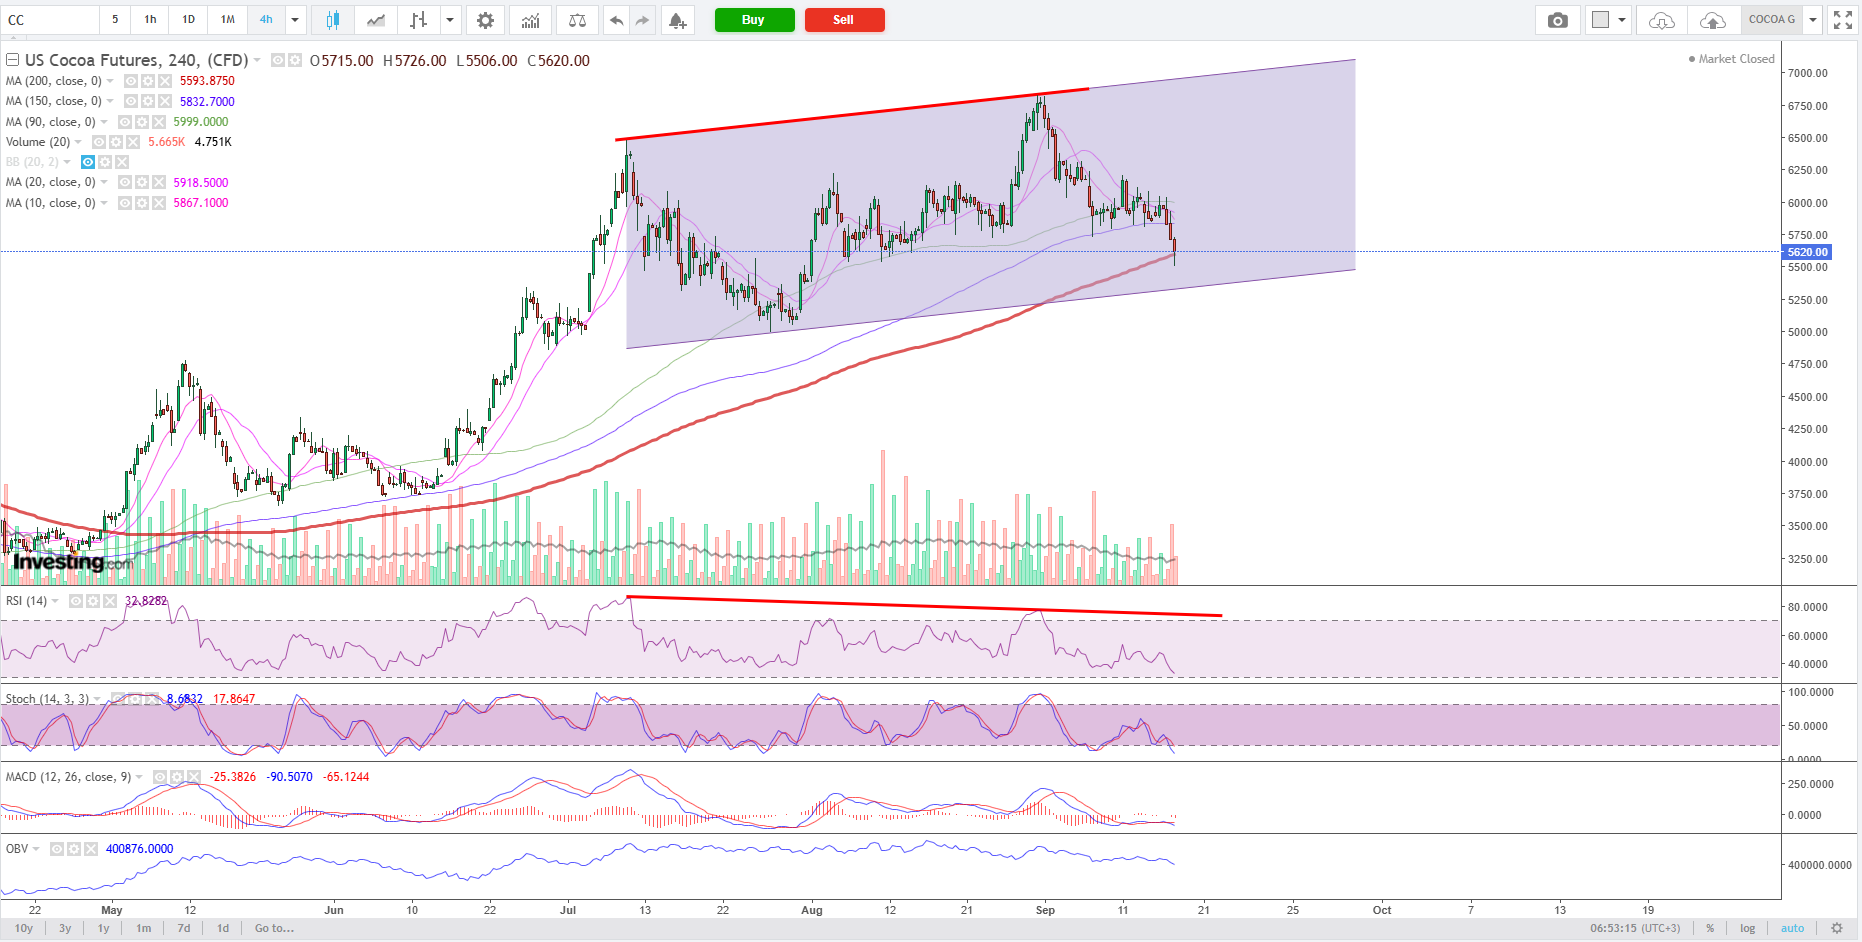
Thursday’s sell-off appears to have accelerated as cocoa broke below its recent consolidation. New York December failed to sustain an early advance to $6,038, then lost support around $5,860 and $5,800 before reaching $5,506. It finished at a last traded price of $5,620, down 5.56%. December-contract volume more than doubled to 21,160 contracts, giving the breakdown considerably stronger participation than Wednesday’s rebound. Once support failed, stop-loss orders and traders cutting long positions could have intensified the decline.
The news reviewed provides no clear evidence of a fresh bearish announcement driving the move. Reuters’ dealer comments described ample nearby supplies, an existing condition that may have limited buying support.
Côte d’Ivoire: Union Says Strike Has Begun
The producer dispute moved beyond the ultimatum covered in previous reports. In comments reported on 17 September, SYNAP-CI president Moussa Koné said members had begun an indefinite strike on 16 September and called for action to prevent cocoa reaching Abidjan and San Pedro. Demands included purchasing unsold stocks and replacing the Coffee and Cocoa Council’s director general. The announcement raises the risk of collection and delivery delays, but the report did not confirm that physical cocoa flows had been disrupted.
Dominican Republic: Production Forecast Above 100,000 Tonnes
A report published on 17 September quoted the National Cocoa Commission forecasting production above 100,000 tonnes for the cocoa year ending 30 September, supported by favourable rainfall, attractive prices and grower reinvestment. This compares with average annual output of 74,733 tonnes over the previous four seasons; it is not a year-on-year comparison. The forecast points to stronger supply outside West Africa, although the article does not establish when it was first announced or whether it represents an upward revision.
Recent Developments
Peru–Indonesia trade agreement. Peru’s ratification decree was published on 12 September, with government-announcement coverage appearing on 16 September. Cocoa is among the products due to receive tariff-free access once the agreement enters into force, but Indonesia’s ratification remains outstanding. The agreement could strengthen Peru’s access to Asian processors over time; it does not immediately change trade conditions or available supply.
Cameroon cocoa investment. Cameroon launched an agricultural investment platform on 16 September with $24.57 million in funding from the Central African Forest Initiative. Implemented by IDH and the government, it will initially focus on cocoa, helping cooperatives and agricultural businesses prepare projects capable of attracting private and climate finance. Its significance lies in future investment, productivity and forest protection, with benefits dependent on projects securing finance and being implemented.
Futures performance
New York cocoa
| Contract | 16 Sep close | 17 Sep close | Change | Change % |
|---|---|---|---|---|
| Dec-26 | $5,951 | $5,620 | −$331 | −5.56% |
| Mar-27 | $6,080 | $5,731 | −$349 | −5.74% |
| May-27 | $6,140 | $5,792 | −$348 | −5.67% |
| Jul-27 | $6,140 | $5,800 | −$340 | −5.54% |
| Sep-27 | $6,086 | $5,768 | −$318 | −5.23% |
| Dec-27 | $5,963 | $5,612 | −$351 | −5.89% |
| Mar-28 | $5,864 | $5,711 | −$153 | −2.61% |
New York cocoa fell across every comparable maturity on 17 September, fully reversing Wednesday’s rebound. Dec-26 lost $331, or 5.56%, to $5,620, while Dec-27 recorded the largest decline, falling $351, or 5.89%, to $5,612. Losses from Dec-26 through Dec-27 ranged from 5.23% to 5.89%, while Mar-28 declined a smaller 2.61%. All seven contracts finished below their 15 September closes, leaving the previous session’s recovery fully erased.
The intraday ranges show that higher prices were not sustained. Six of the seven contracts traded above Wednesday’s close at some point, but every maturity finished in the bottom quarter of its daily range. Dec-26 traded between $5,506 and $6,038 before ending at $5,620, approximately 21% of the way up its daily range. Its $532 range was more than three times Wednesday’s $171. Mar-27 through Sep-27 finished around 20%–22% into their ranges, while Dec-27 ended just $27 above its low and Mar-28 only $13 above its low. The session therefore combined a sharp expansion in volatility with a weak finish across the curve.
New York cocoa futures curve
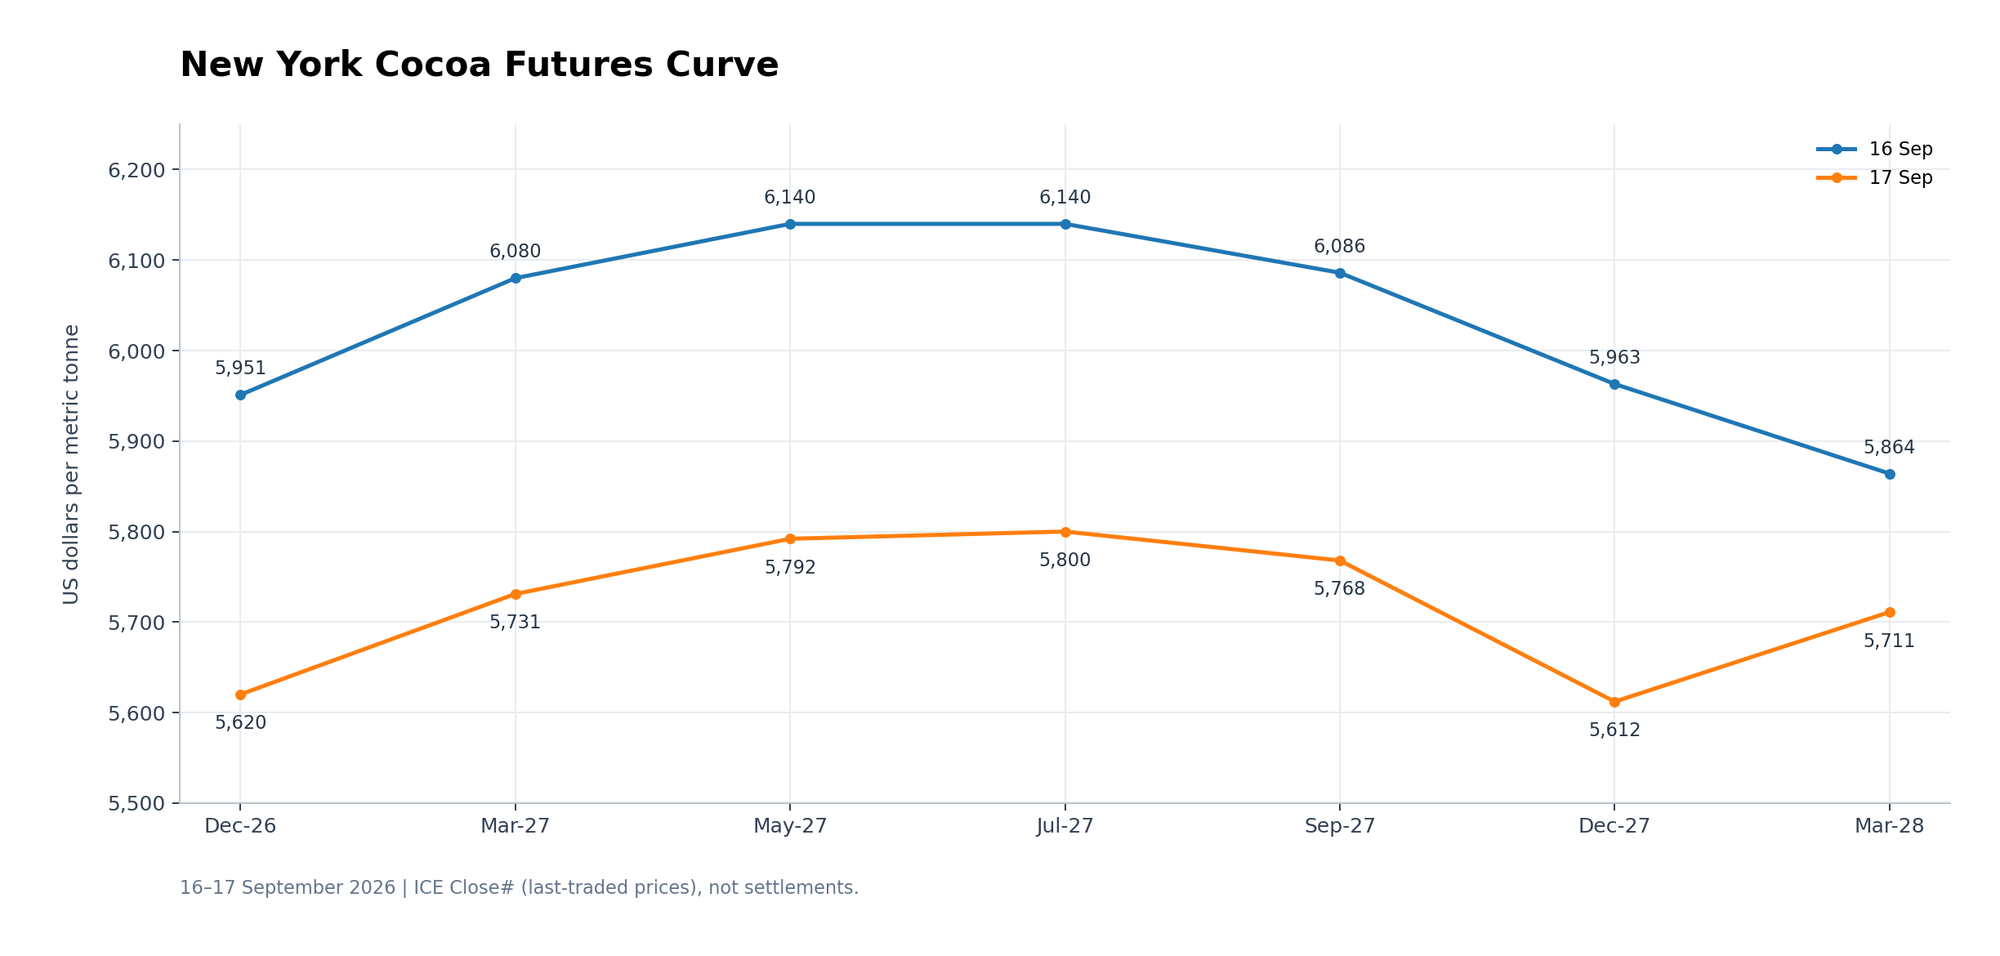
The comparable New York curve shifted sharply lower, retaining an upward slope into mid-2027. The May-27/Jul-27 plateau at $6,140 on Wednesday became a modest July peak at $5,800, with May-27 at $5,792. Dec-26/Mar-27 contango narrowed from $129 to $111, while May-27/Jul-27 moved from flat to $8 contango. Jul-27/Sep-27 backwardation narrowed from $54 to $32, whereas Sep-27/Dec-27 backwardation widened from $123 to $156 as Dec-27 underperformed.
The final part of the last-trade curve requires caution. Dec-27/Mar-28 flipped from $99 backwardation to $99 contango, reflecting Mar-28’s much smaller reported decline. However, the official settlements still showed $93 backwardation between those contracts. Last trades can occur at different times, particularly in less active maturities, so this apparent reversal should not be treated as a confirmed change in the spread. The broad decline is clear; the pronounced kink at the back of the last-trade curve is not reproduced by settlements.
London cocoa
| Contract | 16 Sep close | 17 Sep close | Change | Change % |
|---|---|---|---|---|
| Dec-26 | £4,378 | £4,249 | −£129 | −2.95% |
| Mar-27 | £4,540 | £4,418 | −£122 | −2.69% |
| May-27 | £4,569 | £4,458 | −£111 | −2.43% |
| Jul-27 | £4,566 | £4,471 | −£95 | −2.08% |
| Sep-27 | £4,497 | £4,417 | −£80 | −1.78% |
| Dec-27 | £4,354 | £4,284 | −£70 | −1.61% |
| Mar-28 | £4,328 | £4,255 | −£73 | −1.69% |
London cocoa also declined across all comparable maturities on 17 September, with the heaviest losses concentrated at the front of the curve. Dec-26 fell £129, or 2.95%, to £4,249, followed by Mar-27, down £122, or 2.69%, to £4,418. Declines moderated farther out, with Dec-27 losing 1.61% and Mar-28 falling 1.69%. All seven contracts finished below their 15 September closes, fully reversing Wednesday’s recovery, although the percentage losses were smaller than in New York.
Every comparable London contract traded above its previous close during the session but finished lower. Dec-26 ranged between £4,215 and £4,429 before ending at £4,249, approximately 16% of the way up its range. Mar-27 and May-27 finished around 15% and 17%, respectively, while Dec-27 and Mar-28 ended around 31%–32%. These positions show a weak finish throughout the curve, with relatively better resilience in the deferred contracts.
London cocoa futures curve
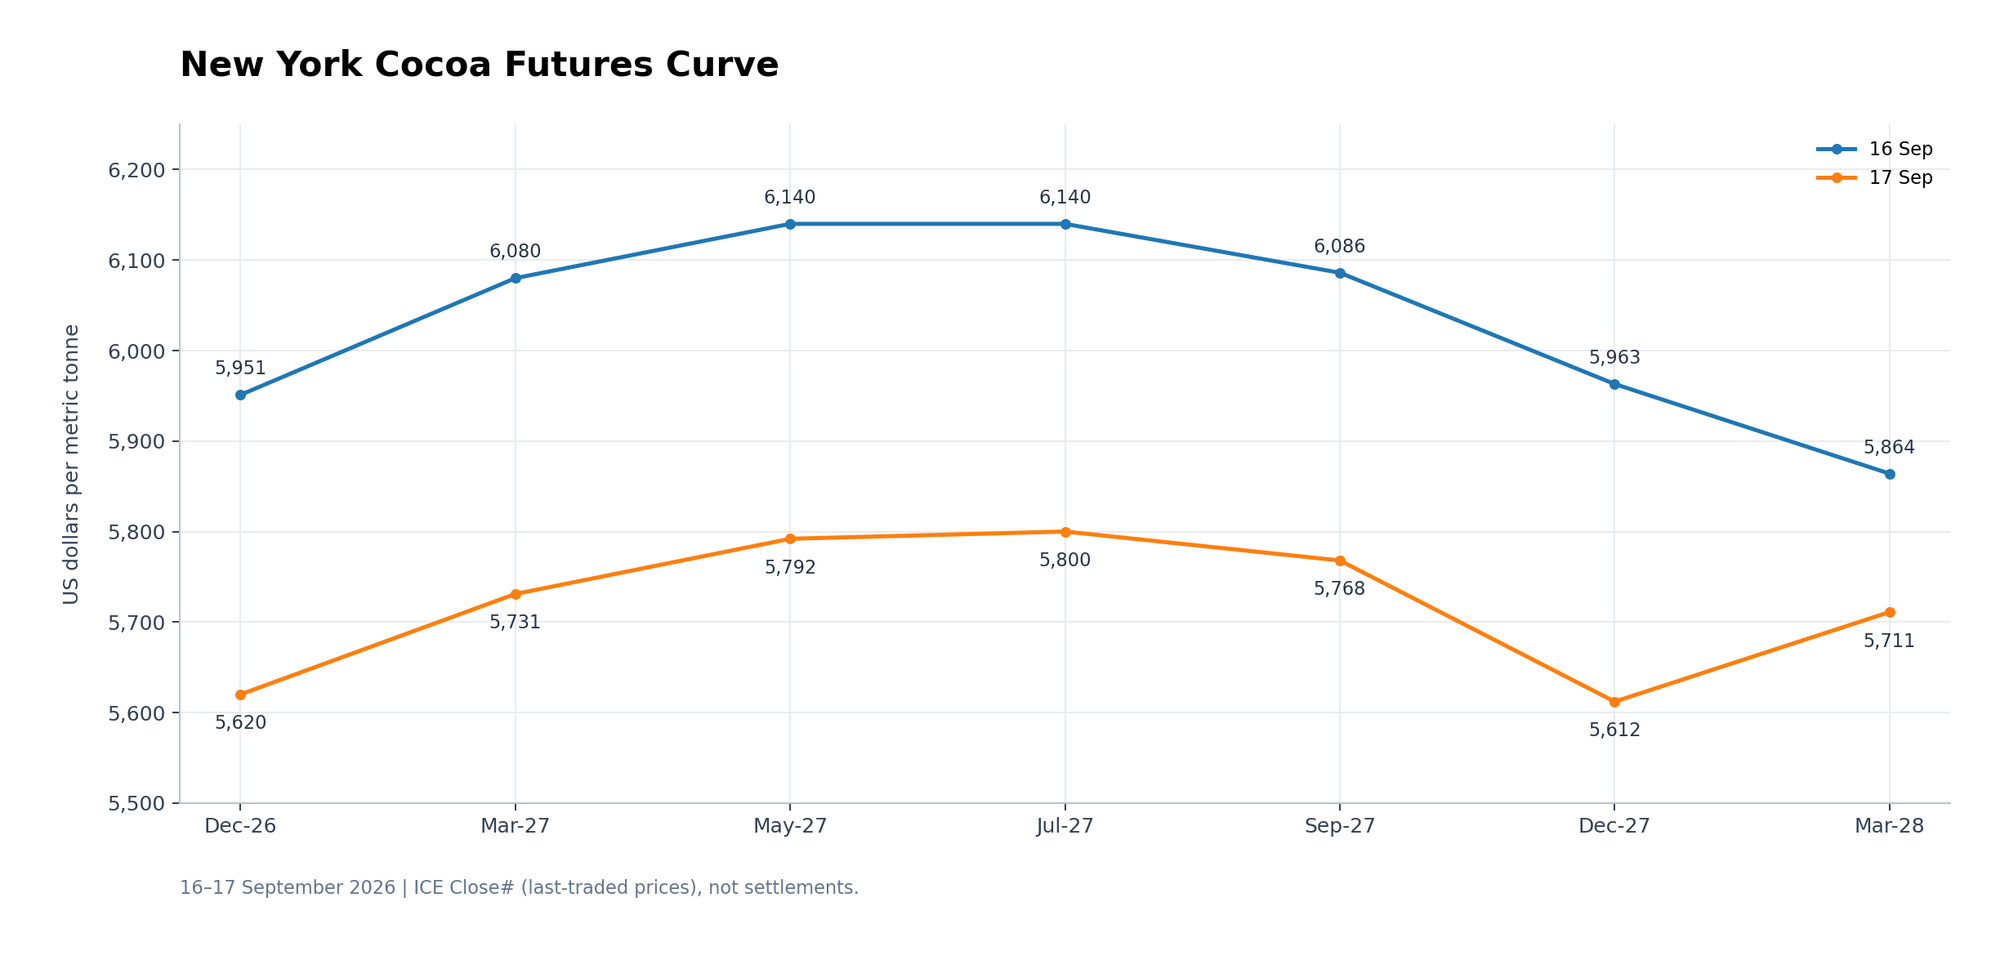
The London curve shifted lower, with nearby contracts weakening more than deferred maturities. The highest closing price moved from May-27 at £4,569 to Jul-27 at £4,471. Dec-26/Mar-27 contango widened from £162 to £169, while Mar-27/May-27 contango increased from £29 to £40. The May-27/Jul-27 relationship flipped from £3 backwardation to £13 contango, extending the curve’s upward slope into July.
Beyond that peak, Jul-27/Sep-27 backwardation narrowed from £69 to £54 and Sep-27/Dec-27 backwardation contracted from £143 to £133. Dec-26/Dec-27 also flipped from £24 backwardation to £35 contango. The combination of wider nearby contango and smaller deferred losses indicates a relative weakening of the front end, providing no evidence of a strengthening nearby squeeze on this closing-price basis.
NY–London Dec-26 Spread
$5,620 − (£4,249 x 1.335$/£) =$-52ton
New York December moved to approximately $52/t below London, compared with a $93/t premium on 16 September, using each day’s exchange rate.
New York Cocoa
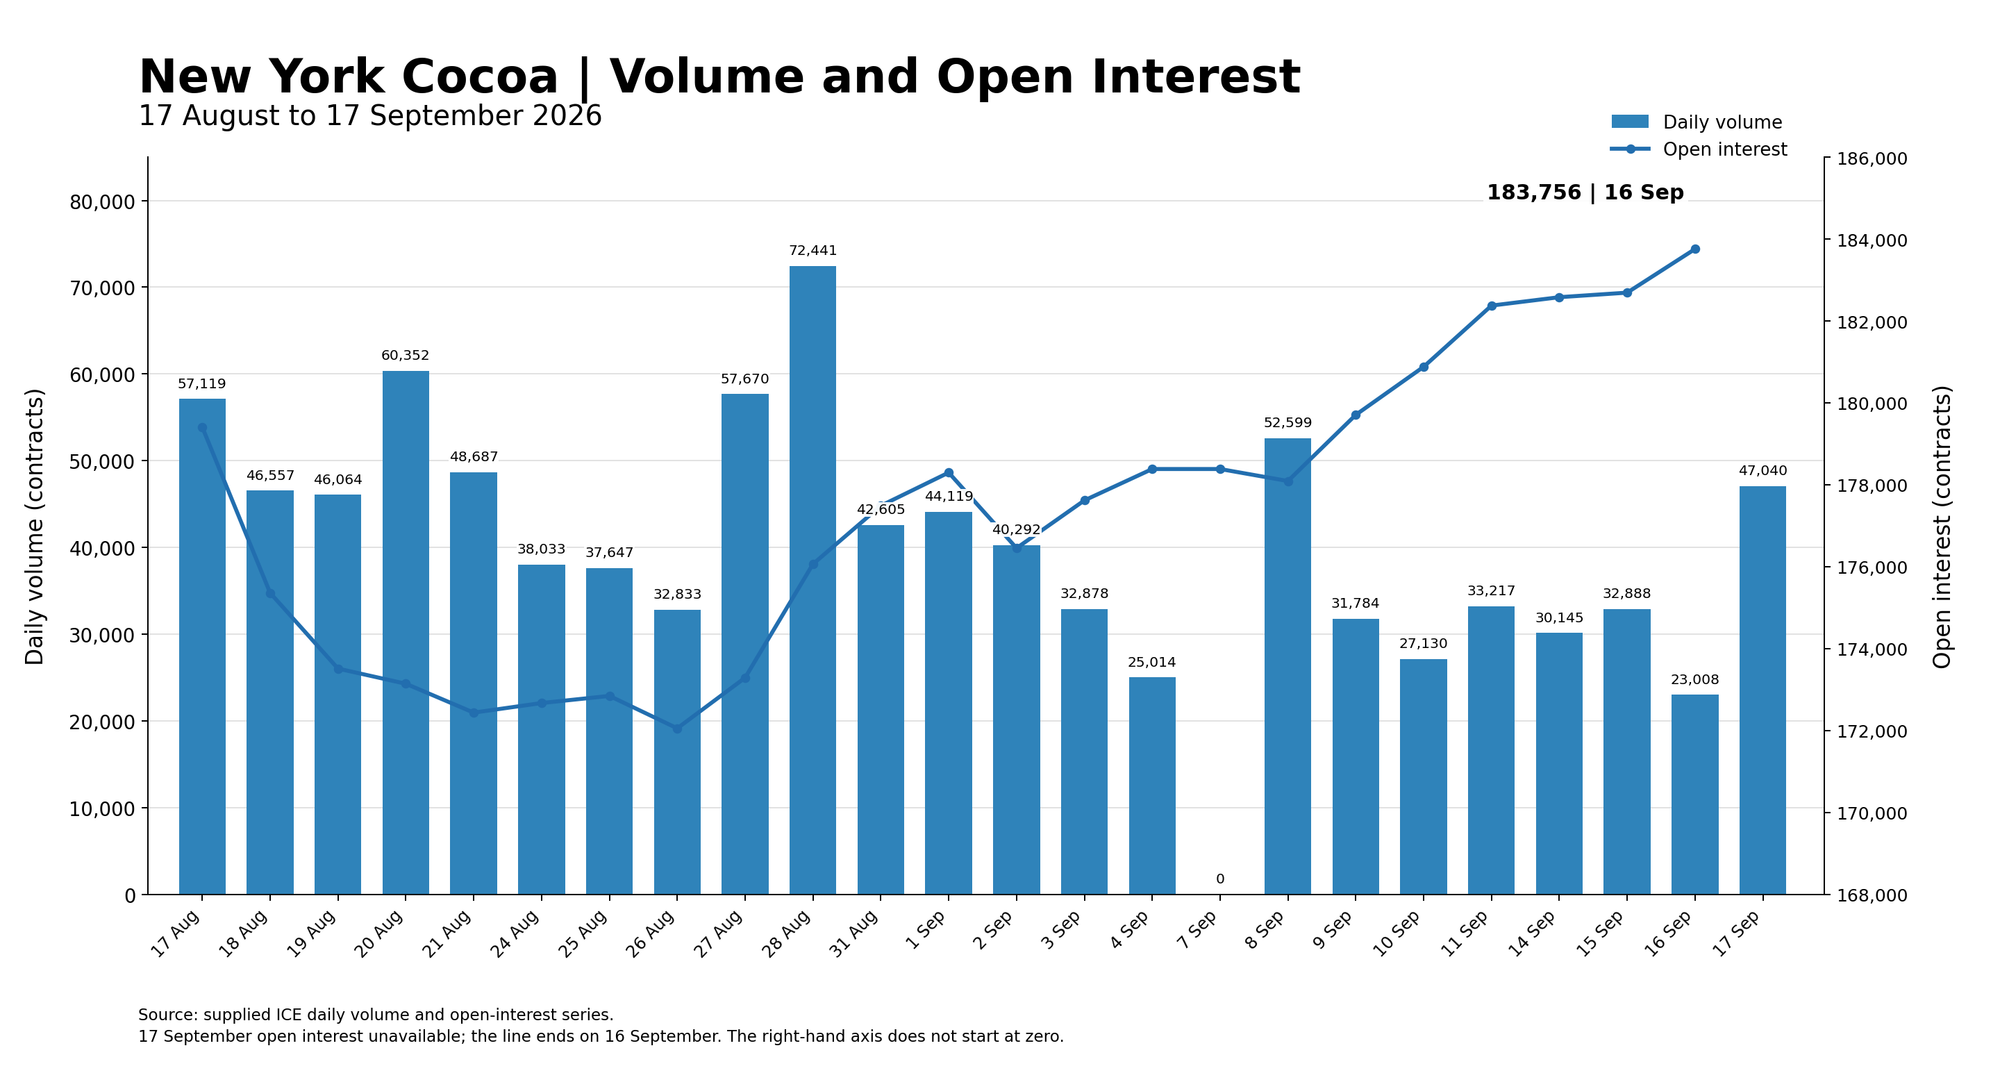
New York cocoa volume more than doubled to 47,040 contracts on 17 September, up 104.5% from 23,008 on 16 September. Turnover was 16.1% above the recent 20-session average of 40,519 contracts and the highest since 8 September, although still 35.1% below the 28 August peak of 72,441. Thursday’s sell-off therefore attracted substantially stronger participation than Wednesday’s rebound.
The latest available open interest is 183,756 contracts for 16 September, up 1,065 contracts, or 0.58%, from the previous session and the highest in the series. OI has increased by 11,701 contracts, or 6.8%, from its 26 August low. Wednesday’s price recovery thus coincided with net position creation, providing more evidence of new positioning than its low trading volume alone suggested. Aggregate OI does not identify which side initiated those positions.
Thursday’s heavier turnover strengthens the evidence of renewed selling pressure, but 17 September OI is still unavailable. The decline cannot yet be attributed primarily to fresh short selling or long liquidation. A fall in OI would be consistent with net position closures; a further increase would indicate that new positions were added during the sell-off.
London Cocoa
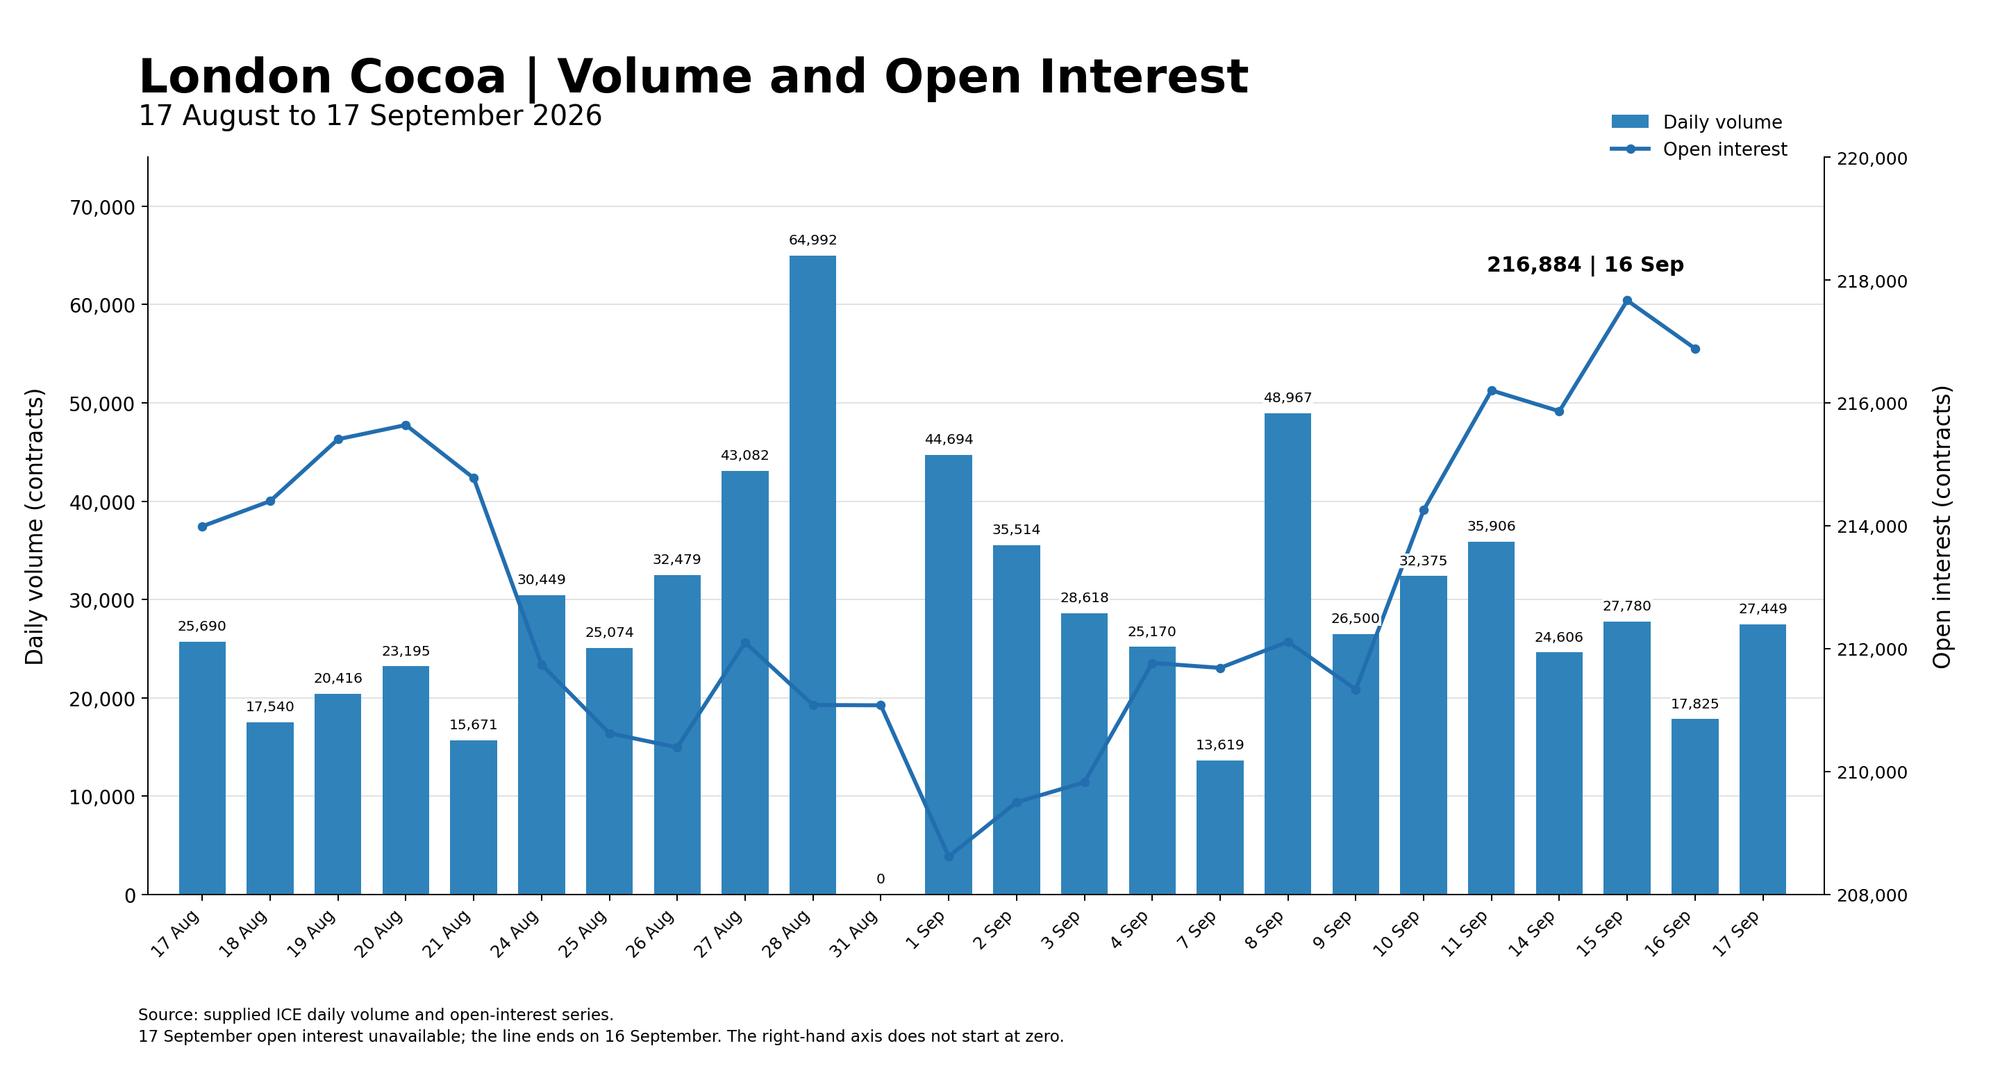
London cocoa volume rose to 27,449 contracts on 17 September, up 54.0% from 17,825 on 16 September. Despite the increase, turnover remained 12.0% below the recent 20-session average of 31,198 contracts and 57.8% below the 28 August peak of 64,992. The increase in activity was therefore weaker than New York’s, where turnover exceeded its recent average.
The latest available open interest is 216,884 contracts for 16 September, down 783 contracts, or 0.36%, from the previous session’s series high of 217,667. OI nevertheless remained 8,267 contracts, or 4.0%, above its 1 September low. Falling OI alongside Wednesday’s rising prices is consistent with short covering, although it does not establish that covering was the main driver of the rebound.
Thursday’s decline consequently followed a recovery accompanied by reduced outstanding positions. Higher volume shows renewed activity, but turnover does not indicate unusually heavy participation. With 17 September OI unavailable, the balance between liquidation and new positioning remains unresolved.
ICE Cocoa Stocks
| Market | Comparison dates | Previous stocks | Latest stocks | Change | Change % |
|---|---|---|---|---|---|
| US | 16 → 17 Sep | 3,429,334 | 3,429,167 | −167 | −0.005% |
| London (UK/EU)* | 15 → 16 Sep | 1,481,719 | 1,478,594 | −3,125 | −0.21% |
Over the past month, US warehouse stocks increased by 89,171 bags, or 2.7%, while London stocks rose by 331,875 bag equivalents, or 28.9%. The latest daily declines of 167 bags in the US and 3,125 bag equivalents in London were small relative to those monthly gains. US stocks have been broadly stable since early September, while European stocks continued building through most of the first half of the month.
US certified stocks separately increased from 556,587 to 743,979 bags, up 33.7%. These are already included in the US warehouse total. Their increase may partly reflect certification of existing inventory, so it should not be treated entirely as new arrivals.
The broader picture suggests improving exchange-visible availability, particularly in Europe. This can reduce nearby scarcity premiums and restrain price recoveries
Friday Trading Setup Dec Contract
Thursday’s break below the recent consolidation leaves Dec-26 vulnerable to further downside on Friday. The contract finished at a last traded price of $5,620, with substantially higher volume giving the breakdown more weight than Wednesday’s thin rebound. The hourly chart shows lower highs and lower lows, price below the moving-average cluster, and weakening MACD and OBV. This supports a bearish bias, although stretched short-term momentum leaves room for an initial bounce.
Immediate support is $5,506–$5,500. An hourly close below this zone, followed by a failed recovery, would expose $5,300 the broader channel-support area. The lower boundary of the rising channel makes this an important structural test: holding it would preserve the possibility of a correction within the broader recovery, while a sustained break would weaken that structure.
Initial resistance is $5,670–$5,725, followed by $5,775–$5,805. A rebound that fails in these areas would leave the consolidation breakdown intact. Buyers need to reclaim the latter zone and establish an hourly higher low before a recovery toward $5,860–$5,940 becomes more credible. Until then, the stronger setup remains a rebound into resistance followed by renewed pressure on $5,500.
| Catalyst | Current signal | Horizon | Market implication |
|---|---|---|---|
| Price structure | Bearish consolidation breakdown | Immediate | Dec-26 finished at a last traded price of $5,620, down 5.56%. Broken support becomes resistance on a rebound. |
| Volatility | Sharp range expansion | Immediate | December’s trading range widened to 532 points from 171 on Wednesday, ending the recent compression. |
| Volume | Stronger participation in the decline | Immediate | New York turnover rose 104.5% and London 54.0%. Selling attracted substantially more activity than Wednesday’s recovery. |
| Open interest | Mixed latest readings; 17 September unavailable | Next release | On 16 September, New York OI increased by 1,065 contracts while London fell by 783. Positioning behind Thursday’s decline remains unconfirmed. |
| Côte d’Ivoire | Strike escalation; disruption unconfirmed | Days to weeks | SYNAP-CI says an indefinite strike began on 16 September. Supply implications depend on actual collection and port-delivery disruption. |
| Ghana | Continuing purchasing-finance risk | Weeks | Outstanding COCOBOD payments could constrain buyers’ working capital. This remains an existing supply-chain risk. |
| Dominican Republic | Stronger production outlook | Season-end | Output forecast above 100,000 tonnes points to greater supply outside West Africa, although it is not an identified trigger for Thursday’s decline. |
| Exchange stocks | Higher over the month; small latest declines | Near term | Both stock series remain above mid-August levels. The latest modest declines do not establish sustained tightening. |
| Overall balance | Bearish, with scope for a corrective bounce | Friday | Below $5,775–$5,805, rebounds remain vulnerable. A sustained break below $5,506–$5,500 would expose $5,400 and channel support around $5,300. |
If you notice any discrepancies in these figures or have extra information, please email hello@cocoaintel.com or leave a comment – corrections and additional insights are always welcome.