Cocoa Consolidates Friday Ahead of Ghana Farmgate Price Announcement (25 September 2026)


New York December cocoa finished Friday at $5,603/t, up $9 (+0.16%) from Thursday’s $5,594 close. The front of the curve remained relatively firm, with Mar-27 adding $2 (+0.03%), while the middle maturities softened slightly: May-27 fell $5 (-0.09%), Jul-27 $3 (-0.05%) and Sep-27 $2 (-0.03%). Strength returned further out, with Dec-27 gaining $4 (+0.07%) and Mar-28 outperforming the curve with a $31 (+0.55%) advance. Overall, Friday’s performance was therefore mixed but resilient, with nearby prices holding their recovery while losses across the mid-curve remained limited.
Ghana raises 2026/27 farmgate price to GH¢42,400/t
Ghana has raised its cocoa producer price by 2.4% to GH¢42,400 per tonne, equivalent to GH¢2,650 per 64kg bag, effective 25 September. The price represents 71.18% of the realised gross FOB value, meeting the new legal requirement that farmers receive at least 70% of the achieved gross FOB price. The increase is modest compared with the previous GH¢41,392/t level, but it leaves Ghana paying substantially more than neighbouring Côte d’Ivoire, where the guaranteed 2026/27 farmgate price remains CFA1,200/kg.
That differential has direct implications for regional cocoa flows. Bloomberg reported Ghana’s new price at roughly $3,647/t, compared with about $2,084/t in Côte d’Ivoire, creating a sizeable arbitrage incentive for beans to move from Côte d’Ivoire into Ghana. Such a price gap could encourage additional smuggling and complicate the interpretation of national arrivals if Ivorian cocoa enters Ghana’s purchasing system. The differential creates an incentive, however, rather than evidence that cross-border flows have already increased.
Ghana’s new cocoa financing moves into the issuance phase
The next test is whether Ghana can finance purchases at the newly announced producer price. Cocoa Capital, COCOBOD’s financing subsidiary, has moved its new domestic funding programme into the issuance phase. The broader programme allows for up to GH¢14 billion of commercial paper for seasonal cocoa purchases and GH¢2.3 billion of longer-term bonds for legacy debt restructuring, but those headline amounts should not be interpreted as funds already raised.
The first commercial-paper issuance has a 270-day tenor, with the bookbuild scheduled to open on 28 September, close on 30 September, and settle on 1 October; the amount to be issued remains to be determined. Successful placement would strengthen purchasing liquidity and help move beans through Ghana’s internal marketing system. Investor demand and the actual amount raised will therefore be more informative than the programme’s maximum authorised size.
Côte d’Ivoire producer groups remain divided over strike action
Producer tensions remained active in Côte d’Ivoire over the weekend. SYNAP-CI president Koné Moussa continued the union’s mobilisation campaign in Biankouma on Friday, reiterating objections to the CFA1,200/kg producer price and urging farmers not to sell their cocoa. The dispute therefore continues to present a potential risk to farm-level selling and collection if participation broadens.
The sector is not presenting a unified front, however. On Saturday, representatives of unions, professional organisations and producer groups meeting in Abidjan called for dialogue rather than strike action; organisers said 63 of 90 identified organisations in the coffee-cocoa sector had been consulted. The weekend developments therefore reinforce the view that producer dissatisfaction is real, but there is still insufficient evidence of a coordinated nationwide disruption to cocoa movements. Physical arrivals, cooperative purchases and evidence of deliberate bean withholding remain the more important confirmation indicators.
Brazil’s cocoa expansion faces profitability and infrastructure constraints
Fresh Brazilian reporting highlighted the gap between the country’s potential as a diversified cocoa origin and the economics of expanding production. Nestlé Brazil ESG manager Luis Collaço pointed to Brazil’s integrated cocoa and chocolate chain and the productivity potential offered by technical assistance and improved farm management. At the same time, Espírito Cacau founder Paulo Gonçalves highlighted infrastructure deficiencies, shortages of skilled labour, low productivity and insufficient farm profitability as constraints on investment and plantation renewal.
The report also stressed that tighter sustainability and traceability requirements can become an advantage only if producers have sufficient financial capacity to implement them. For the global market, Brazil remains an important potential source of future supply diversification, but expansion should not be treated as automatic simply because cocoa prices previously encouraged planting. Infrastructure, labour availability, farm economics and the cost of compliance will determine how quickly production potential becomes commercially available cocoa.
Ghana concludes 2026/27 cocoa freight negotiations
Ghana has also completed freight negotiations with 18 international carriers and shipping lines for the 2026/27 season, covering cocoa shipments to Europe, the Far East and South America. Agreed rates include £32/t to the UK with a 35% bunker adjustment factor, €58.42/t to Northern Continental Europe, US$112.80/t to the Far East and US$130.54/t to Brazil, with operational responsibilities also clarified under the move towards full-container-load shipping.
Weather
Côte d’Ivoire and Ghana
Rainfall was suppressed across southern Côte d’Ivoire and southwestern Ghana during 16–22 September, while western Côte d’Ivoire retained longer-running deficits. Reuters’ 21 September field report recorded no rain in Soubré the preceding week, poor small-pod development and premature pod losses. Reported temperatures ranged from 25.6°C to 29.7°C, while cloud cover hindered bean drying despite the limited rainfall.
September has nevertheless been uneven rather than continuously dry. Ghana experienced widespread rainfall shortfalls during 1–10 September, followed by above-average rainfall in many areas during 9–15 September, before renewed weakness in the southwest. NOAA’s soil-moisture maps show drier percentile categories extending into parts of the southern Côte d’Ivoire–Ghana belt between 1 and 23 September.
The soil-moisture outlook valid 30 September retains dryness in western Côte d’Ivoire but indicates more favourable conditions in Ghana, without establishing complete replenishment. September 2025 was not uniformly wet either: early-month Gulf of Guinea deficits subsequently eased as rainfall increased in northern and eastern Côte d’Ivoire and central Ghana during 17–23 September. The evidence therefore supports differences in rainfall timing and distribution, not a blanket claim that the entire cocoa belt is drier than last year.
Nigeria and Cameroon
Heavy rain affected southeastern Nigeria and northwestern Cameroon in the latest observed week, with further showers maintaining flooding risks across southern Nigeria and western Cameroon through 30 September. Earlier, during 9–15 September, substantial rainfall surpluses in western Nigeria had coexisted with southeastern deficits, illustrating the month’s shifting distribution.
Soil moisture remains similarly uneven: southwestern Nigeria shows marked deficits, while central and southern Cameroon are more mixed, often near normal but locally dry. Heavy rainfall in one district therefore does not imply adequate moisture throughout either country’s cocoa belt. Flooding also affected Nigeria and northern Cameroon in September 2025, alongside warnings for southeastern Nigeria and western Cameroon; excessive-rain exposure is not unique to this year.
Togo, Liberia and Sierra Leone
NOAA’s rolling 30-day assessment shows rainfall surpluses in Togo, while central and eastern Liberia remain abnormally dry. Western Liberia and Sierra Leone face heavier-rain and flooding risks through 30 September. Last September also combined Gulf of Guinea rainfall deficits with heavy rain farther west. These contrasts rule out a single regional “drought” or “excessive rainfall” description; precise year-on-year comparisons require matching cocoa districts.
Indonesia
The clearest verified year-on-year deterioration is in the extent of below-normal rainfall. BMKG classified 92.86% of Indonesia as below normal during 1–10 September 2026, versus 15.48% in 2025; the corresponding figures for 11–20 September were 86.62% versus 9.02%. These measure national spatial coverage, not percentage reductions in rainfall volume or cocoa-weighted rainfall.
Drought warnings cover districts in Central, West, South and Southeast Sulawesi. BMKG’s 25 September bulletin reported dry spells exceeding 60 days in parts of southern and southeastern Sulawesi, with local maximum temperatures above 37°C in Southeast Sulawesi during 20–23 September, not an island-wide average. NOAA’s soil-moisture monitoring also shows deficits in parts of Sulawesi, with varying severity.
The 25 September–1 October outlook remains predominantly dry or lightly showery across much of Indonesia, despite local heavier-rain opportunities. BMKG forecasts less than 50 mm per ten-day period across most of Sulawesi in late September and across Sulawesi in early October: some rain is possible, but broad moisture recovery is not established. By contrast, the rainy season had begun in parts of West and Central Sulawesi and northern South Sulawesi by the second ten-day period of September 2025.
Brazil
Soil-moisture evidence is stronger than verified weekly rainfall totals. NOAA’s 23 September map indicates deficits around Pará’s Altamira–Medicilândia corridor, with conditions varying farther south in the state. Southern Bahia also shows local deficits, although coastal conditions are mixed rather than uniformly extreme. Comparison with 1 September indicates that dryness was already established in relevant northern Brazilian areas and had not been broadly eliminated; this does not mean every intervening week was dry.
INMET’s forecast for 21–28 September projected coastal Bahia rainfall of up to approximately 20 mm, with the heaviest northern rainfall concentrated in western and central Amazonas rather than the principal Pará cocoa areas. These are forecast, not observed, amounts. NOAA’s soil-moisture outlook through 30 September retains deficits in parts of Pará and Bahia. Matched September 2025 rainfall and soil-moisture values were not verified, so a definitive year-on-year deterioration cannot be claimed.
Futures Performance
New York cocoa
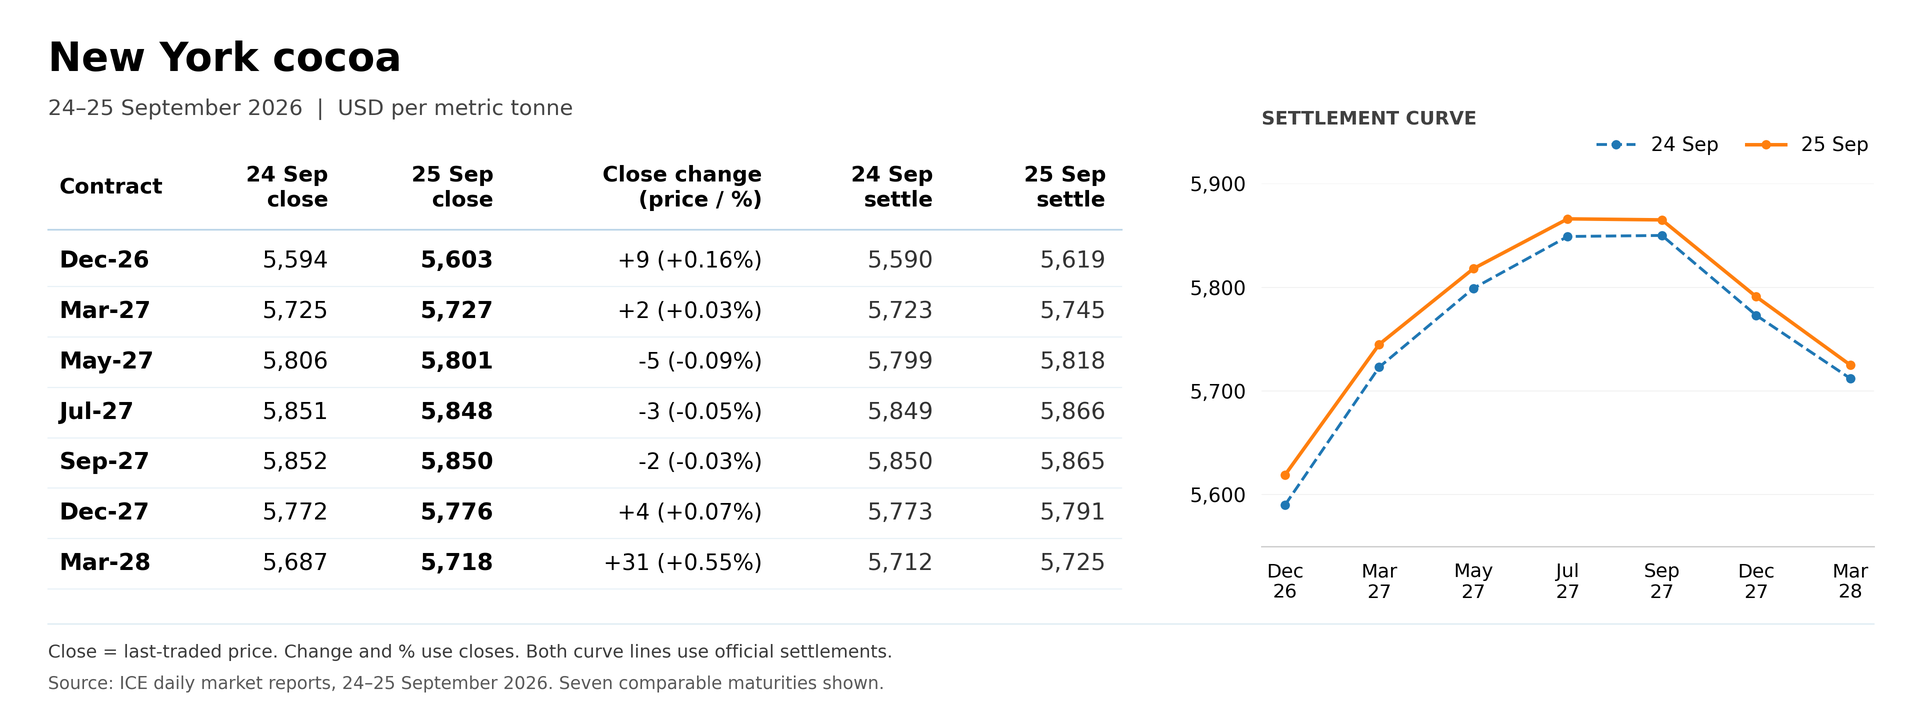
New York showed a firmer front-end structure despite mixed closing prices. December closed $9 higher at $5,603/t, while May, July and September finished marginally lower. On settlement, however, the entire displayed curve moved higher, with December rising from $5,590 to $5,619. The key structural change was the narrowing of Dec/Mar contango from $133 to $126/t and Dec/Jul from $259 to $247/t, indicating that nearby cocoa strengthened relative to deferred supply.
The move is constructive, but not yet a scarcity signal. The curve still peaks around Jul/Sep-27, leaving December at a substantial discount to the middle of the curve. Total volume also fell 11.7% to 26,380 contracts, so the recovery occurred with lighter participation. The market is showing better nearby support and reduced carry, but stronger closes, further spread tightening and physical-market confirmation would be needed to establish a broader bullish reversal.
London cocoa
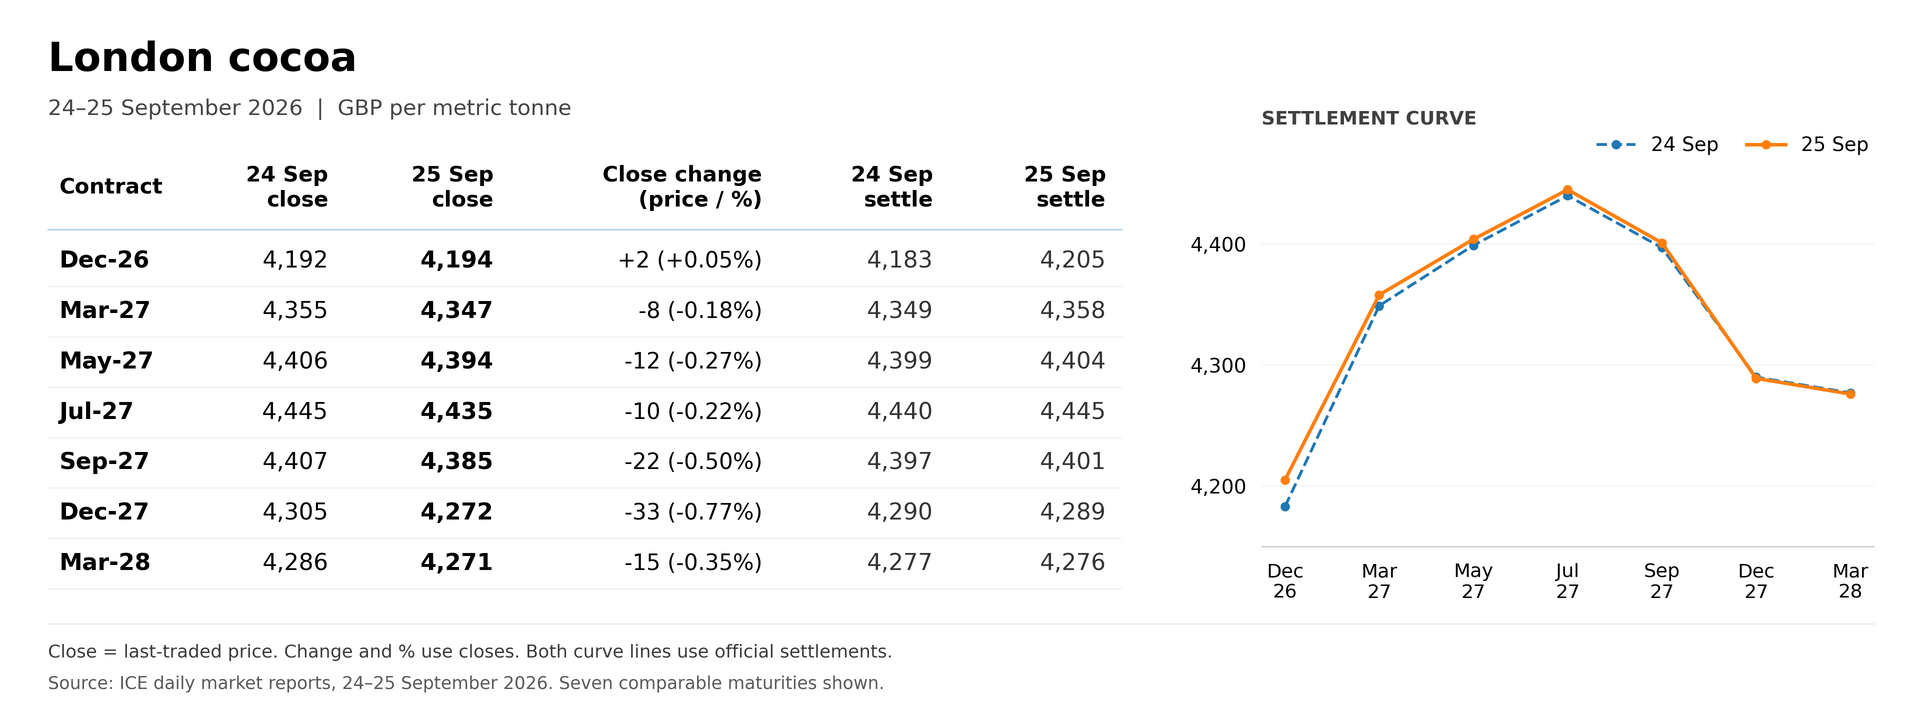
London displayed an even clearer divergence between nearby resilience and weaker deferred closes. December edged £2 higher to £4,194/t, while every maturity from March onward closed lower, led by Dec-27 at -£33 and Sep-27 at -£22. Settlement pricing was considerably firmer: December rose from £4,183 to £4,205, and settlements increased through Sep-27, while Dec-27 and Mar-28 slipped by only £1 each.
The curve also tightened materially at the front, with Dec/Mar contango narrowing from £166 to £153/t and Dec/Jul from £257 to £240/t. That supports an improving nearby tone, but the curve still peaks in Jul-27 and remains in significant carry from December. Volume declined 12.2% to 22,756 contracts, so the stronger front-end structure should still be treated as stabilisation rather than confirmation of a physical squeeze.
COT Analysis
| Indicator | New York | New York weekly change | London |
|---|---|---|---|
| Combined open interest | 233,275 | Not shown | 292,299 |
| Managed-money longs | 13,843 | −5,113 | 6,686 |
| Managed-money shorts | 33,265 | +1,864 | 13,129 |
| Managed-money net position | −19,422 | −6,977 | −6,443 |
| Managed-money spreading | 35,821 | −3,905 | 35,516 |
| Producer/merchant/processor/user net position | −11,777 | +9,619 | −16,648 |
| Swap-dealer net position | +35,642 | +518 | +22,150 |
| Other reportables’ net position | −6,263 | −1,357 | +814 |
New York: falling long exposure drives the bearish adjustment
Managed money’s net short increased to 19,422 contracts from 12,445, a 6,977-contract deterioration, or 56.1%. Reported directional longs fell 27.0% to 13,843, while directional shorts increased 5.9% to 33,265. Approximately 73% of the change in the net position therefore came from the reduction in the long column, with the remaining 27% attributable to the increase in the short column. This points more strongly to a retreat from bullish exposure than to an equally aggressive expansion of bearish positions.
The spreading figures add an important qualification. Managed-money spreading fell 3,905 contracts to 35,821. Because spreading represents offsetting long and short positions, adding those matched positions back to each side shows that total managed-money long-side exposure declined 9,018 contracts to 49,664, while total short-side exposure also declined, by 2,041 to 69,086. The net short consequently deepened within a smaller overall position book. Describing the week simply as a surge in gross fund shorts would miss that distinction. These totals are calculated from the supplied report using the CFTC’s spreading methodology.
The interpretation is therefore bearish, but more precisely one of long-side retrenchment and reduced overall exposure. Since the combined report converts options into futures-equivalent positions using delta factors, these weekly changes should not be treated as an exact count of futures bought or sold: changing option sensitivities can also affect the reported exposure.
Commercial participants move in the opposite direction
The producer/merchant/processor/user category reduced its New York net short from 21,396 to 11,777 contracts, a 9,619-contract adjustment toward the long side. Long positions increased by 3,675, while shorts declined by 5,944, reducing the category’s net short by approximately 45%. Against the deterioration in managed-money positioning, the commercial sector therefore provided a substantial opposing adjustment in reported exposure.
That is a potentially stabilising feature, but it is not proof of stronger physical demand or a confirmed price floor. The category combines producers, merchants, processors and users, whose positions can change with inventory, procurement and hedging requirements. The report does not identify which underlying commercial activity drove the adjustment. Likewise, swap dealers’ 35,642-contract net long should not automatically be interpreted as a bullish proprietary view, because their exchange positions can hedge exposures arising from customer swaps.
London: a smaller directional bearish imbalance
In London, managed money held 6,686 longs against 13,129 shorts, leaving a 6,443-contract net short. This represented approximately 2.2% of combined open interest, compared with 8.3% in New York. On this measure, the fund-positioning imbalance was substantially more bearish in New York.
London also recorded 35,516 managed-money spreading positions, considerably exceeding either its reported directional long or short column. That substantial offsetting exposure should be kept separate from the net directional assessment. ICE’s combined reporting methodology, like the CFTC’s, expresses options positions on a delta-adjusted futures-equivalent basis. Without the preceding London report, this snapshot establishes the current net short but not whether funds increased or reduced it during the week.
These are Tuesday, 22 September positions, not Friday’s closing exposure. They do not capture trading on 23–25 September, and the reported totals span contract maturities rather than isolating December 2026.
Volume and Open Interest
New York cocoa
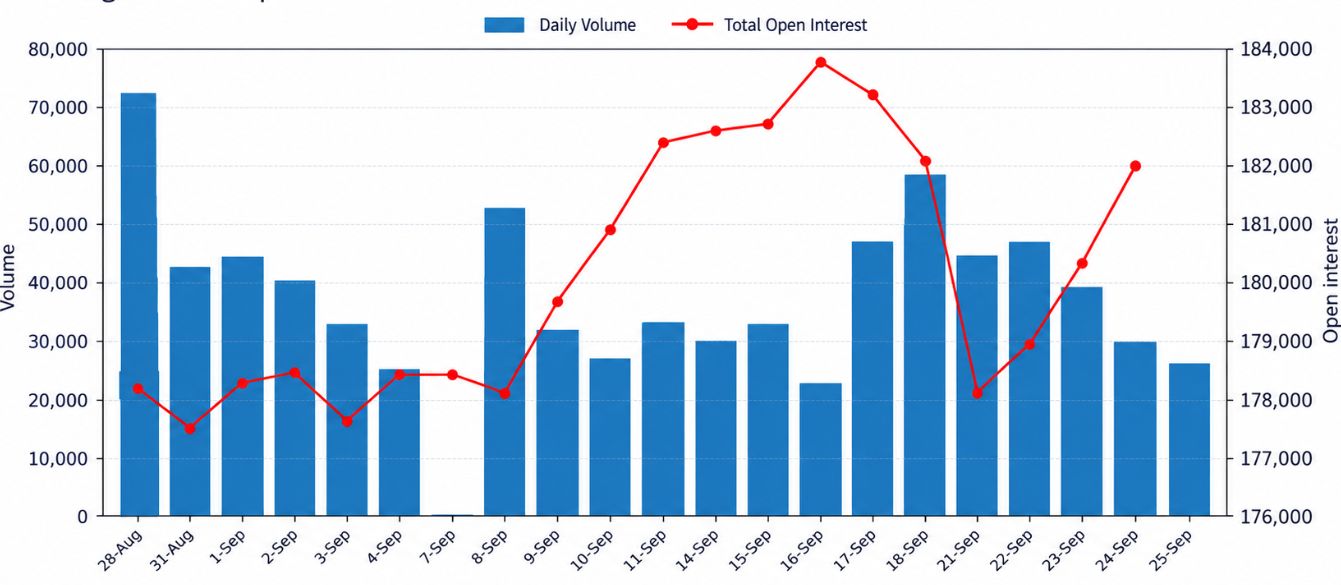
New York turnover continued to fade on Friday, with total volume falling to 26,380 contracts, down 11.7% from 29,891 on Thursday and roughly 31% below the previous 10-session average. That matters because the December contract still managed to close higher, meaning the recovery persisted despite progressively lighter participation. In classical price-volume analysis, rising prices on falling volume are usually treated as a weaker form of confirmation than rising prices on expanding volume; the move can continue, but conviction is less evident.
Open interest gives a somewhat more constructive signal, although the timing is important. The latest confirmed reading rose to 181,968 contracts on 24 September, up 1,724 (+0.96%) from the previous day and extending the rebound from 178,085 on 21 September. Rising price alongside rising open interest is generally associated with fresh position creation and is usually more supportive of trend continuation than a rally driven purely by position reduction. However, because 25 September open interest is not yet available, Friday itself cannot yet be classified that way. The present reading is therefore moderately constructive rather than strongly bullish: price is recovering and OI had been rebuilding, but Friday’s falling volume prevents a stronger confirmation.
London cocoa
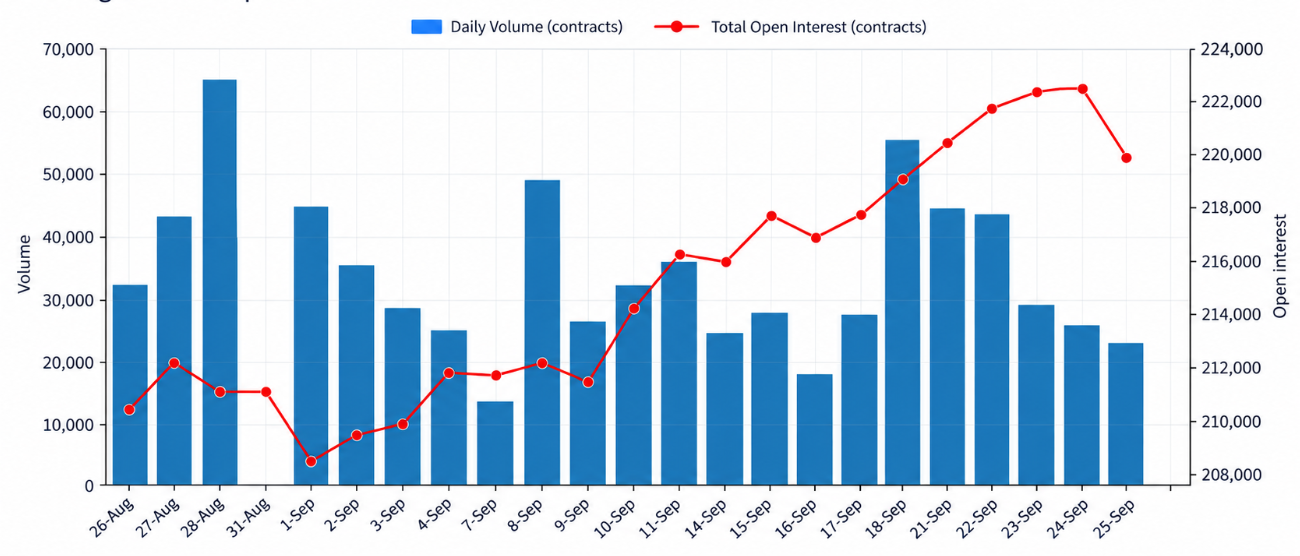
London showed a weaker participation profile. Volume fell to 22,756 contracts, down 12.2% from 25,921 on Thursday and roughly 32% below the previous 10-session average. That makes Friday’s price stabilisation less convincing from a participation perspective. As with New York, rising or stable prices accompanied by contracting turnover usually suggest that the move is being sustained by fewer active contracts rather than broadening market participation.
The more important signal is the drop in open interest to 219,708 contracts on 24 September, down 2,676 (-1.20%) from 222,384. When prices recover while open interest falls, the standard interpretation is that position liquidation or short covering may be contributing more than fresh long accumulation. That does not make the rebound invalid, but it generally gives it less structural strength than a rally accompanied by expanding OI. London therefore looks more like a stabilisation/short-covering recovery, whereas New York currently has the stronger underlying participation signal because OI had been rebuilding into the latest available session.
ICE Cocoa Stocks
| Market | Stock measure | Previous update | Latest update | Change | Change % |
|---|---|---|---|---|---|
| US | Total stocks in ICE Futures U.S. licensed warehouses | 3,436,831 bags | 3,432,756 bags | −4,075 | −0.12% |
| London / Europe | Valid-warrant stocks | 75,570 t | 75,690 t | +120 t | +0.16% |
US warehouse stocks stood at 3,432,756 bags on 25 September, down 4,075 bags (-0.12%) from the previous update and only 1,776 bags (-0.05%) below 18 September. The weekly decline is therefore very small relative to the stock base and does not yet constitute a sustained drawdown. US inventories also remain above end-August levels, indicating that the recent accumulation has largely stabilised rather than reversed.
London/Europe requires a different interpretation. The latest valid-warrant stock was equivalent to approximately 1,182,656 64kg bags, up 1,875 bags (+0.16%) from the previous reading. However, valid-warrant stock measures cocoa currently carrying valid exchange delivery warrants, not the total amount of cocoa physically stored in ICE-licensed European warehouses. The September expiry event demonstrated why this distinction matters: cocoa can move from valid to expired warrant status without physically leaving the warehouse. Changes in the London valid-stock series therefore do not necessarily represent physical inflows or withdrawals.
Monday Trading Setup - Dec Contract
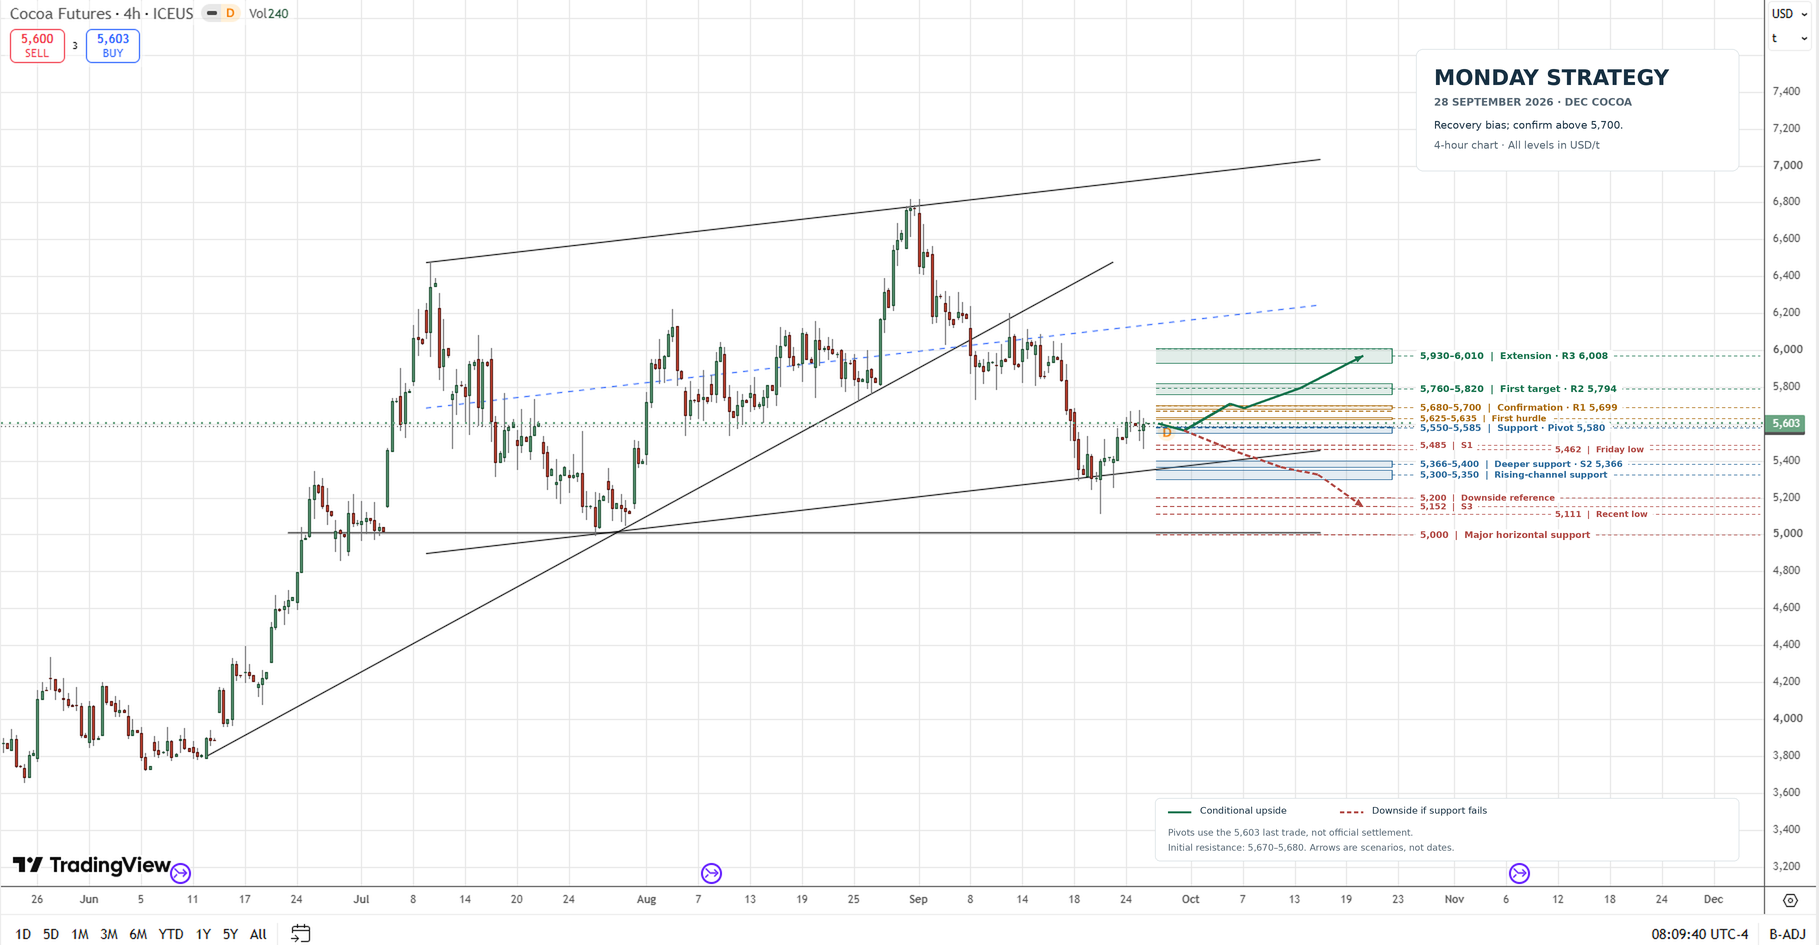
The preferred scenario is an initial consolidation or shallow pullback that holds $5,550–5,585, followed by another attempt at $5,625–5,635 and $5,670–5,680. An hourly close above $5,680, a successful retest and acceptance above $5,700 would strengthen the continuation case towards $5,760–5,820. Sustained recovery above that zone would expose $5,930–6,010, where longer moving averages and third pivot resistance converge. This remains an extension objective rather than the default Monday target.
Repeated rejection below $5,700 would preserve consolidation. Losing $5,550 would expose $5,485 and $5,462; a break below Friday’s low followed by a failed reclaim would favour $5,400–5,366, then $5,300–5,350 rising-channel support. Failure there would undermine the recovery and reopen $5,200, $5,152, $5,111 and $5,000. The setup therefore favours recovery, but $5,680–5,700 remains the confirmation zone.
If you notice any discrepancies in these figures or have extra information, please email hello@cocoaintel.com or leave a comment – corrections and additional insights are always welcome.