Cocoa Extends Losses as Technical Selling Dominates Despite Rising Supply Risks (15 September 2026)


- New York Dec-26 cocoa closed at $5,860, down 2.80%, after failing to hold an intraday recovery to $6,085.
- Ghana faces potential new-season purchasing disruption as LBCs struggle with financing constraints and outstanding COCOBOD debt.
- Côte d’Ivoire producer groups are escalating strike threats over the CFA1,200/kg farm-gate price and delayed payments.
- Brazil is seeing weaker grinder buying, adding pressure on producers and raising questions over domestic processing demand.
New York cocoa traded through a volatile two-way session on 15 September, with Dec-26 initially weakening toward the $5,804 intraday low before staging a sharp recovery that carried prices as high as $6,085. The rebound failed to hold, however, and renewed selling pressure dominated the second half of the session, pushing the contract back below $5,900 and into a $5,860 close, down 2.80% from the previous close. The official settlement was $5,923, down $100 or 1.66% on the day, leaving the session characterised by a failed recovery and a weak finish rather than sustained buying interest.
Ghana: COCOBOD debt raises risk to new-season cocoa purchasing
Ghana’s Licensed Buying Companies are warning that financing constraints could disrupt cocoa purchases when the 2026/27 season opens. The Chamber of Cocoa Marketers says COCOBOD owes LBCs nearly GH¢4 billion for previous cocoa purchases, leaving some companies struggling to secure fresh credit while continuing to service existing loans. According to the Chamber, some buyers are facing borrowing costs of as much as 40%, increasing the risk that companies may lack sufficient liquidity to return to producing areas and purchase beans from farmers.
The concern comes as Ghana moves away from its traditional syndicated pre-export financing system toward a new domestic funding model for the 2026/27 crop. The Chamber says LBCs still lack clarity over how the new financing arrangement will operate, despite the new season approaching. If funding is not available in time, the issue could slow farm-level purchases, aggregation and the movement of cocoa through Ghana’s internal supply chain, even if beans are physically available.
The Chamber has also warned that Ghana’s new farm-gate pricing mechanism could create a significant price differential with Côte d’Ivoire, where the 2026/27 producer price has been set at CFA1,200/kg. A wide differential could increase incentives for cross-border cocoa flows, adding another potential complication for Ghana’s ability to secure beans through official channels.
Côte d’Ivoire: Producer groups escalate pressure as strike risk rises
Tensions are increasing among Côte d’Ivoire’s cocoa producers, with seven producer organisations backing strike action over the current CFA1,200/kg farm-gate price, which they contrast with the CFA2,800/kg level during the 2025/26 main crop. The groups also point to cocoa from the previous campaign that remains unsold in producers’ hands, adding to cash-flow pressure at farm level. Their demands include exceptional state support for the farm-gate price, changes to producer representation within the coffee-cocoa interprofessional structure, an audit of sector funds and stronger border controls aimed at limiting unofficial cocoa flows into neighbouring countries.
Separately, SYNAP-CI has issued an ultimatum expiring on 16 September, citing delayed payments, unsold cocoa and problems surrounding producer cards, and has threatened an indefinite strike if the issues are not addressed. The immediate market risk is therefore not necessarily a reduction in available cocoa, but a potential disruption to farm-level selling, bean collection and deliveries into the domestic supply chain.
Brazil: Reduced grinder buying puts pressure on Pará producers
Cocoa producers in Pará are facing increasing difficulties marketing their crop as grinding companies reduce purchases, limiting the normal channels through which beans move from farms into processing. With fewer direct buyers available, some producers have been forced to sell through cereal traders and other intermediaries, in some cases at prices below prevailing market levels. This has weakened producers’ negotiating position and increased pressure on farm income.
The situation has prompted discussions over alternative marketing and financing mechanisms, including the possible use of federal government purchasing programmes, rural credit and expanded storage options. The objective would be to give producers greater flexibility to hold or market beans rather than being forced to sell into weak local demand. Importantly, no government purchasing programme has yet been confirmed, and the reason behind the reduction in grinder buying has not been established. From a market perspective, however, the development is notable because it points to weaker physical offtake from Brazil’s processing sector despite beans being available at origin, raising questions about domestic grind demand and processor inventory requirements.
Futures performance
New York cocoa
| Contract | 14 Sep | 15 Sep | Change | Change % |
|---|---|---|---|---|
| Dec-26 | $6,029 | $5,860 | -$169 | -2.80% |
| Mar-27 | $6,157 | $5,987 | -$170 | -2.76% |
| May-27 | $6,198 | $6,040 | -$158 | -2.55% |
| Jul-27 | $6,181 | $6,048 | -$133 | -2.15% |
| Sep-27 | $6,129 | $6,000 | -$129 | -2.10% |
| Dec-27 | $6,018 | $5,853 | -$165 | -2.74% |
| Mar-28 | $5,927 | $5,759 | -$168 | -2.83% |
New York cocoa fell across every comparable maturity on 15 September, reversing Monday’s rebound. Dec-26 declined $169, or 2.80%, to $5,860, while Mar-27 recorded the largest dollar decline, losing $170, or 2.76%, to $5,987. Losses across the comparable curve ranged from 2.10% to 2.83%, with Jul-27 and Sep-27 relatively more resilient and Mar-28 recording the largest percentage fall. On this closing-price basis, all seven contracts finished below their 11 September levels, fully erasing Monday’s gains.
The intraday ranges show that higher prices were not sustained: every comparable contract traded above its 14 September close at some point, but all finished lower. Dec-26 traded between $5,804 and $6,085 before closing at $5,860, approximately 20% of the way up its daily range. Mar-27 and May-27 finished around 20% and 19% into their respective ranges, while Dec-27 ended around 12% above its low. Mar-28 was particularly weak, closing at $5,759, just $6 above its session low. These closing positions show a weak finish across the curve, although the daily data alone do not establish the timing of the intraday highs and lows.
New York Futures Curve
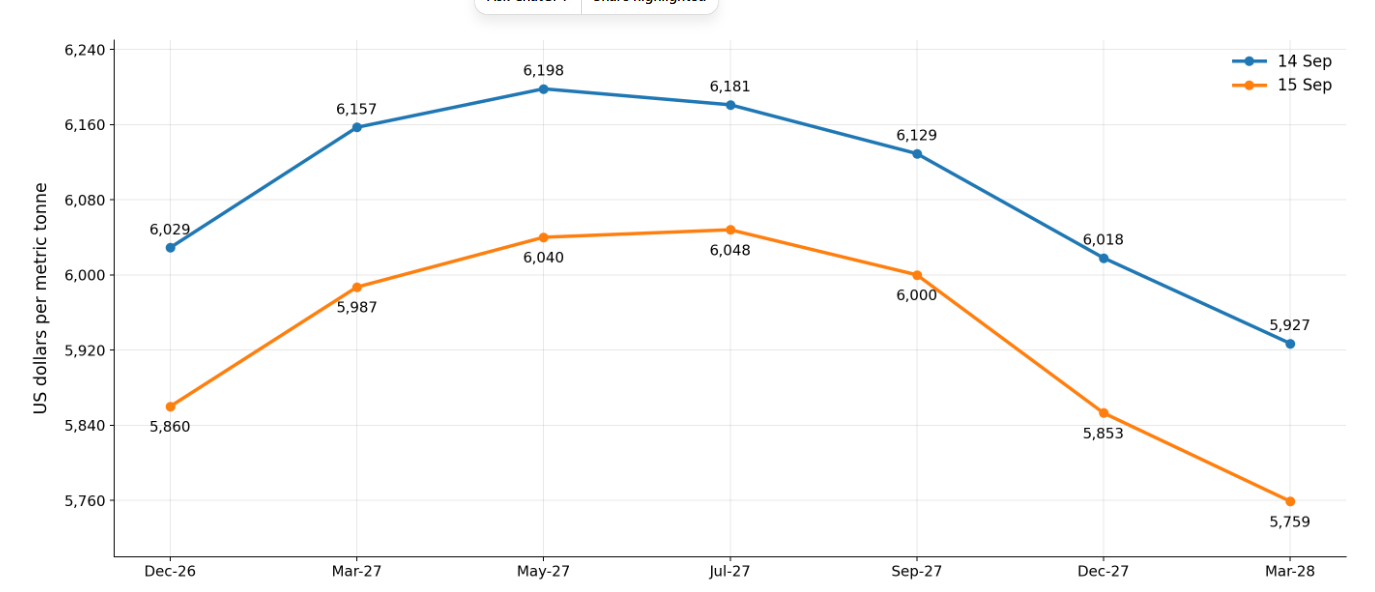
The entire comparable New York curve shifted lower, but mid-2027 contracts held up better than the front and back of the curve. The highest closing price moved from May-27 at $6,198 on 14 September to Jul-27 at $6,048 on 15 September, with May-27 just below it at $6,040. The smaller declines in Jul-27 and Sep-27 left relative price strength concentrated around the middle of the curve rather than the nearby Dec-26 contract.
There were also meaningful changes in the curve structure. The May-27/Jul-27 relationship flipped from $17 backwardation to $8 contango, while the Dec-26/Mar-27 contango was almost unchanged at $127, compared with $128 previously. Further out, Sep-27/Dec-27 backwardation widened from $111 to $147, whereas Dec-26/Dec-27 backwardation narrowed from $11 to $7. The curve therefore retained an upward slope into mid-2027 and a downward slope thereafter. The relative resilience was concentrated in mid-2027, rather than representing a broad strengthening of the nearby end.
London cocoa
| Contract | 14 Sep close | 15 Sep close | Change | Change % |
|---|---|---|---|---|
| Dec-26 | £4,386 | £4,310 | −£76 | −1.73% |
| Mar-27 | £4,540 | £4,477 | −£63 | −1.39% |
| May-27 | £4,564 | £4,500 | −£64 | −1.40% |
| Jul-27 | £4,551 | £4,499 | −£52 | −1.14% |
| Sep-27 | £4,485 | £4,421 | −£64 | −1.43% |
| Dec-27 | £4,374 | £4,292 | −£82 | −1.87% |
| Mar-28 | £4,347 | £4,262 | −£85 | −1.96% |
London cocoa also declined across all comparable maturities on 15 September. Dec-26 fell £76, or 1.73%, to £4,310, giving back Monday’s £73 advance and finishing marginally below its 11 September close of £4,313. Declines across the comparable curve ranged from 1.14% to 1.96%. The largest losses were concentrated toward the back, with Mar-28 falling £85, or 1.96%, and Dec-27 losing £82, or 1.87%, while Jul-27 was the most resilient, declining £52, or 1.14%.
London’s closing positions were weak but less extreme than New York’s. Dec-26 traded between £4,237 and £4,425 before closing at £4,310, approximately 39% of the way up its daily range. Mar-27 and May-27 finished around 39% and 40% into their ranges, while Jul-27 ended around 43%. All seven comparable contracts closed in the lower half of their session ranges, despite having traded above their previous closes at some point. This indicates that the market failed to sustain higher prices, although it finished farther from its lows than New York.
London Futures Curve
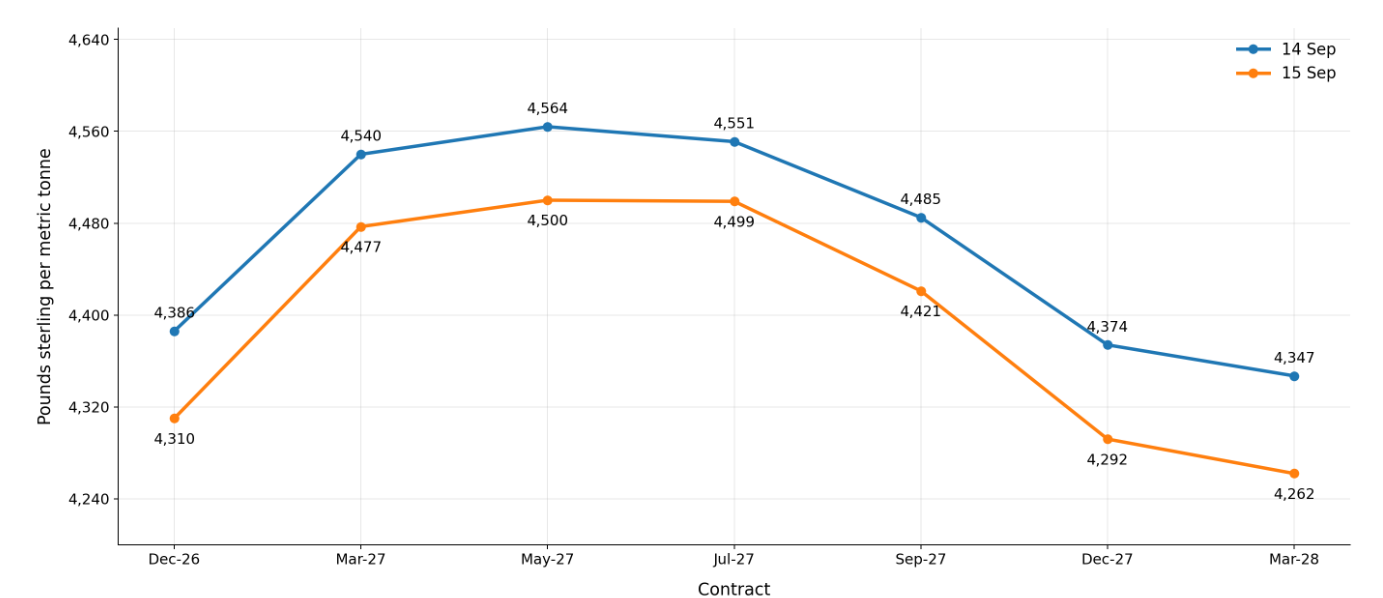
The London curve shifted lower while retaining its mid-2027 peak. May-27 remained the highest-priced comparable contract at £4,500, but Jul-27 finished just £1 below it at £4,499. Consequently, May-27/Jul-27 backwardation narrowed from £13 to only £1, leaving an almost flat section around the curve’s high point. At the front, Dec-26/Mar-27 contango widened from £154 to £167, while the Dec-26 discount to May-27 increased from £178 to £190.
Beyond mid-2027, the downward slope became steeper. Jul-27/Sep-27 backwardation widened from £66 to £78, and Sep-27/Dec-27 backwardation increased from £111 to £129. The Dec-26/Dec-27 relationship also strengthened from £12 to £18 backwardation. These changes show that Dec-26 weakened relative to the spring and early-summer contracts but held up better than Dec-27. The structure therefore points to differentiated pressure across maturities, rather than a uniform shift toward either contango or backwardation.
NY–London Dec-26 Spread
$5,860 − (£4,310 x 1.347$/£) =$54ton
NY Dec-26 premium to London Dec-26: approximately $54/t, down from roughly $108/t on 10 September.
Volume and Open Interest
New York cocoa
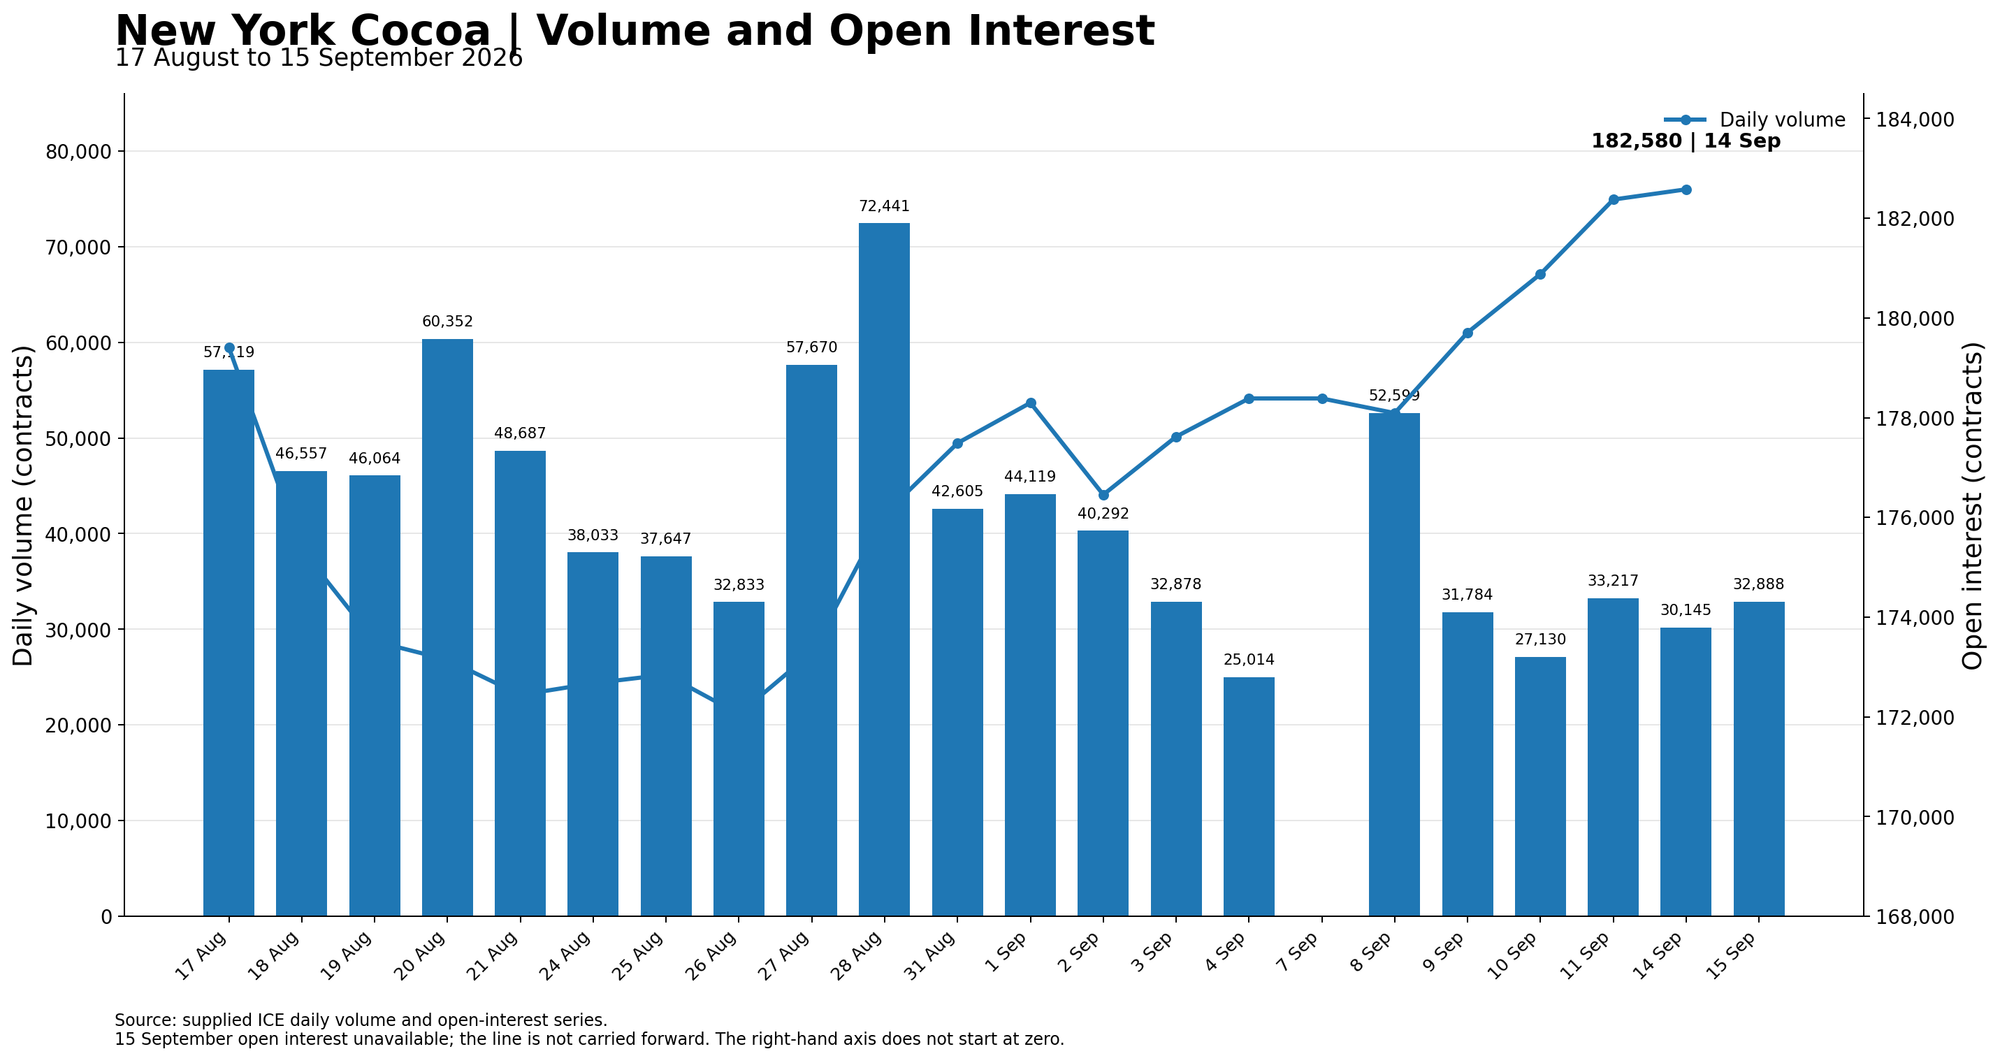
New York cocoa volume increased to 32,888 contracts on 15 September, up 9.1% from 30,145 contracts on 14 September. Even so, turnover remained subdued: volume was about 20.5% below the recent 20-session average of approximately 41,389 contracts, excluding the 7 September zero-volume holiday reading, and 54.6% below the recent peak of 72,441 contracts recorded on 28 August.
The latest available open-interest reading is for 14 September, when OI edged up by 205 contracts from 11 September to 182,580. That left open interest 10,525 contracts, or 6.1%, above the 26 August low of 172,055 and at the highest level in the series shown. Positioning had therefore continued to rebuild into the latest session.
Tuesday’s price decline therefore occurred against a mixed participation backdrop: volume recovered slightly from Monday but remained below average, while 15 September open interest is not yet available. Because of that missing OI reading, the sell-off cannot yet be classified confidently as fresh short selling or long liquidation. If the next OI figure falls, the move would look more consistent with liquidation; if it rises, that would suggest new short exposure accompanying the weaker prices.
London cocoa
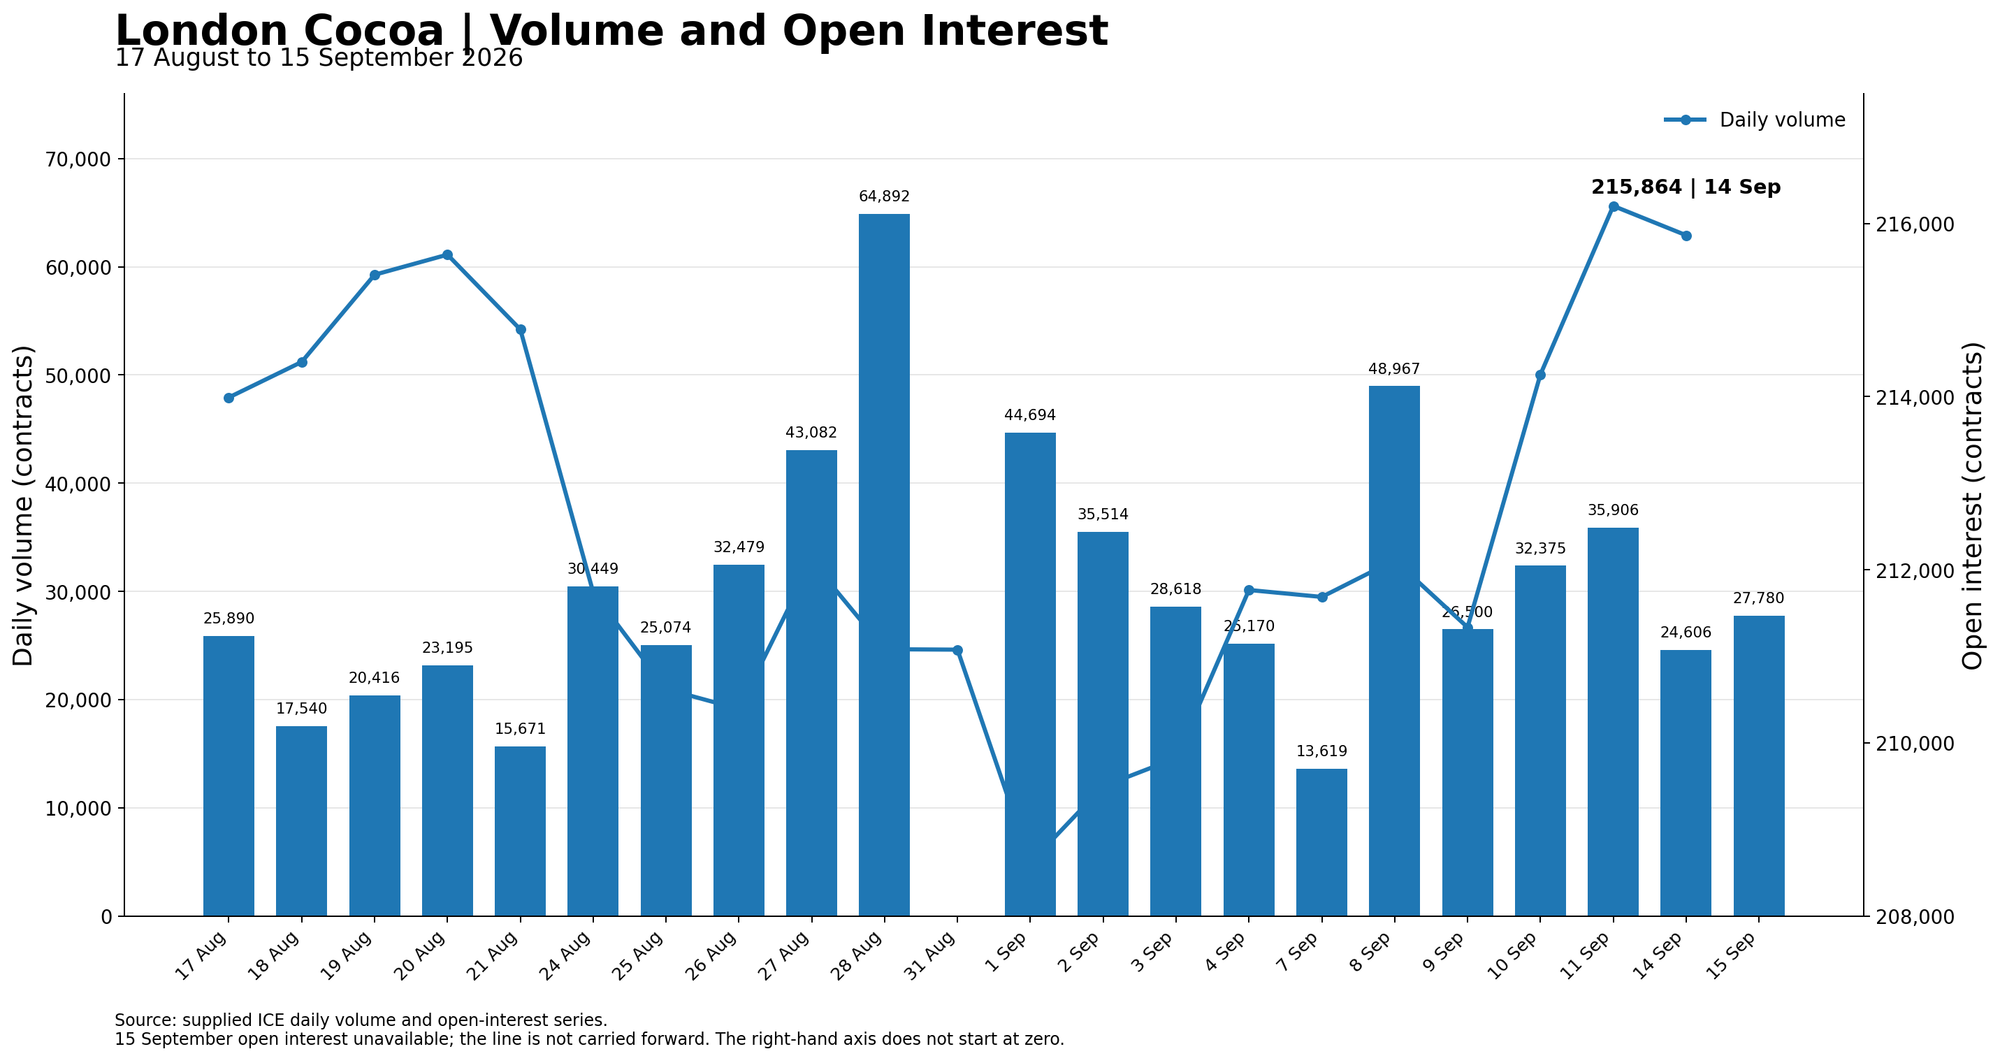
London cocoa volume increased to 27,780 contracts on 15 September, up 12.9% from 24,606 contracts on 14 September. Even with that pickup, activity remained somewhat restrained: volume was about 11.9% below the recent 20-session average of approximately 31,527 contracts, excluding the 31 August zero-volume reading, and 57.2% below the late-August peak of 64,892 contracts.
The latest available open-interest reading is for 14 September, when OI slipped by 339 contracts from 11 September to 215,864. Even after that small pullback, open interest was still 5,471 contracts, or 2.6%, above the 26 August low of 210,393 and remained close to the recent high of 216,203 on 11 September. Positioning therefore stayed relatively firm into mid-September.
Tuesday’s price decline therefore came with a moderate recovery in volume but without same-day open-interest confirmation. Since the OI reading for 15 September is not yet available, it is too early to say whether the move reflected mainly fresh short selling or liquidation by longs. A subsequent rise in OI would suggest new bearish positioning, while a decline would point more toward longs exiting existing exposure.
ICE Cocoa Stocks
| Market | 14 Sep 2026 | 15 Sep 2026 | Change | Change % |
|---|---|---|---|---|
| US | 3,421,126 | 3,421,650 | +524 | +0.02% |
| UK | 1,422,656 | 1,465,313 | +42,657 | +3.00% |
US warehouse stocks were virtually unchanged on 15 September at 3.422 million bags, up just 524 bags, or 0.02%, from the previous session. Certified stocks nevertheless increased by 6,534 bags to 743,979, indicating a modest improvement in deliverable supply.
European ICE stocks showed a much stronger build, reaching 93,780 MT, or 1.465 million bags, on 14 September, up roughly 3.0% from 11 September. The recent inventory rebuild therefore remains considerably stronger in Europe than in the US.
Readers can explore detailed cocoa market datasets, futures statistics, and historical indicators in the CocoaIntel Data Hub:
 Cocoa Intel
Wednesday Trading Setup Dec Contract
December cocoa enters Wednesday with a bearish tactical bias, although late-session stabilization leaves scope for a reflex bounce. Tuesday’s recovery failed at $6,085 before the contract closed at $5,860, in the bottom fifth of the $5,804–$6,085 range, confirming rejection of higher prices. The broader technical structure remains weak: price is below the daily 9- and 21-period moving averages, daily and hourly RSI remain below 50, MACD is negative and OBV has softened. On the intraday timeframe, however, consolidation into the close and improving short-term momentum suggest selling pressure was beginning to ease. Initial resistance sits at $5,930–$5,970; failure to reclaim that zone would keep $5,840–$5,800 exposed. An hourly close below $5,800 on stronger volume would increase the risk of an extension toward $5,750. Conversely, acceptance above $6,000 would reopen $6,050–$6,085, while only sustained trade above $6,110–$6,150 would materially weaken the broader lower-high structure. For Wednesday, the key distinction is whether any rebound develops into genuine acceptance above resistance or remains a corrective move within the prevailing downtrend.
| Catalyst | Current signal | Market implication |
|---|---|---|
| Price trend | Bearish | Lower highs; weak close near session lows |
| Momentum | Bearish / stretched | Downside dominant; reflex-bounce risk increasing |
| Volume | Below 20-day average | Selling lacked exceptional participation |
| Open interest | Elevated; latest 14 Sep | Positioning remained high; 15 Sep OI needed to separate fresh shorts from liquidation |
| Côte d’Ivoire | Risk increasing | Potential disruption to collection and deliveries |
| Ghana | Risk increasing | Financing constraints could slow bean purchasing |
| Brazil | Bearish demand signal | Weaker grinder offtake |
| European stocks | Bearish supply signal | Inventories rebuilding rapidly |
If you notice any discrepancies in these figures or have extra information, please email hello@cocoaintel.com or leave a comment – corrections and additional insights are always welcome.