Cocoa Futures Rebound Sharply as Ghana Crop Risks Intensify (31 July 2026)

September cocoa began the session strongly, opening near 5,150 and rallying approximately 6.8% to an intraday peak around 5,500. The advance lost momentum at that resistance area, and late-morning selling pulled the contract about 1.9% below its high. Prices stabilized near 5,400 and finished around 5,397—roughly 4.8% higher than the opening level, but well below the session peak, showing that sellers remain active around 5,450–5,500.
Ghana crop downgrade becomes the principal bullish catalyst
Ghana’s cocoa regulator expects national production to decline by at least 16% in the 2026/27 season. COCOBOD attributed the deterioration to excessive rainfall during May and June, the risk of El Niño conditions, the cocoa tree’s natural alternate-bearing cycle and a low number of surviving young pods, or cherelles.
Conditions are particularly concerning in the Western and Western North regions, which together account for more than half of Ghana’s production. Swollen shoot disease, ageing farms and the continued conversion of cocoa land to illegal gold mining are adding to the weather-related losses. COCOBOD said it is responding through farm rehabilitation, expanded spraying programmes and the reintroduction of free fertiliser distribution. Côte d’Ivoire’s next crop is also expected to fall by more than 10%, reinforcing the deterioration in the broader West African supply outlook.
Hershey results show resilient revenue but continued volume pressure
Hershey reported better-than-expected second-quarter sales and earnings, but the composition of the result remains important for cocoa demand. Average prices increased by approximately 12%, offsetting an 8% decline in overall sales volumes. Net sales rose 6.6% to $2.79 billion, and the company increased the lower end of its 2026 sales-growth forecast to a range of 4.5%–5.0%.
Ghana approves major reform of the cocoa sector
Ghana’s Parliament approved the Ghana Cocoa Board Bill, 2026, introducing a substantial restructuring of the country’s cocoa financing, marketing and processing framework.
The legislation guarantees farmers at least 70% of the Free-on-Board cocoa price, introduces a domestic financing model for purchasing cocoa and requires at least 50% of Ghanaian cocoa beans to be processed locally. It also strengthens regulation, traceability and protection of cocoa-producing land.
West Africa’s coordinated cocoa price: useful policy, but not an “OPEC for cocoa”
The Pamoja analysis provided by the user argues that the agreement between Ghana and Côte d’Ivoire to align their farm-gate prices and marketing calendars may help reduce cross-border smuggling and provide greater protection to farmers. However, a common announced price alone does not give the two countries durable control over international cocoa prices.
The more important test will be whether the countries coordinate their forward-selling programmes, country differentials and the timing of export sales. Cocoa is perishable and expensive to store, while both governments depend heavily on cocoa export revenue. This limits their ability to withhold large quantities of beans from the market in the manner of an oil-producing alliance.
Futures performance
New York cocoa
| Contract | 30 Jul Close# | 31 Jul Close# | Change | Change % |
|---|---|---|---|---|
| Sep-26 | 5,118 | 5,394 | +276 | +5.4% |
| Dec-26 | 5,253 | 5,537 | +284 | +5.4% |
| Mar-27 | 5,344 | 5,628 | +284 | +5.3% |
| May-27 | 5,364 | 5,642 | +278 | +5.2% |
| Jul-27 | 5,357 | 5,619 | +262 | +4.9% |
| Sep-27 | 5,348 | 5,604 | +256 | +4.8% |
| Dec-27 | 5,301 | 5,552 | +251 | +4.7% |
New York registered a strong recovery, with gains of more than $250 per tonne across every comparable contract. September 2026 rose $276 to $5,394, while December 2026 and March 2027 each gained $284.
The rally gradually moderated toward the deferred part of the curve, but even December 2027 closed 4.7% above Thursday’s level. This confirms that the move represented a broad repricing of the market rather than an isolated front-month rebound.
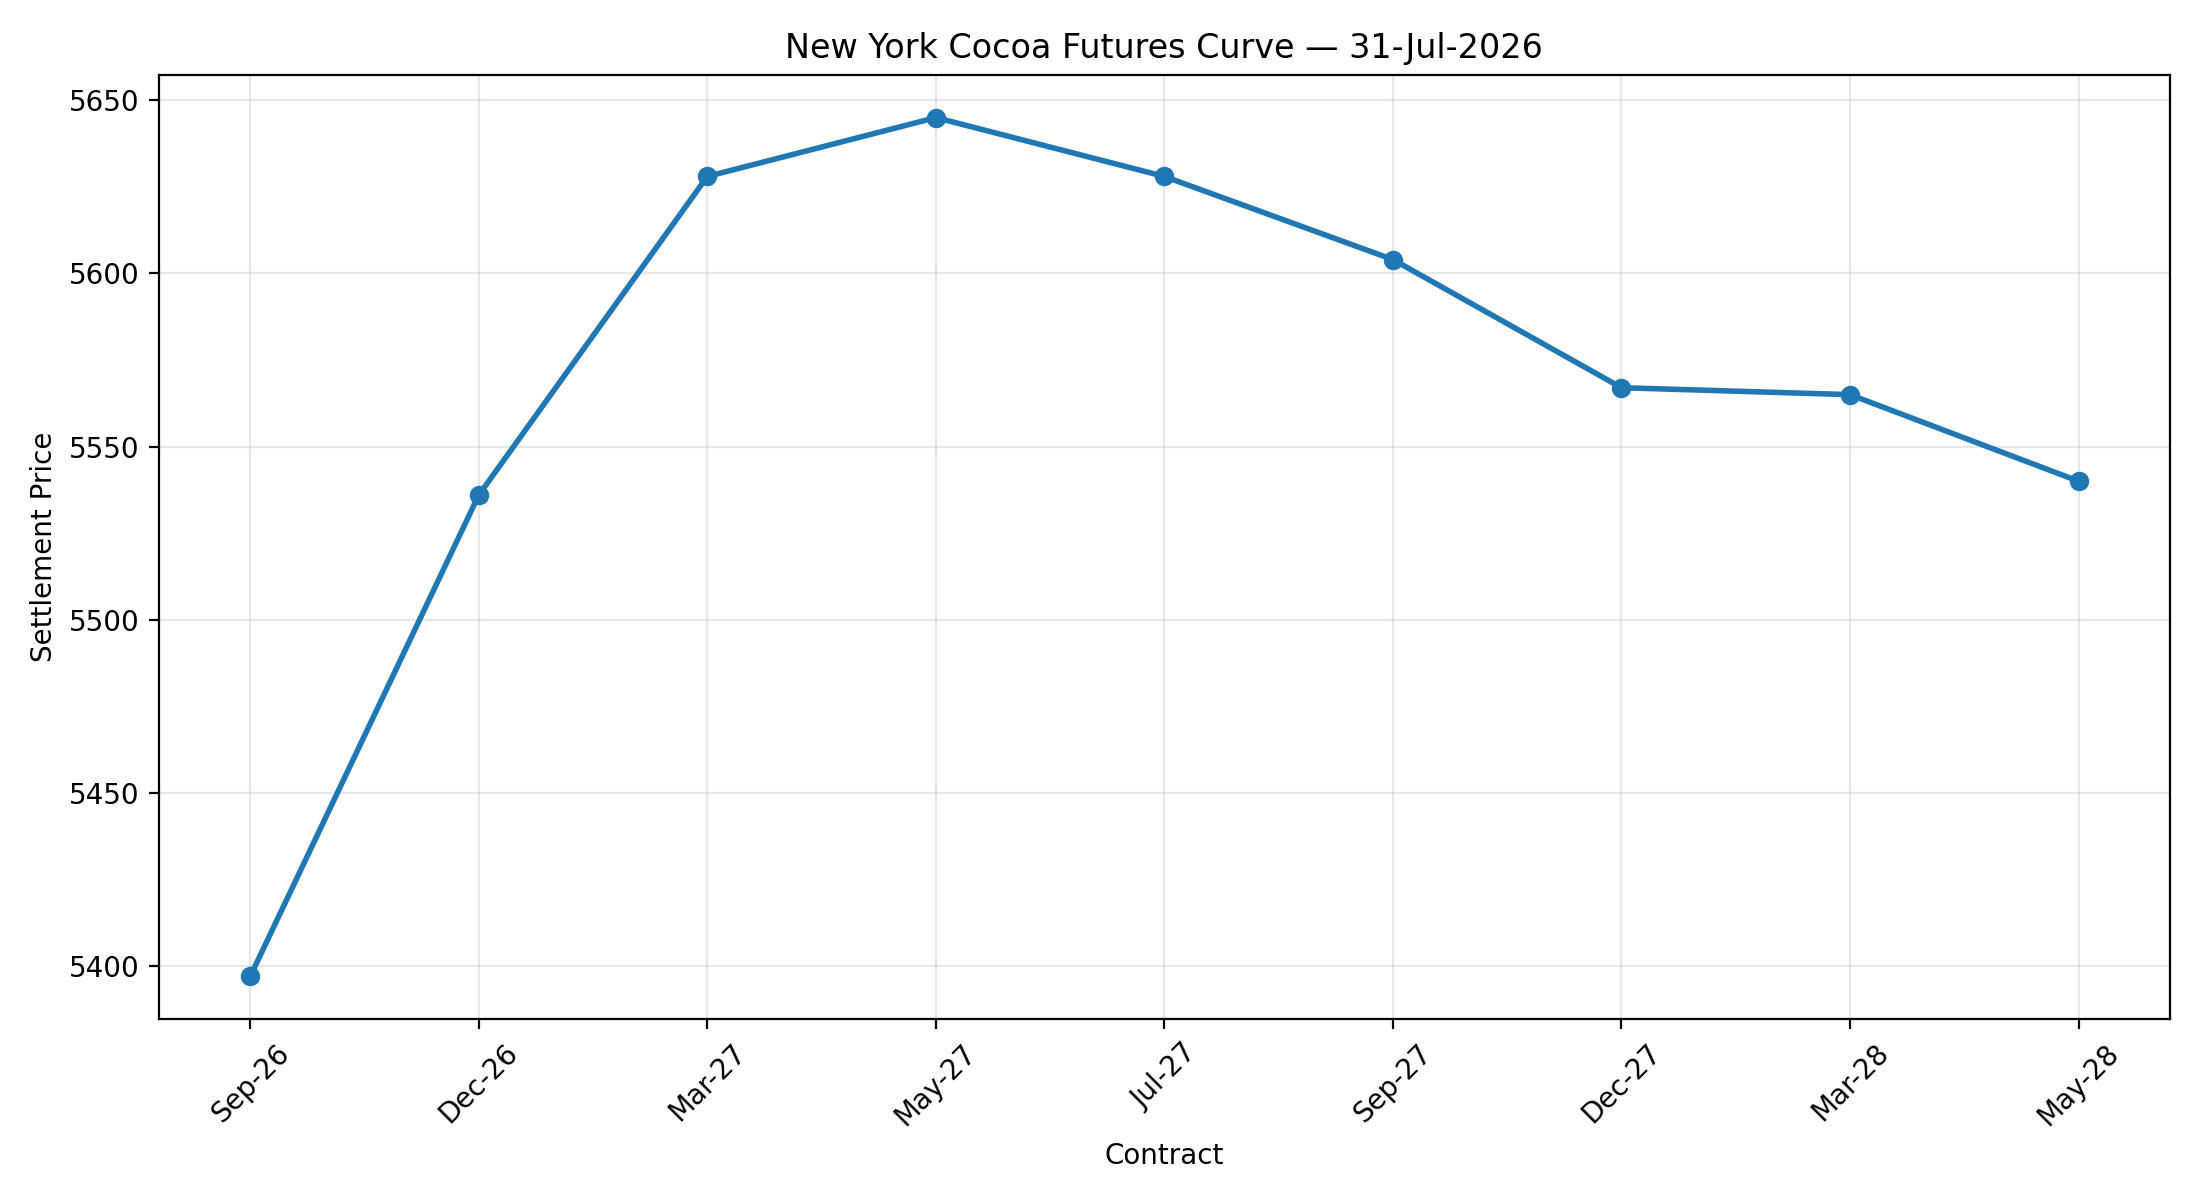
The Sep-26/Dec-26 contango widened slightly from $135 to $143 per tonne because December gained $8 more than September.
London cocoa
| Contract | 30 Jul Close# | 31 Jul Close# | Change | Change % |
|---|---|---|---|---|
| Sep-26 | 3,807 | 4,009 | +202 | +5.3% |
| Dec-26 | 3,865 | 4,058 | +193 | +5.0% |
| Mar-27 | 3,952 | 4,150 | +198 | +5.0% |
| May-27 | 3,957 | 4,157 | +200 | +5.1% |
| Jul-27 | 3,961 | 4,149 | +188 | +4.7% |
| Sep-27 | 3,932 | 4,118 | +186 | +4.7% |
| Dec-27 | 3,905 | 4,088 | +183 | +4.7% |
| Mar-28 | 3,927 | 4,107 | +180 | +4.6% |
| May-28 | 3,908 | 4,091 | +183 | +4.7% |
| Jul-28 | 3,888 | 3,980 | +92 | +2.4% |
London recorded a broad-based recovery across almost the entire curve. September 2026 gained £202 per tonne and returned above £4,000, while December 2026 rose £193 to £4,058. The strongest percentage increase was concentrated in the nearby contracts, with Sep-26 through May-27 advancing approximately 5%.
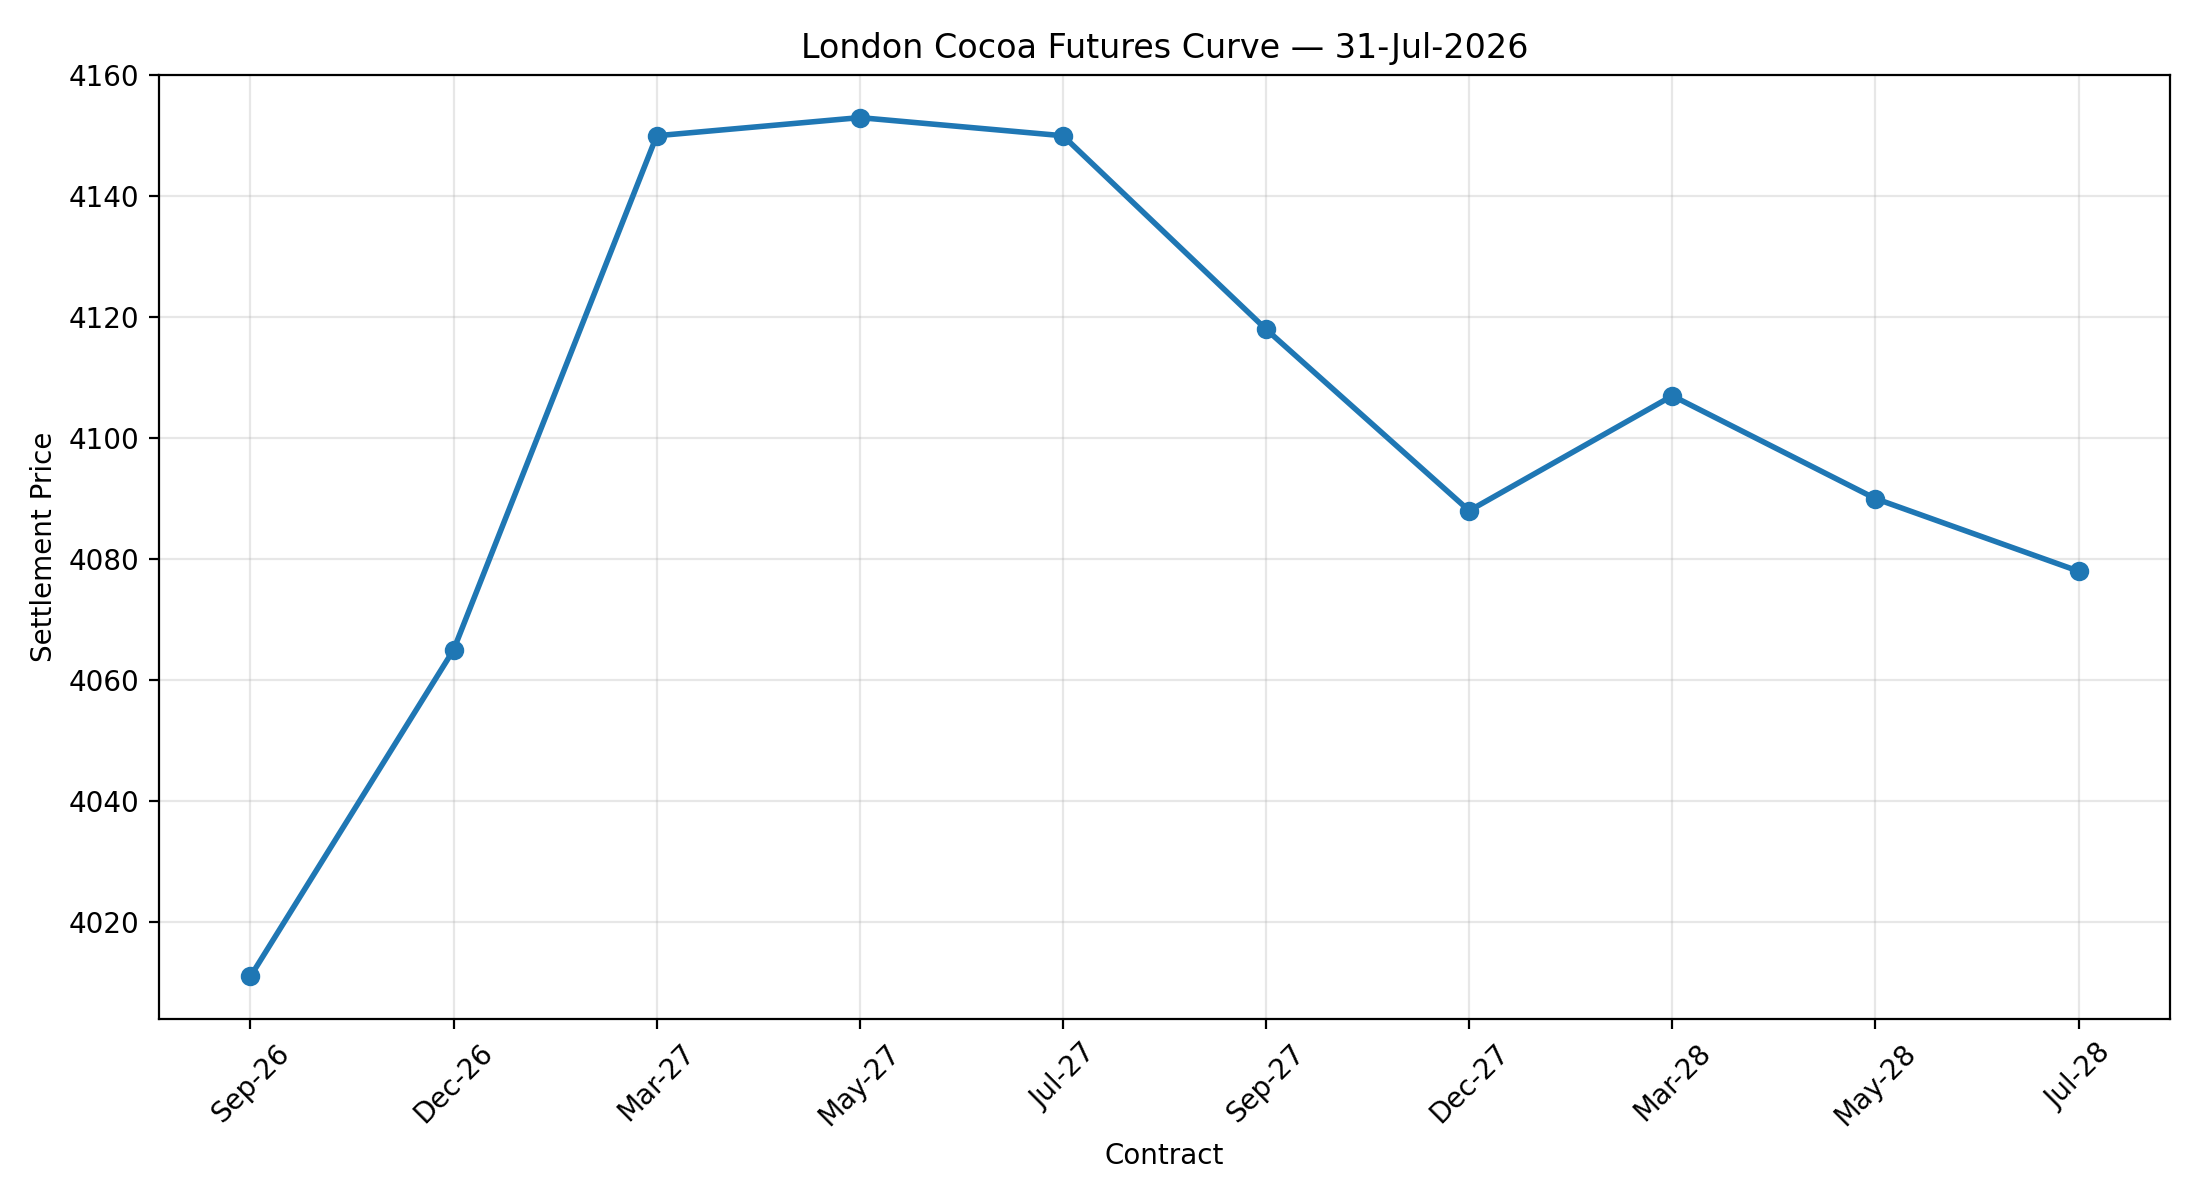
The Sep-26/Dec-26 contango narrowed from £58 to £49 per tonne, indicating that the nearby September contract marginally outperformed December during the rally.
The July 2028 Close# should be treated cautiously. Its £3,980 closing value was substantially below the £4,078 settlement, while all reported volume was classified as spread volume, making the last-traded close less representative of the outright market.
US–UK Spread
(Sep Contract)
$5,394 − (£4,009 x 1.347$/£) =$-6ton (unchanged)
Volume and Open Interest
Trading activity increased sharply during Friday’s rebound. New York volume rose by 26.0% to 45,032 lots, compared with 35,734 lots on Thursday. This was approximately 6% above the recent average since 13 July, indicating stronger-than-normal participation.
New York cocoa
| Trading date | Total volume | Total open interest |
|---|---|---|
| 27 Jul 2026 | 44,052 | 200,321 |
| 28 Jul 2026 | 42,500 | 201,223 |
| 29 Jul 2026 | 50,394 | 204,223 |
| 30 Jul 2026 | 35,734 | 203,762 |
| 31 Jul 2026 | 45,032 | Not yet available |
In London, the increase was even more pronounced. Volume jumped by 74.0% to 37,088 lots, from only 21,311 lots in the previous session. Friday’s turnover was approximately 20% above the July average, showing that the price recovery attracted significantly greater market involvement than Thursday’s decline.
London cocoa
| Trading date | Total volume | Total open interest |
|---|---|---|
| 27 Jul 2026 | 25,486 | 229,839 |
| 28 Jul 2026 | 29,354 | 230,455 |
| 29 Jul 2026 | 26,144 | 227,292 |
| 30 Jul 2026 | 21,311 | 226,686 |
| 31 Jul 2026 | 37,088 | Not yet available |
The latest available figures, for 30 July, showed only modest reductions. London open interest declined by 606 lots to 226,686, while New York open interest fell by 461 lots to 203,762. Because prices declined alongside slightly lower open interest on 30 July, the move was more consistent with modest long liquidation than with aggressive new short selling.
Friday’s substantially higher volume gives the rebound more credibility because it shows that the price increase occurred with broad participation.
Commitment of Traders Analysis
Speculative positioning became more bearish during the week ending 28 July 2026. Non-commercial traders reduced long positions by 1,526 contracts while adding 852 short contracts. This increased their net short position from 13,050 to 15,428 contracts.
| Trader category | Long | Short | Net position | Weekly net change |
|---|---|---|---|---|
| Non-commercial | 24,982 | 40,410 | −15,428 | −2,378 |
| Commercial | 124,701 | 110,486 | +14,215 | +3,079 |
| Non-reportable | 10,334 | 9,122 | +1,212 | −701 |
The non-commercial net short expanded by approximately 18% over the week and was equivalent to about 154,280 tonnes of cocoa. This indicates that speculative traders entered the latter part of the week with a clearly bearish position.
The deterioration came from both sides of the speculative book: traders closed some bullish positions and opened additional bearish positions. This is more bearish than a move caused only by long liquidation.
However, total open interest declined by 6,419 contracts, or 2.4%, to 262,836 contracts. The market was therefore experiencing an overall reduction in positions even as the remaining speculative positioning became more bearish. This suggests a combination of deleveraging, long liquidation and selective new short selling rather than a broad influx of new speculative capital.
Non-commercial spread positions also declined by 4,114 contracts but remained very large at 102,818 contracts, representing approximately 39% of total open interest. These spread positions are generally related to differences between contract months and are not directly bullish or bearish.
Commercial traders increased their net long position to 14,215 contracts, primarily because commercial short positions fell by 3,599 contracts. This may reflect reduced producer or merchant hedging, or a wider restructuring of commercial hedges. It should not automatically be interpreted as evidence of stronger physical cocoa demand.
Exchange Trading Volume
| EXCHANGE | 30 JUL 2026 | 31 JUL 2026 | CHANGE | % CHANGE |
|---|---|---|---|---|
| ICE U.S. Cocoa | 3,361,739 | 3,365,663 | +3,924 | +0.12% |
| ICE Europe Cocoa | 1,148,906 | 1,148,906 | 0 | 0.00% |
| Combined | 4,510,645 | 4,514,569 | +3,924 | +0.09% |
The measure is not a complete regional stock-to-grind ratio, as it includes only exchange-certified cocoa held at U.S. and EU delivery ports and excludes commercial inventories outside the ICE warehouse system. North America NCA grindings cover processors across North America, while ICE U.S. certified stocks are stored at U.S. delivery ports. ECA reports bean usage in European countries and London-certified cocoa is held in European and UK delivery locations.
Readers can explore detailed cocoa market datasets, futures statistics, and historical indicators in the CocoaIntel Data Hub:
 Cocoa Intel
If you notice any discrepancies in these figures or have extra information, please email hello@cocoaintel.com or leave a comment – corrections and additional insights are always welcome.