Cocoa Prices Plunge on Technical Selling (11 August 2026)


Cocoa futures reversed sharply on 11 August as early firmness gave way to sustained selling across both markets. In New York, the September contract traded as high as $5,904 before falling to $5,425 and recording a close of $5,527, down $377, or 6.39%. London followed a similar pattern, reaching £4,330 before declining to £4,003 and ending at a close of £4,062, down £204, or 4.78%. Both contracts finished within the bottom fifth of their daily ranges, indicating that selling pressure remained dominant into the final trades, while increased volume, particularly New York’s period-high turnover showed that the decline attracted substantial participation and more than erased the previous session’s rebound.
No single confirmed fundamental development fully explained Tuesday’s sharp cocoa sell-off. Same-day market commentary attributed the decline to reports of improved growing conditions and renewed flowering in Côte d’Ivoire and Ghana, although no named crop survey or official production upgrade was provided. With US exchange stocks declining, UK stocks unchanged and recent official West African crop outlooks remaining comparatively tight, the magnitude of the fall appears to have reflected a rapid unwinding of weather-risk premium, amplified by technical selling, cross-market repricing and heavy spread and roll activity.
Futures performance
New York cocoa
New York cocoa reversed Monday’s rally with broad, near-parallel losses across the liquid part of the curve.
| Contract | 10 Aug | 11 Aug | Change | Change % |
|---|---|---|---|---|
| Sep-26 | $5,904 | $5,527 | -$377 | -6.39% |
| Dec-26 | $6,018 | $5,637 | -$381 | -6.33% |
| Mar-27 | $6,109 | $5,727 | -$382 | -6.25% |
| May-27 | $6,121 | $5,744 | -$377 | -6.16% |
| Jul-27 | $6,104 | $5,731 | -$373 | -6.11% |
Intraday volatility expanded further. The five nearest contracts traded through ranges of $446–$553 per tonne, compared with $294–$329 on 10 August. September, December and March reached highs exactly equal to their previous close values, while May and July came within $3–$4 of them. The final trades were nevertheless concentrated in the lower part of the day’s ranges: four of the five nearest contracts ended within the bottom 17–21%, while May finished 32% above its low.
Futures curve
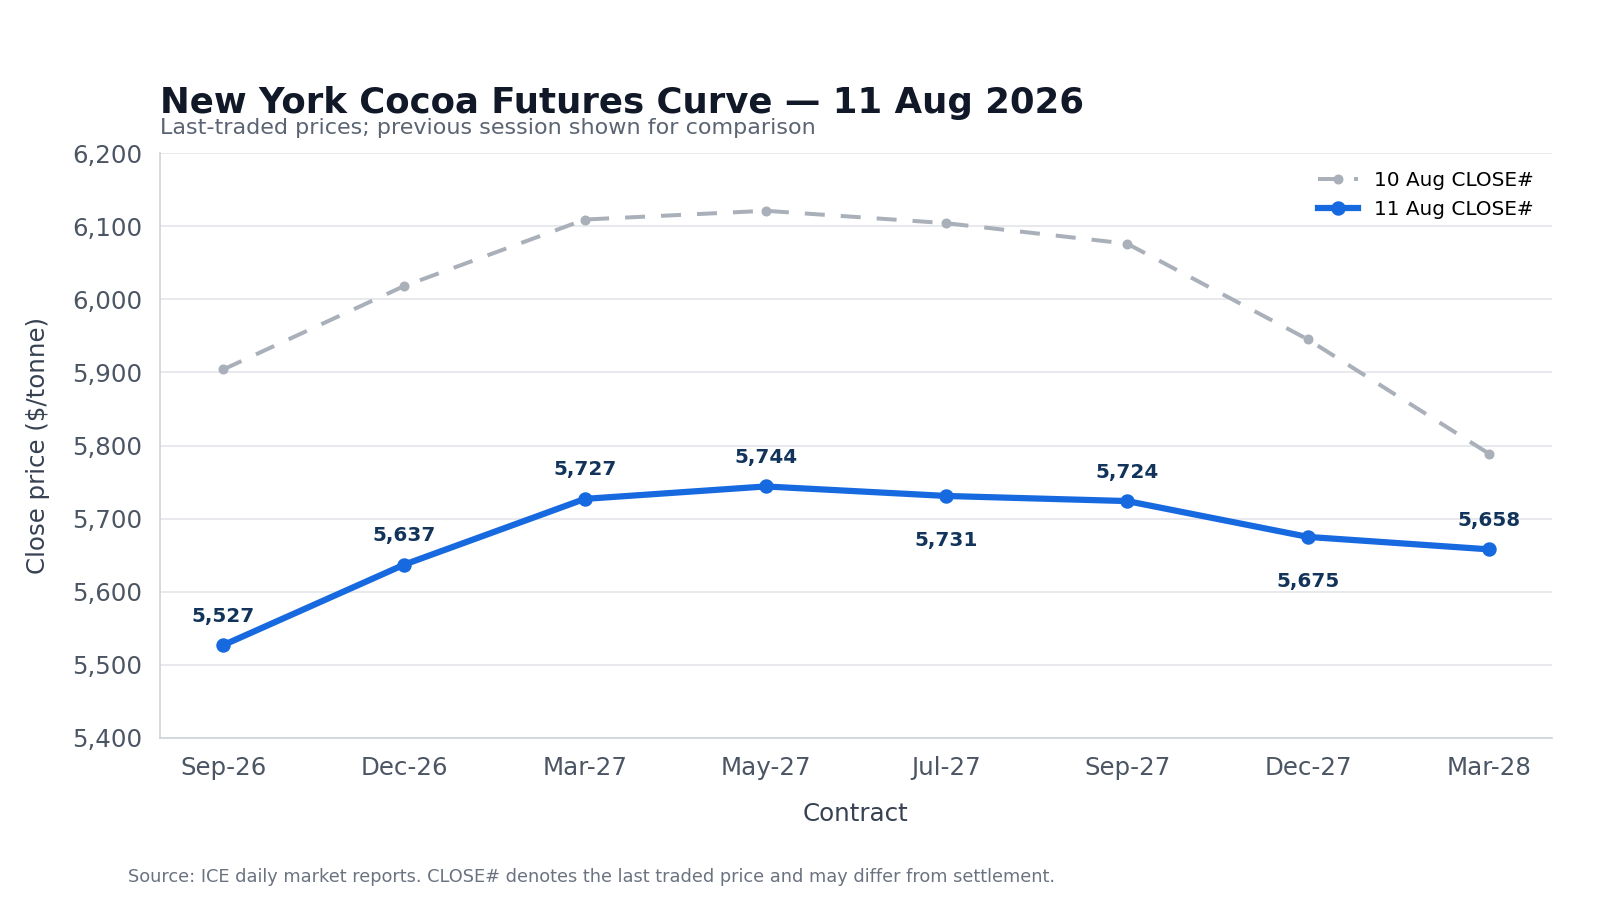
Despite the size of the outright decline, the front of the New York curve changed relatively little. September-to-December contango narrowed by $4 to $110 per tonne, while December-to-March contango narrowed by $1 to $90. May 2027 remained the peak at $5,744, and its $217 premium over September was unchanged from 10 August.
Backwardation beyond May became less pronounced. The May-to-July discount narrowed from $17 to $13, July-to-September from $28 to $7, and September-to-December 2027 from $131 to $49 per tonne.
The deferred adjustment should be interpreted cautiously. Volume fell to 430 contracts in September 2027, 196 in December 2027 and only 33 in March 2028. March 2028 traded through a range of just $5, so the flatter back end may partly reflect asynchronous last trades and limited liquidity rather than a fully synchronized repricing.
London cocoa
London cocoa also reversed sharply, although the one-day percentage losses were smaller than in New York.
| Contract | 10 Aug | 11 Aug | Change | Change % |
| Sep-26 | £4,266 | £4,062 | -£204 | -4.78% |
| Dec-26 | £4,301 | £4,098 | -£203 | -4.72% |
| Mar-27 | £4,405 | £4,203 | -£202 | -4.59% |
| May-27 | £4,404 | £4,211 | -£193 | -4.38% |
| Jul-27 | £4,393 | £4,205 | -£188 | -4.28% |
The first recorded trades and session highs in all five nearby contracts were above the previous day’s close levels. Those gains did not hold. The contracts covered ranges of £306–£331 per tonne, almost double the £161–£177 ranges recorded on 10 August, and their last trades finished only £46–£60 above the session lows—within the bottom 15–18% of their respective ranges.
Futures curve
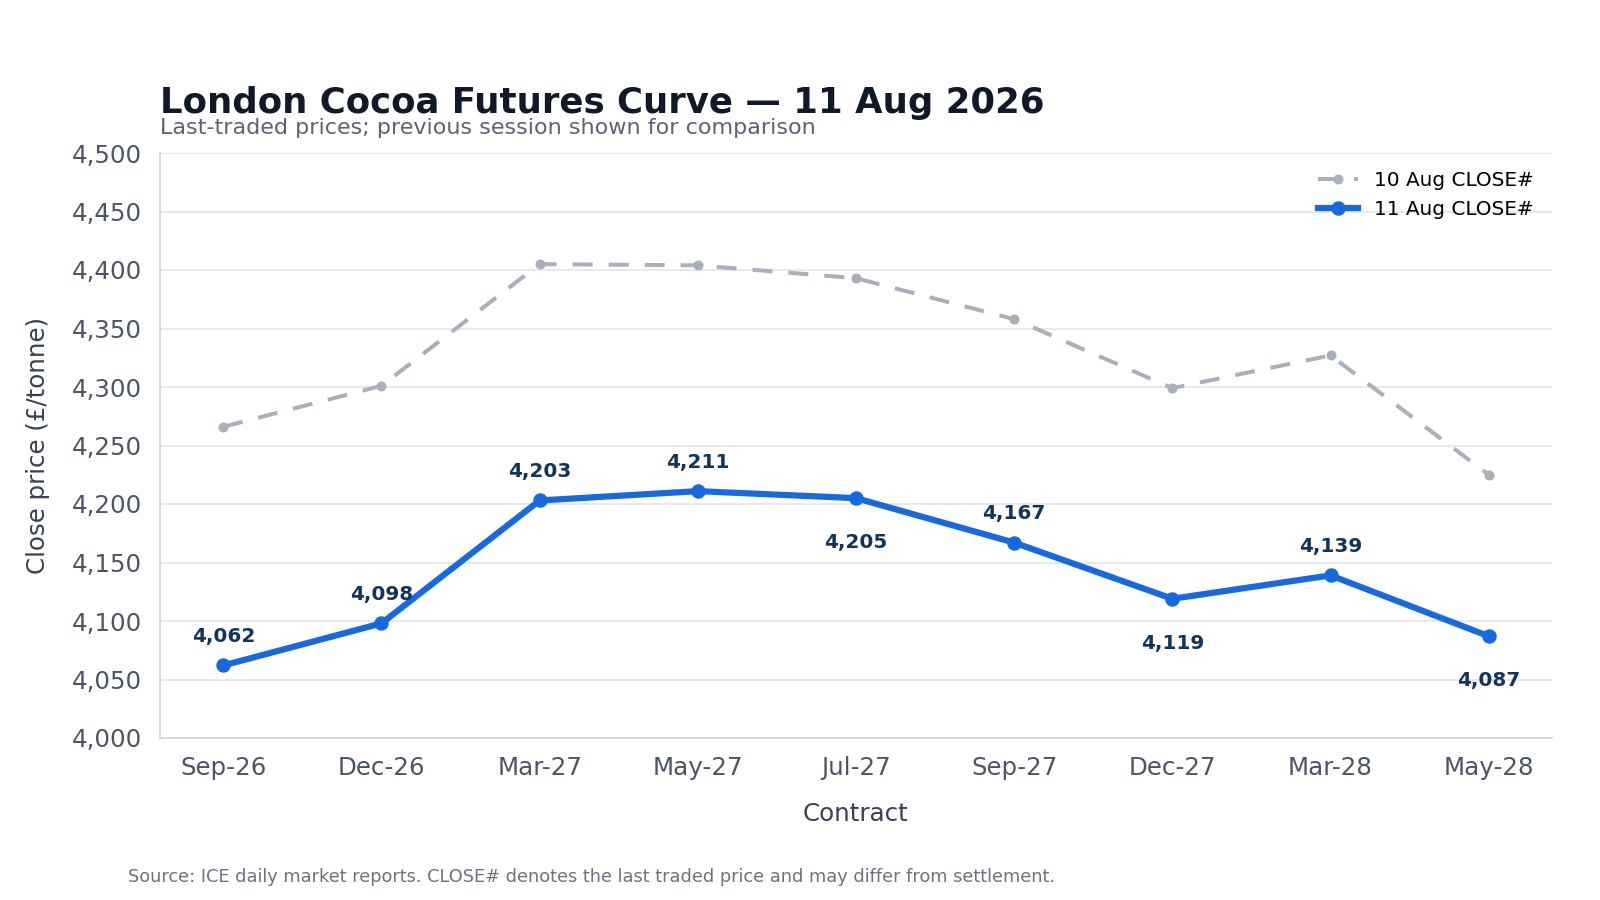
London’s nearby structure also changed only modestly. September-to-December contango widened by £1 to £36 per tonne, and December-to-March widened by £1 to £105. May 2027 moved above March to become the curve’s nearby peak at £4,211. The premium from September to the peak widened from £139 to £149 per tonne.
Farther along the curve, September-to-December 2027 backwardation narrowed from £59 to £48 per tonne, while the March-to-May 2028 discount contracted from £102 to £52. As in New York, liquidity fell sharply in the deferred contracts, limiting the strength of any structural conclusion drawn from those changes.
US–UK Spread
(Sep Contract)
$5,527 − (£4,062 x 1.351$/£) =$43ton (down from $140 ton )
Volume and Open Interest
New York cocoa
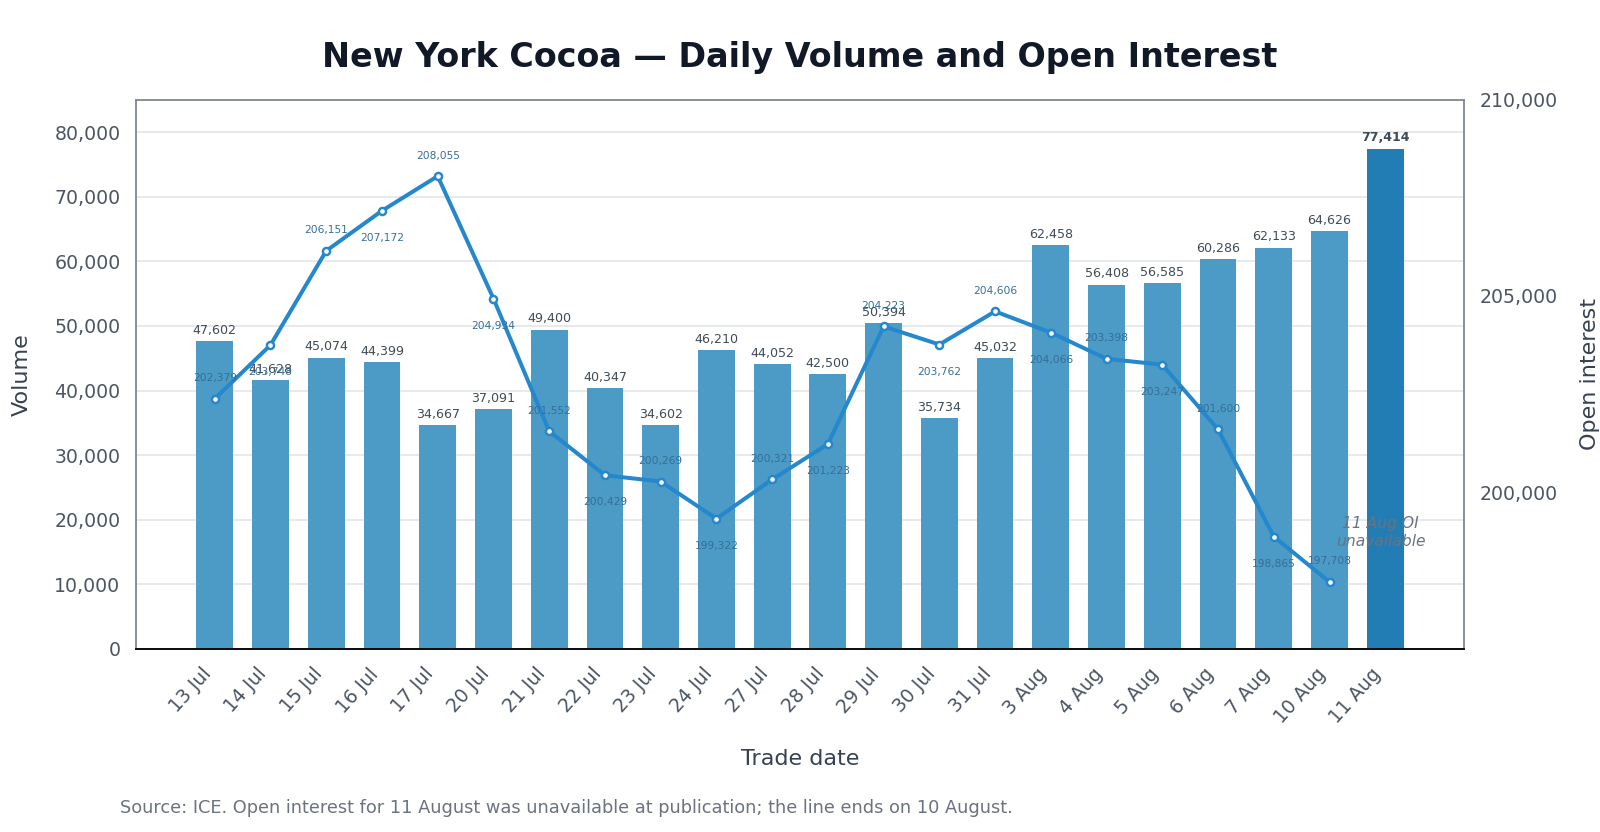
New York cocoa trading activity accelerated sharply on 11 August as prices fell across the curve. Daily volume reached 77,414 contracts, up 12,788 contracts, or 19.8%, from 64,626 on 10 August.
This was the highest daily volume for the past month, exceeding the previous peak, recorded one session earlier by 12,788 contracts, or 19.8%. It also stood 62.4% above the preceding 21-session average of 47,678 contracts and marked a fifth consecutive increase in turnover following 4 August.
The exceptionally heavy activity coincided with declines of 6.11–6.39% across the five nearest contracts. The sell-off therefore attracted substantial participation and did not occur in a thin market.
The latest valid reading was 197,708 contracts on 10 August, down 1,157 contracts, or 0.58%, from 7 August. This was the sixth consecutive decline and the lowest reading in the displayed period. Since 31 July, open interest had fallen by 6,898 contracts, or 3.37%.
London cocoa
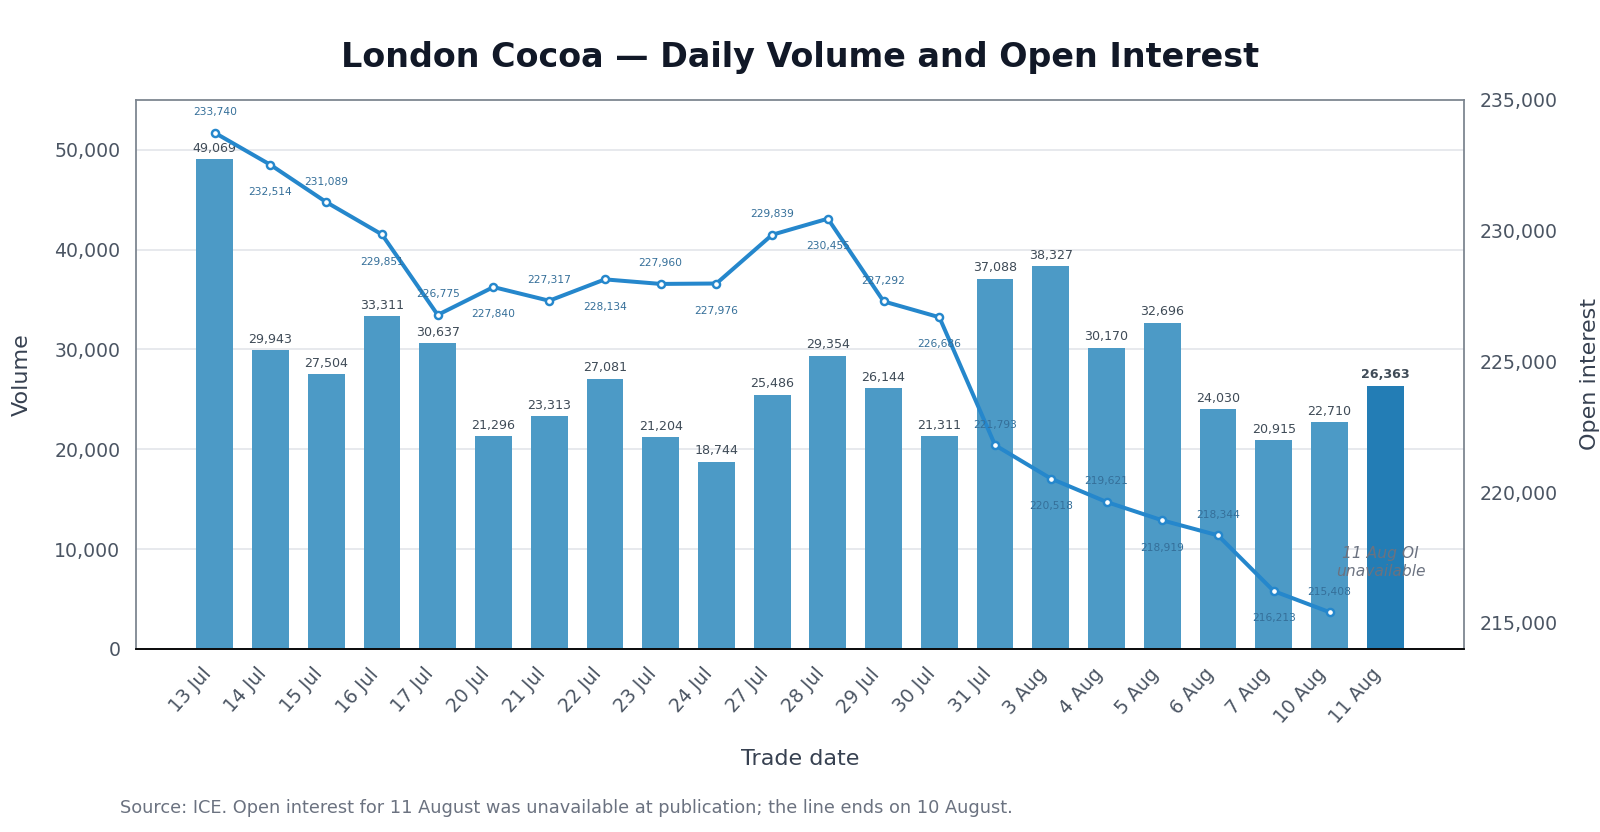
London cocoa trading activity also strengthened on 11 August as prices declined across the curve. Daily volume reached 26,363 contracts, up 3,653 contracts, or 16.1%, from 22,710 on 10 August.
This was the highest daily volume since 5 August, but activity remained 6.2% below the preceding 21-session average of 28,111 contracts. The total ranked only 12th among the 22 displayed sessions, showing that London’s increase in participation was considerably less exceptional than New York’s.
The rise in turnover accompanied declines of 4.28–4.78% across the five nearest contracts. Participation therefore strengthened relative to the previous session, but the volume profile points to a large price move within broadly normal recent trading activity rather than an exceptional surge in turnover.
The latest valid reading was 215,408 contracts on 10 August, down 805 contracts, or 0.37%, from 7 August. This marked a ninth consecutive decline and the lowest level in the displayed period. Since 28 July, open interest had contracted by 15,047 contracts, or 6.53%.
Exchange Trading Volume
| Market | 10 Aug 2026 | 11 Aug 2026 | Change | Change % |
|---|---|---|---|---|
| US | 3,355,277 | 3,344,636 | −10,641 | −0.32% |
| UK | 1,145,938 | 1,145,938 | 0 | 0.00% |
The measure is not a complete regional stock-to-grind ratio, as it includes only exchange-certified cocoa held at U.S. and EU delivery ports and excludes commercial inventories outside the ICE warehouse system. North America NCA grindings cover processors across North America, while ICE U.S. certified stocks are stored at U.S. delivery ports. ECA reports bean usage in European countries and London-certified cocoa is held in European and UK delivery locations.
Readers can explore detailed cocoa market datasets, futures statistics, and historical indicators in the CocoaIntel Data Hub:
 Cocoa Intel
Wednesday Outlook
After Tuesday’s high-volume sell-off, New York cocoa is likely to enter Wednesday with a bearish but short-term oversold bias. The September contract’s close at $5,527 left it near the session low and below its short-term hourly and daily moving averages, suggesting that early rebounds may struggle unless prices first recover above $5,600–$5,650, with $5,725 forming the next resistance area. Oversold intraday stochastic readings leave room for a technical bounce or consolidation, but weakening MACD and OBV signals keep downside risk elevated. A sustained break below $5,500 would bring Tuesday’s $5,425 low back into focus, whereas holding this support zone could produce volatile two-way trading before a clearer direction emerges.
If you notice any discrepancies in these figures or have extra information, please email hello@cocoaintel.com or leave a comment – corrections and additional insights are always welcome.