Cocoa Rallies on Heavy Volume as Ivory Coast Crop Signals Diverge (10 August 2026)


New York cocoa staged a forceful intraday recovery on 10 August, reversing early weakness to finish sharply higher near the top of the session’s range. The September 2026 contract fell as low as $5,608 per tonne before rebounding to a high of $5,930 and closing at $5,904, up $180, or 3.14%, from 7 August. The advance was accompanied by exceptionally strong participation, with total volume reaching 64,626 contracts, the highest level recorded over the displayed one-month period.
Ivory Coast arrivals remain well above last season
Cocoa arrivals at Ivory Coast’s ports reached an estimated 1.992 million tonnes by 9 August, 21.2% above the corresponding period last season.
However, deliveries slowed sharply during the latest reporting week. Around 4,000 tonnes arrived between 3 and 9 August, compared with 11,000 tonnes during the same week last year. The cumulative figure therefore confirms a substantial recovery in 2025/26 supply, while the weaker weekly flow indicates that the tail end of the mid-crop is losing momentum.
Cold and overcast weather threatens the next main crop
Attention is increasingly shifting from current-season availability to the outlook for the 2026/27 main crop.
Farmers across most of Ivory Coast’s cocoa-growing regions reported below-average rainfall, persistent cloud cover and unusually cool conditions. Although plantations continue to carry cherelles and small pods, growers said there were fewer large, nearly mature pods than would normally be expected ahead of the September opening.
Continued cold weather and insufficient sunshine could slow pod development, affect bean quality and result in limited early-season volumes. Improved conditions in September and October could still support a crop broadly comparable with last season, but the current weather pattern has increased uncertainty.
Futures performance
New York cocoa
New York cocoa recorded a strong advance on 10 August, reversing the relatively subdued performance seen at the end of the previous week. All five nearest contracts finished sharply above their 7 August closing levels, with gains of approximately 2.9–3.1%.
| Contract | 7 Aug | 10 Aug | Change | Change % |
|---|---|---|---|---|
| Sep-26 | $5,724 | $5,904 | +$180 | +3.14% |
| Dec-26 | $5,847 | $6,018 | +$171 | +2.92% |
| Mar-27 | $5,936 | $6,109 | +$173 | +2.91% |
| May-27 | $5,941 | $6,121 | +$180 | +3.03% |
| Jul-27 | $5,934 | $6,104 | +$170 | +2.86% |
Intraday volatility remained exceptionally high despite the broadly positive close-to-close performance. The five nearest contracts traded through ranges of approximately $294–$329 per tonne.
The contracts finished around 92–97% of the way through their respective daily ranges. Final prices were only $8–$26 below the session highs while remaining $286–$304 above the lows.
Futures curve
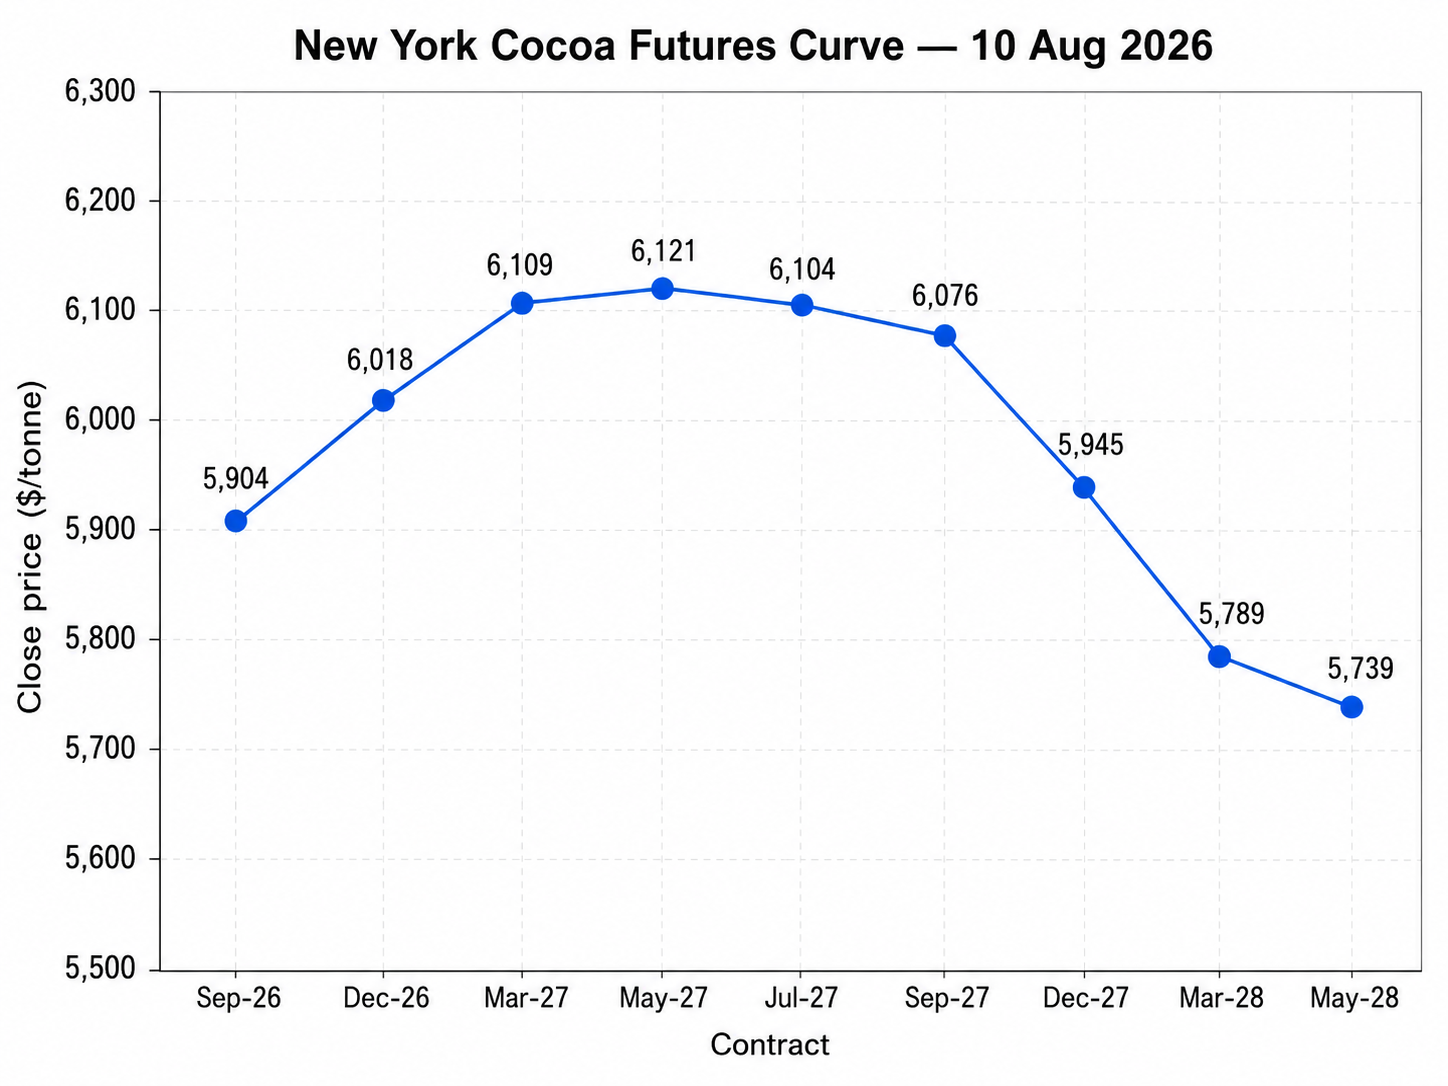
The front of the New York futures curve remained in contango, but its shape shifted materially. The September-to-December premium narrowed from $123 per tonne on 7 August to $114 on 10 August, while the September-to-May spread held at $217 because both contracts gained $180. December-to-March widened slightly from $89 to $91, and March-to-May from $5 to $12, leaving May 2027 at the curve’s peak of $6,121.
Backwardation deepened beyond May. July traded $17 below May, compared with $7 on 7 August. September 2027 moved from an $11 premium over July to a $28 discount, a $39 reversal, while the September-to-December 2027 backwardation widened from $79 to $131 per tonne.
The decline became much steeper in the deferred contracts. December 2027 closed at $5,945, March 2028 at $5,789 and May 2028 at $5,739, expanding the December-to-March backwardation from $9 to $156.
The curve’s peak shifted forward from September 2027 to May 2027, creating a more pronounced hump followed by progressively stronger backwardation. The far end should be interpreted cautiously, however, as March and May 2028 traded only 50 and 26 contracts respectively, and their final close prices were materially below settlement.
London cocoa
London cocoa also advanced on 10 August, although the gains were considerably smaller than those recorded in New York. All five nearest contracts finished above their 7 August closing levels, rising by approximately 0.5–0.7%.
| Contract | 7 Aug | 10 Aug | Change | Change % |
|---|---|---|---|---|
| Sep-26 | £4,238 | £4,266 | +£28 | +0.66% |
| Dec-26 | £4,276 | £4,301 | +£25 | +0.58% |
| Mar-27 | £4,378 | £4,405 | +£27 | +0.62% |
| May-27 | £4,378 | £4,404 | +£26 | +0.59% |
| Jul-27 | £4,370 | £4,393 | +£23 | +0.53% |
Intraday volatility remained substantial. The five nearest London contracts traded through daily ranges of approximately £161–£177 per tonne.
Final prices finished around 80–91% of the way through their respective daily ranges. The contracts closed £15–£32 below their session highs while remaining £129–£151 above their lows.
Futures curve
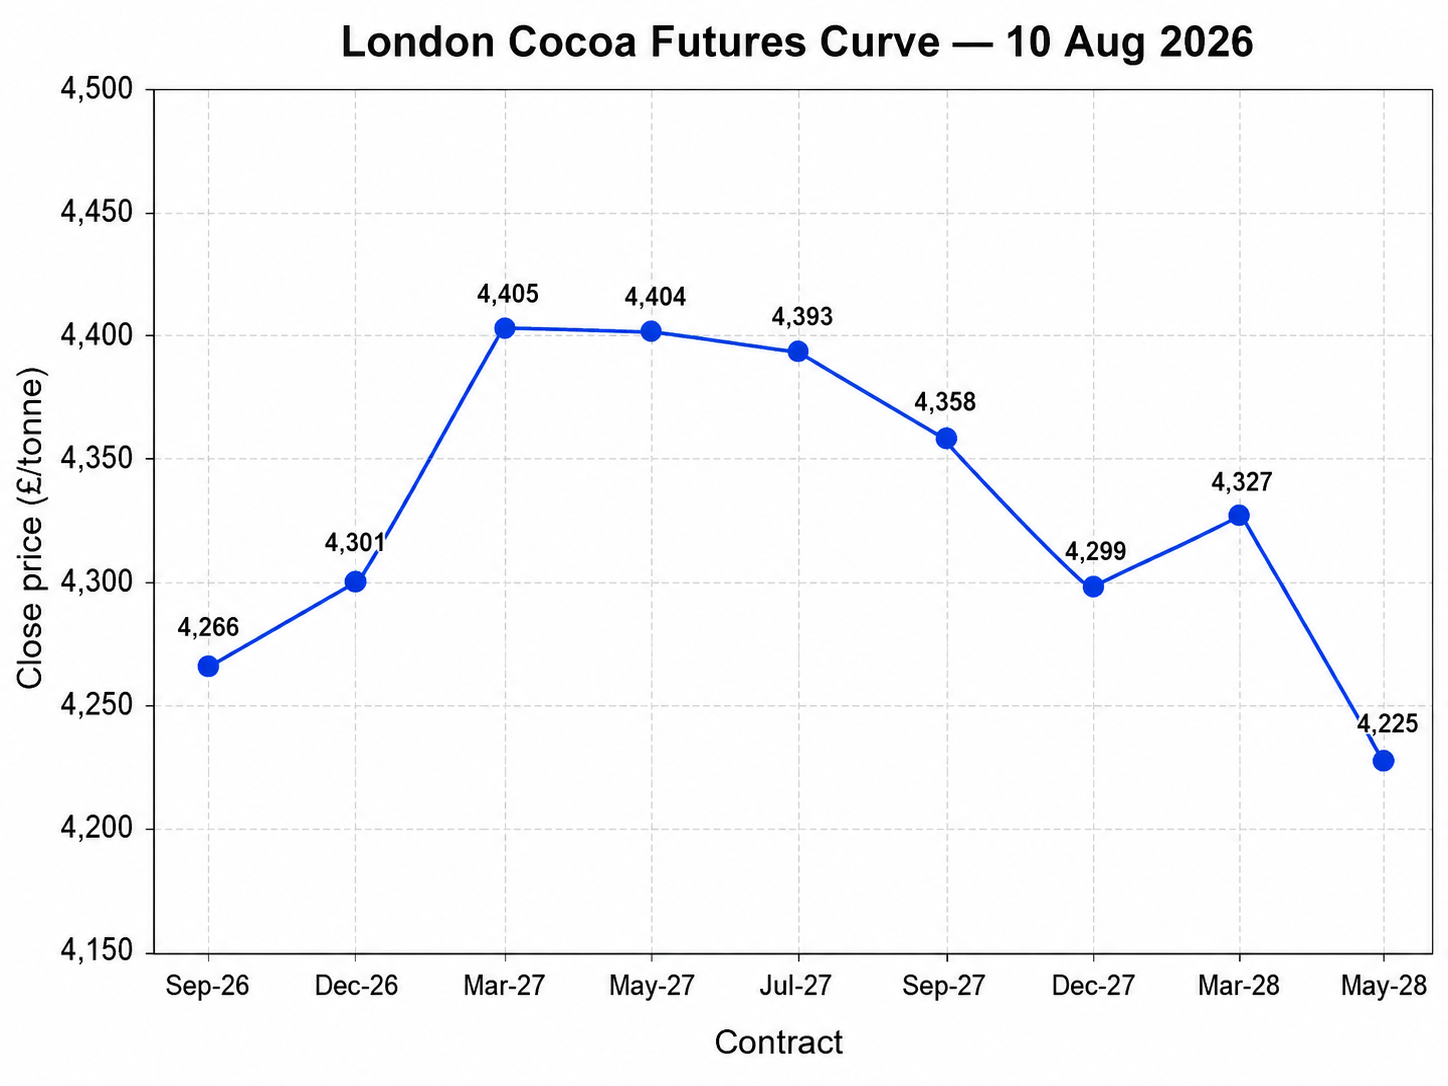
The front of the London futures curve remained in contango, although the structure became more backwardated further out. The September-to-December premium narrowed from £38 per tonne on 7 August to £35 on 10 August, while the September-to-May spread eased from £140 to £138.
March 2027 closed at £4,405, only £1 above May, shifting the nearby peak marginally from a joint March-May high to March alone. July traded £11 below May, compared with an £8 discount on 7 August, while September 2027 moved to a £35 discount to July from £30 previously.
Backwardation strengthened more noticeably further along the curve. The September-to-December 2027 spread widened from £35 to £59 per tonne. March 2028 remained £28 above December, but the curve then fell sharply to May 2028 at £4,225, expanding the March-to-May backwardation from £31 to £102.
London retained its front-end contango and broad March-May peak, but backwardation became more pronounced beyond mid-2027. The far end should be interpreted cautiously, however, as the May 2028 close price was £55 below settlement and may overstate the underlying decline because it reflects the final transaction rather than a synchronized valuation across contracts.
US–UK Spread
(Sep Contract)
$5,904 − (£4,266 x 1.351$/£) =$140ton (up from $15 ton )
Volume and Open Interest
New York cocoa
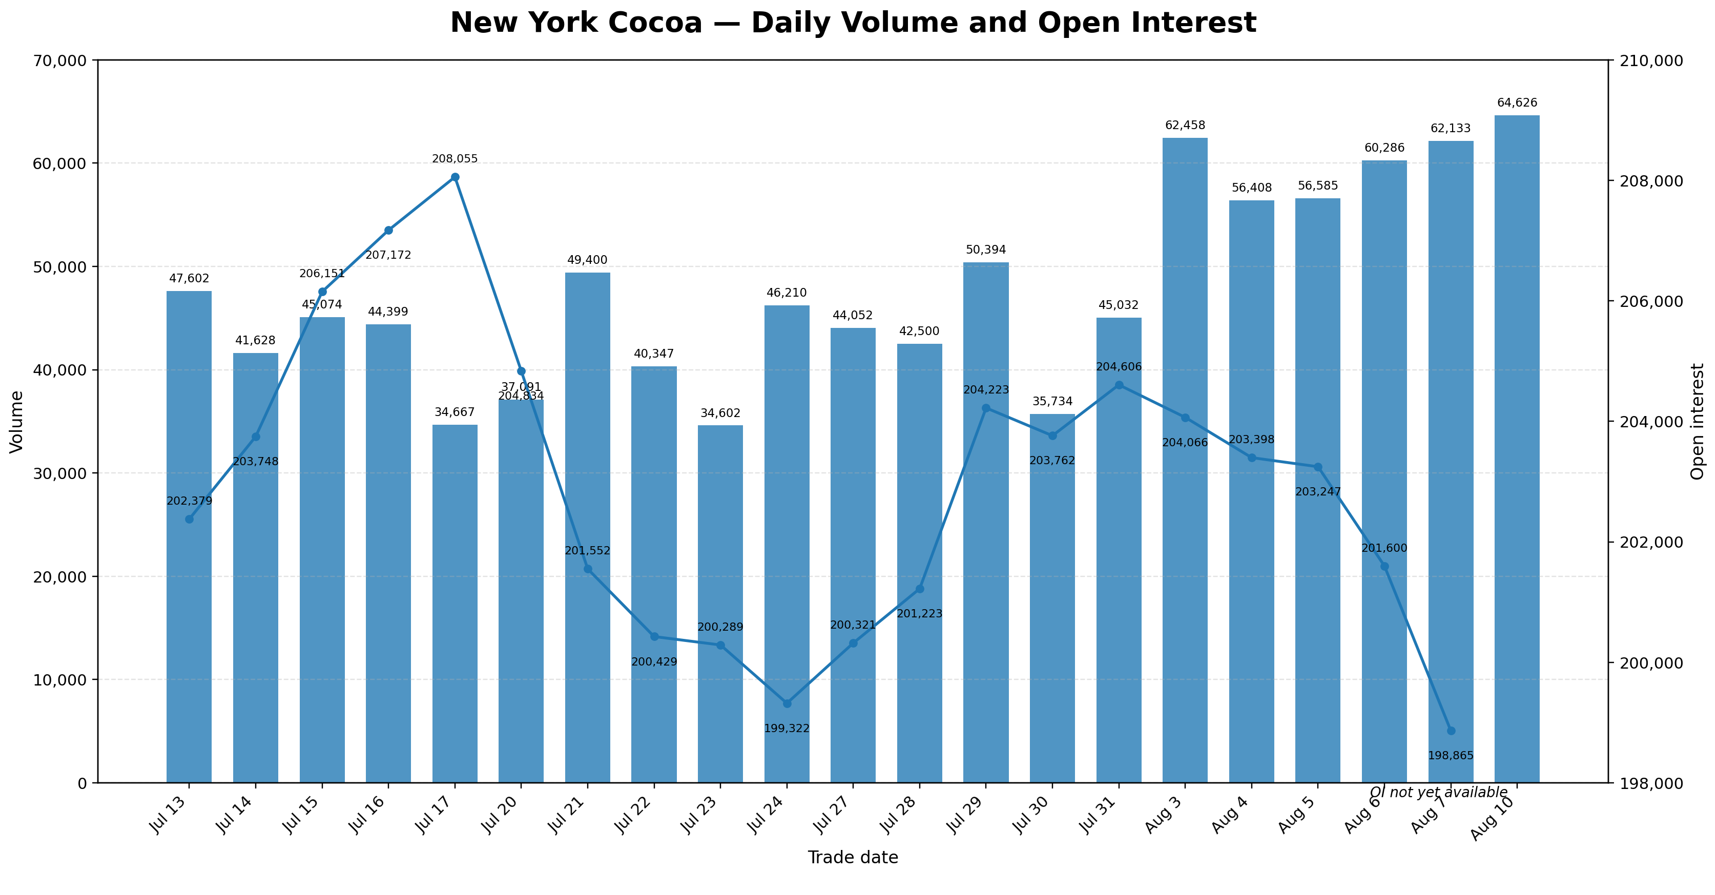
New York cocoa trading activity strengthened further on 10 August as prices rebounded sharply across the curve. Daily volume reached 64,626 contracts, up 2,493 contracts, or 4.0%, from 62,133 on 7 August.
This was the highest daily volume over the past month, exceeding the previous peak of 62,458 contracts recorded on 3 August by 2,168 contracts, or 3.5%.
Unlike 7 August, when heavy turnover accompanied relatively limited price changes, the 10 August session combined record volume with gains of approximately 2.9–3.1% across the five nearest contracts. The rebound therefore attracted substantial participation rather than occurring in a thin market.
The latest available Open Interest reading was 198,865 contracts on 7 August, down 2,735 contracts, or 1.4%, from 201,600 on 6 August. This marked a fifth consecutive decline from 204,606 contracts on 31 July, producing a cumulative reduction of 5,741 contracts, or 2.8%.
Open interest consequently fell below 200,000 contracts and reached its lowest level in the displayed period. Combined with the exceptionally high trading volumes recorded during the week, this indicates that a significant proportion of the activity through 7 August involved the liquidation or closure of existing positions.
London cocoa
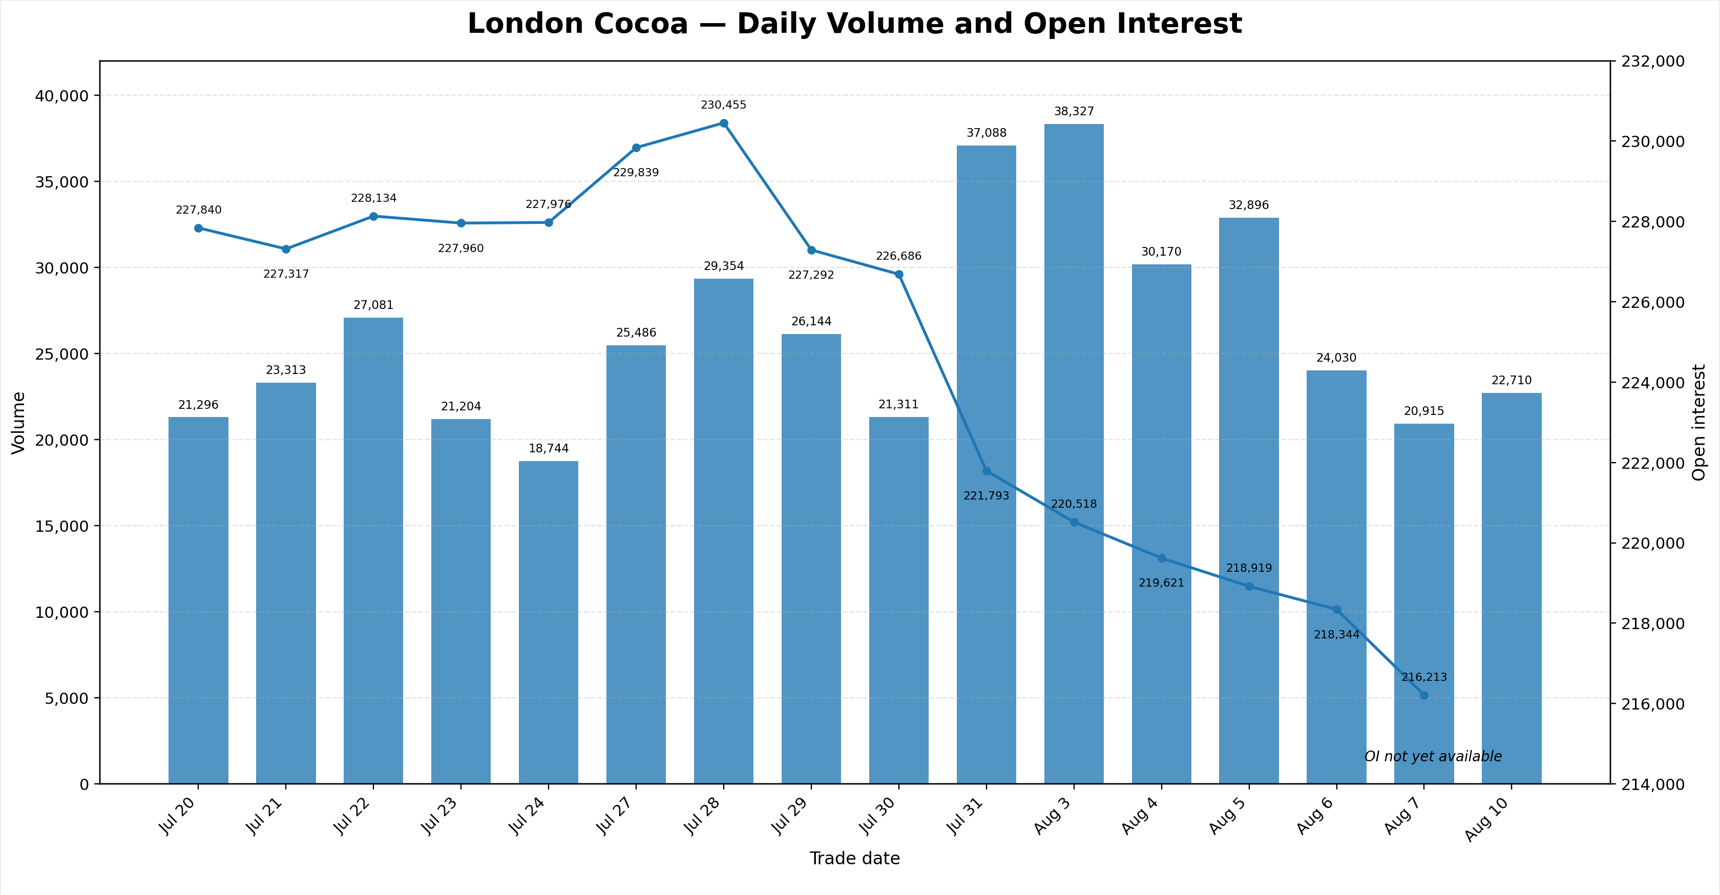
London cocoa trading activity recovered modestly on 10 August as the nearest contracts finished moderately higher. Daily volume reached 22,710 contracts, up 1,795 contracts, or 8.6%, from 20,915 on 7 August.
Despite the day-on-day increase, turnover remained relatively subdued. Volume was approximately 14.2% below the average of the preceding 15 sessions and 40.7% below the recent peak of 38,327 contracts recorded on 3 August.
The gains of approximately 0.5–0.7% across the five nearest contracts therefore occurred with considerably less participation than the much stronger New York rebound. This suggests that buying interest improved, but the move did not attract the same degree of market engagement seen in the US contract.
The latest available Open Interest reading was 216,213 contracts on 7 August, down 2,131 contracts, or 1.0%, from 218,344 on 6 August.
This was the eighth consecutive decline from the recent high of 230,455 contracts recorded on 28 July. Over that period, OI fell by 14,242 contracts, or 6.2%, reaching its lowest level in the displayed series. Since 31 July alone, the reduction amounted to 5,580 contracts, or 2.5%.
The persistent contraction in OI indicates that recent London activity has been dominated by position reduction rather than an expansion of market exposure. With 10 August volume still below average and current OI unavailable, it is not yet possible to determine whether the recovery attracted meaningful new buying or was driven primarily by short covering.
Exchange Trading Volume
The measure is not a complete regional stock-to-grind ratio, as it includes only exchange-certified cocoa held at U.S. and EU delivery ports and excludes commercial inventories outside the ICE warehouse system. North America NCA grindings cover processors across North America, while ICE U.S. certified stocks are stored at U.S. delivery ports. ECA reports bean usage in European countries and London-certified cocoa is held in European and UK delivery locations.
Readers can explore detailed cocoa market datasets, futures statistics, and historical indicators in the CocoaIntel Data Hub:
 Cocoa Intel
Tuesday Outlook
September 2026 is likely to retain a constructive but volatile bias on Tuesday. Hourly and intraday momentum strengthened into the close, with price holding above the short-term moving averages, MACD turning more positive and OBV improving. A sustained move above $5,930 would bring the psychological $6,000 level into focus, followed by resistance around $6,050–$6,120. However, short-term oscillators are approaching overbought territory, so some early consolidation or profit-taking remains possible. Initial support lies around $5,800, followed by $5,600; holding above this area would preserve the recovery, while a break below $5,600 would weaken the immediate bullish structure.
If you notice any discrepancies in these figures or have extra information, please email hello@cocoaintel.com or leave a comment – corrections and additional insights are always welcome.