Cocoa Rebounds as Ghana Crop Risks Offset Rising Exchange Stocks (28 July 2026)


Price Action
New York September cocoa experienced a highly volatile session on 28 July. The contract opened at 5,150 and initially traded within a relatively narrow range before selling pressure intensified during the European morning. Prices fell rapidly through the 5,100 and 5,050 levels, briefly breaking below the psychological 5,000 threshold and reaching an intraday low of 4,992.
The decline was followed by a strong reversal. Buying emerged around the session low, allowing September cocoa to recover above 5,100 before momentum accelerated later in the day. The contract moved through 5,150 and reached an intraday high of 5,233, representing a rebound of 241 points from the low.
Prices consolidated near the upper end of the daily range during the final part of the session, generally holding between 5,180 and 5,220. September finished at a last-traded price of 5,206, up 50 points or 0.97% from the previous close, while the official settlement was 5,201, an increase of 101 points.
The price action represented a clear rejection of levels below 5,000 and showed that buyers were prepared to enter after the sharp early decline. Nevertheless, the contract remained below several important short-term moving averages, meaning that the recovery should still be considered a technical rebound rather than confirmation of a broader bullish trend reversal.
Ghana’s Next Cocoa Crop Faces Growing Weather and Land-Use Risks
Concerns over Ghana’s 2026/27 cocoa crop are increasing as adverse weather and the continued loss of productive farmland threaten output in several important growing areas.
According to Reuters reporting published on 28 July, farmers in parts of western Ghana are seeing weaker pod development following an extended period of heavy rainfall. Conditions appear particularly challenging in the Western and Western North regions, which form the core of the country’s cocoa-producing belt.
Persistent wet weather creates multiple risks for cocoa production. Excess moisture can disrupt flowering and pod formation while also encouraging the spread of black pod disease. Where disease pressure is not controlled quickly, a significant share of developing pods can be lost before harvest.
Crop conditions are not equally weak across the entire country. Reports from the Central and Eastern regions suggest that pod formation remains comparatively healthier, providing some potential support to national production. However, stronger performance in these areas may not fully compensate for losses if output declines substantially in the larger western growing regions.
The weather problem is being compounded by a longer-term reduction in Ghana’s productive cocoa area. Cocoa farms continue to be converted for illegal mining and alternative agricultural uses, including rubber production. Unlike a temporary weather-related setback, the removal of mature cocoa trees reduces production capacity for several seasons and requires considerable time and investment to reverse.
Ghanaian industry groups and regulators are therefore seeking stronger measures to protect cocoa farms. Proposed responses reportedly include tougher sanctions for illegal land clearing, improved compensation for affected growers and replanting requirements intended to restore areas removed from cocoa cultivation.
The latest concerns from Ghana follow similarly cautious crop assessments in Ivory Coast. Weak production across both countries would materially tighten the 2026/27 global supply outlook because they remain the two most important cocoa origins.
Mondelēz Reports Improving Volumes but Cocoa Costs Remain a Margin Pressure
Mondelēz International released its second-quarter results on 28 July, providing an important update on chocolate and biscuit demand. The company reported net revenue of $9.36 billion, an increase of 4.1% from the previous year, while organic revenue grew by 2.2%. Volume and product mix contributed 0.7 percentage points to growth, indicating that the company’s performance was not driven exclusively by price increases.
Demand varied significantly between regions. North American organic revenue increased by 3.4%, supported by a 1.2% improvement in volume and mix. Asia, the Middle East and Africa recorded organic growth of 7.1%, including a strong 5.2% contribution from volume and mix. Latin America also expanded, although its growth remained primarily pricing-led.
Europe remained the weakest part of the business. Organic revenue declined by 3.5%, with volume and mix falling by 2.1% and pricing contributing a further negative 1.4%. This weakness is consistent with the softer European chocolate-demand environment reflected in the region’s declining cocoa grindings.
Adjusted earnings reached $0.73 per share, exceeding the market consensus reported by Reuters, while quarterly revenue also surpassed analysts’ expectations. Mondelēz increased its full-year organic revenue expectation to approximately 2%, from its previous range of flat to 2% growth.
Despite the improvement in revenue and volumes, raw-material expenses continued to affect profitability. The company’s adjusted operating margin declined by 120 basis points to 13.1%, with higher input costs, increased administrative expenses and stronger advertising spending partly offset by pricing and manufacturing productivity. Reuters noted that lower market cocoa prices are beginning to ease some pressure and are giving the company greater flexibility to use promotions and value-oriented packaging.
For the cocoa market, the results provide a moderately supportive demand signal. Positive volume development in North America and emerging markets suggests that chocolate consumption is beginning to stabilise as inflationary pressure eases. However, continuing weakness in Europe means the recovery is not yet broad-based enough to indicate a strong global rebound in cocoa demand.
Ghana Proposes Major Reform of Cocoa Pricing, Financing and Domestic Processing
Ghana’s government also presented significant cocoa-sector reforms as part of its 2026 Mid-Year Fiscal Policy Review on 28 July. The government plans to submit a new COCOBOD Bill to Parliament, replacing the Ghana Cocoa Board Act that has governed the sector since 1984.
Under the proposed legislation, Ghana’s producer-price mechanism would be linked more directly to movements in international cocoa prices, exchange rates and broader market conditions. The legislation would guarantee farmers no less than 70% of the gross Free-on-Board export price.
The Bill would also introduce a new financing framework for cocoa purchases and other COCOBOD operations. The objective is to improve financial stability and reduce the payment and liquidity problems that have disrupted Ghana’s cocoa purchasing system during recent seasons.
A particularly important provision would require at least 50% of Ghana’s cocoa beans to be processed domestically. This would represent a substantial expansion of local grinding and value-added production if sufficient processing capacity and financing are secured.
Futures performance
New York cocoa
| CONTRACT | 27 JUL | 28 JUL | CHANGE | CHANGE % |
|---|---|---|---|---|
| Sep-26 | 5,156 | 5,206 | +50 | +0.97% |
| Dec-26 | 5,298 | 5,330 | +32 | +0.60% |
| Mar-27 | 5,395 | 5,421 | +26 | +0.48% |
| May-27 | 5,409 | 5,441 | +32 | +0.59% |
New York cocoa recovered on 28 July following the sharp decline recorded during the previous session. September 2026 finished at a last-traded price of 5,206, gaining 50 points or 0.97% from Monday’s closing level of 5,156.
The session was characterised by another wide trading range and a pronounced intraday reversal. September opened slightly below its previous closing level at 5,150 and traded as low as 4,992, briefly breaking below the psychologically important 5,000-point level. Buying then emerged, lifting the contract by 214 points from its low to a close of 5,206. September finished only 27 points below its intraday high of 5,233 and within the upper portion of its 241-point daily range.
The New York forward curve remained upward-sloping between September 2026 and May 2027, before turning lower across the later contracts. The December-to-September premium narrowed from 142 points to 124 points as the nearby contract outperformed. The March-to-December premium also contracted from 97 to 91 points, while the May-to-March premium widened from 14 to 20 points.
The flattening at the front of the curve reflects the stronger recovery of September relative to the deferred contracts. However, the continued premium for December, March and May indicates that the market is still pricing nearby cocoa below future delivery periods.
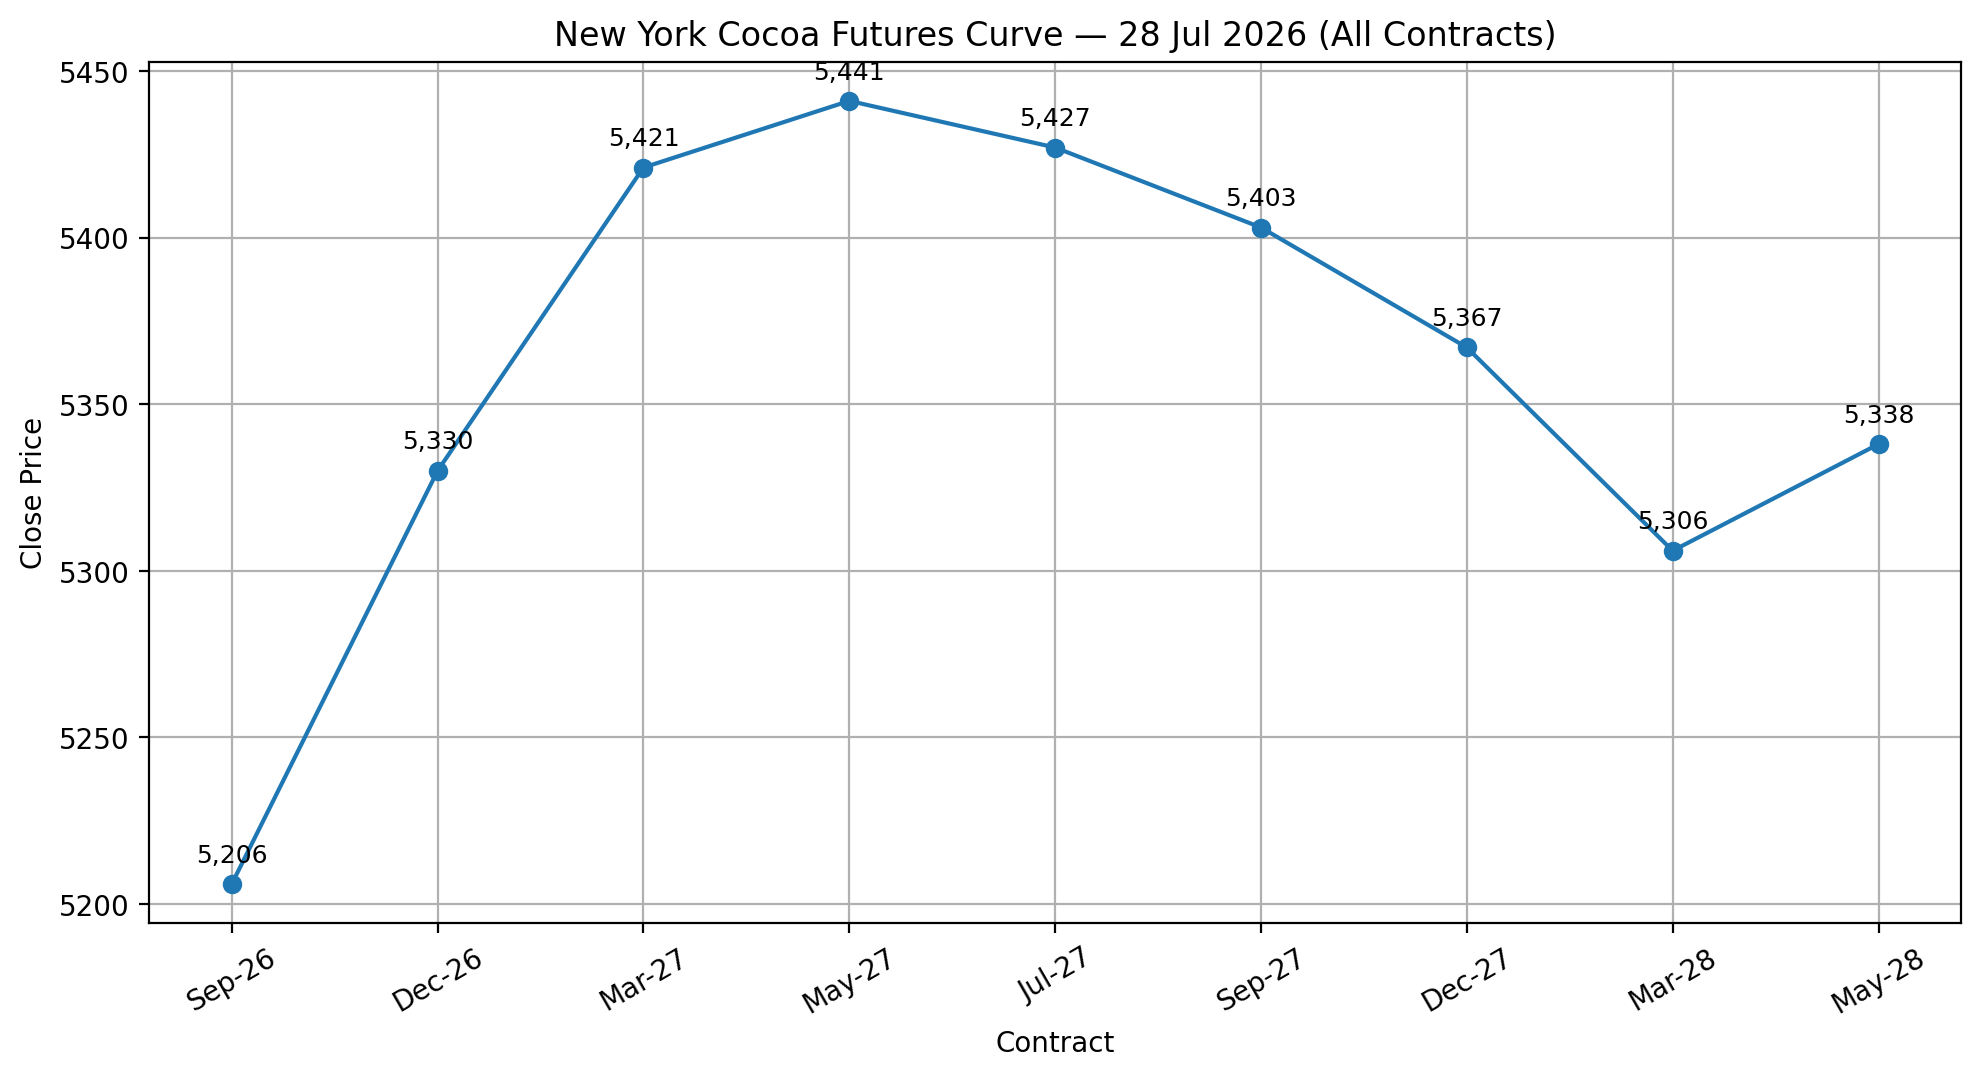
Official exchange settlements recorded larger advances than the last-traded close comparisons because the previous session’s settlements were below the final traded prices. September settled at 5,201, up 101 points or 1.98%. December settled at 5,332, gaining 89 points, while March and May settled at 5,419 and 5,437, increases of 80 and 85 points respectively.
London cocoa
| CONTRACT | 27 JUL | 28 JUL | CHANGE | CHANGE % |
|---|---|---|---|---|
| Sep-26 | 3,834 | 3,911 | +77 | +2.01% |
| Dec-26 | 3,897 | 3,964 | +67 | +1.72% |
| Mar-27 | 3,983 | 4,050 | +67 | +1.68% |
| May-27 | 3,988 | 4,050 | +62 | +1.55% |
London cocoa also recovered strongly on 28 July and outperformed New York on a last-traded closing basis. September 2026 finished at 3,911, gaining 77 points or 2.01% from the previous closing price of 3,834.
September opened at 3,865 and initially remained under pressure, falling to an intraday low of 3,758. The contract subsequently recovered by 153 points and finished at 3,911, only 11 points below its session high of 3,922. The close within the upper 7% of the daily range represented a strong rejection of prices below 3,800.
The London curve retained its upward slope from September to March. The December-to-September premium narrowed from 63 points to 53 points, reflecting the stronger performance of the nearby contract. The March-to-December premium remained unchanged at 86 points, while the May-to-March spread flattened from a five-point premium to parity, with both contracts closing at 4,050.
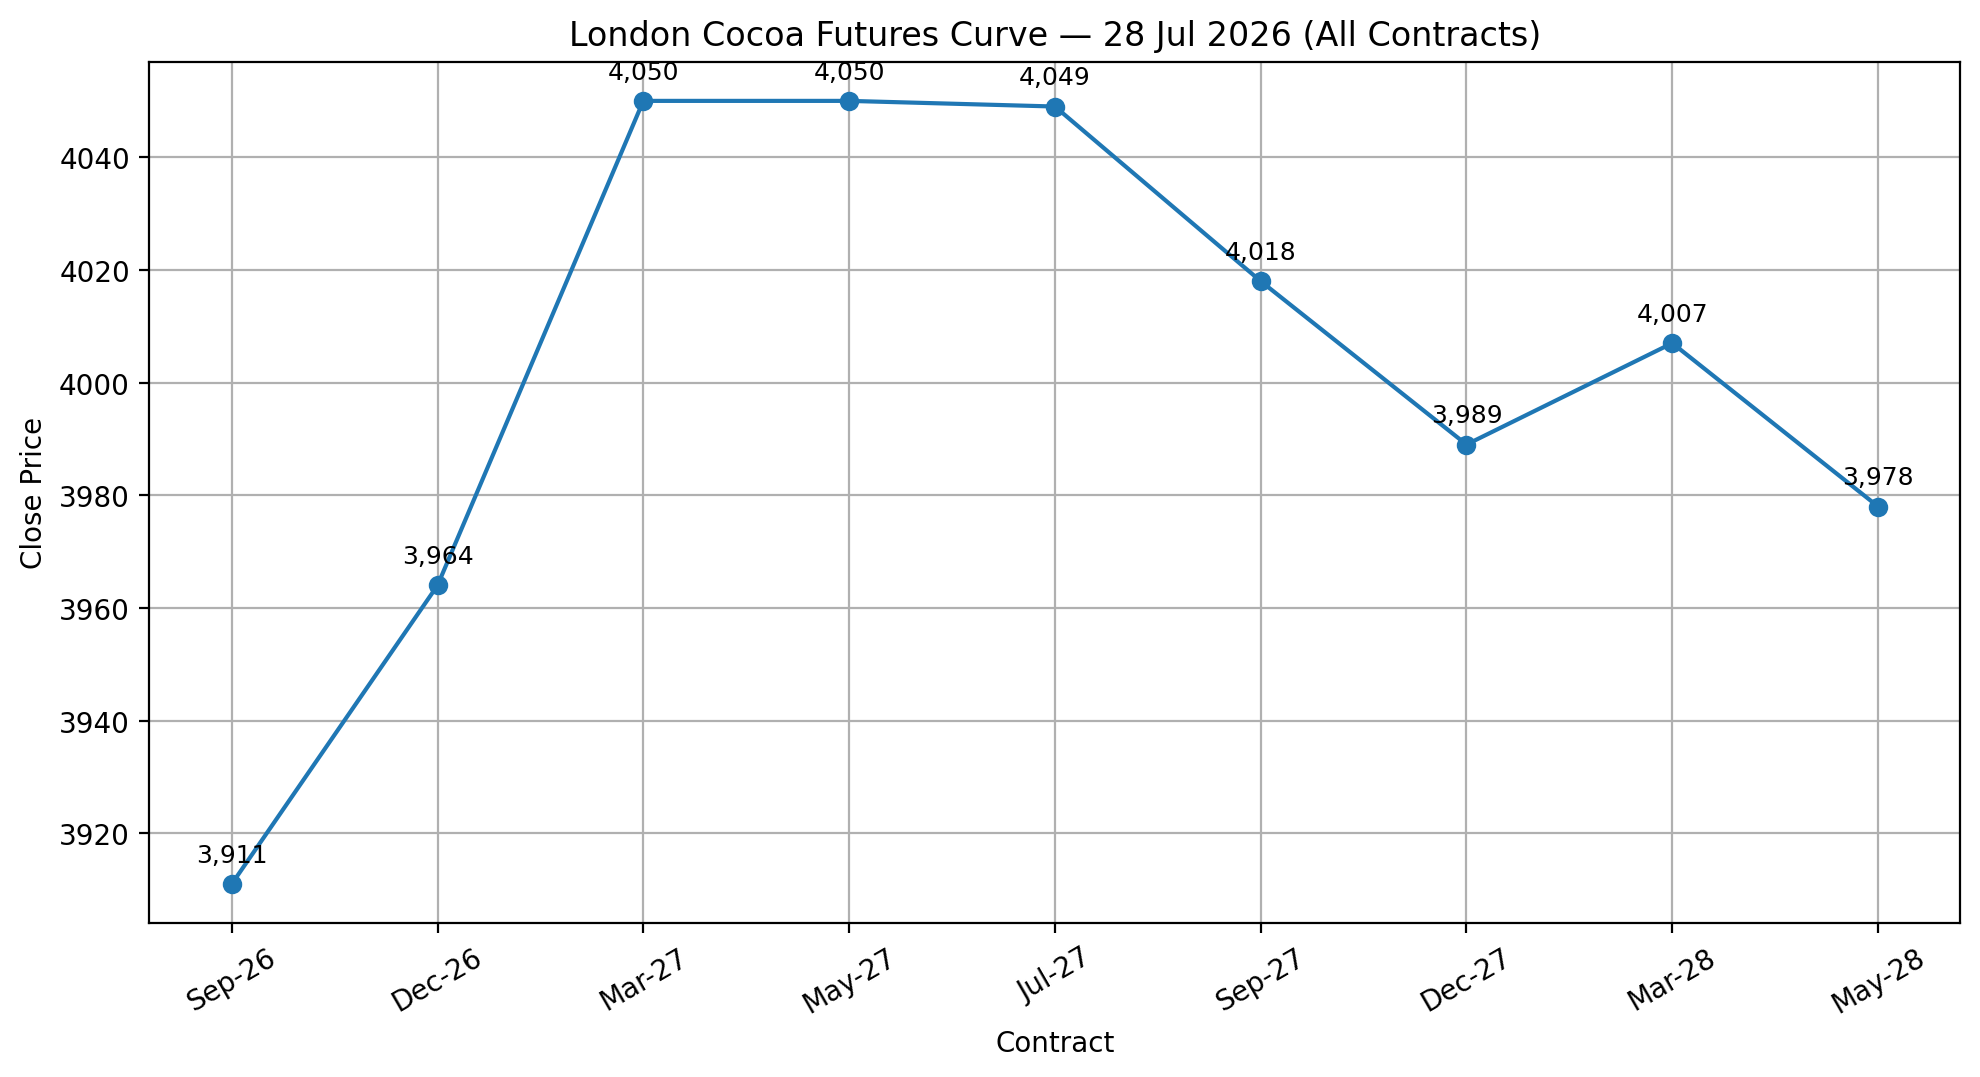
Official settlements were positive across the curve. September settled at 3,901, up 69 points or 1.80%. December settled at 3,954, an increase of 64 points, while March and May settled at 4,040 and 4,041, gains of 59 and 61 points respectively.
EFP, EFS and Spread Activity
Exchange-for-Physical activity remained relatively limited compared with total futures turnover. New York recorded 440 EFP contracts, representing approximately 1.0% of total volume. Activity was concentrated entirely in the nearby contracts, with 367 EFPs in September 2026 and 73 in December 2026. No Exchange-for-Swap transactions were reported in New York.
London recorded stronger EFP activity, with 751 contracts, equivalent to approximately 2.6% of total volume. December 2026 accounted for 662 contracts, while September 2026 recorded 89. London also reported 30 EFS contracts, all concentrated in September 2026.
Spread trading dominated activity on both exchanges. New York spread volume reached 30,075 contracts, representing 70.8% of total volume. December generated the largest spread turnover at 11,093 contracts, followed by September with 8,674 and March with 6,372.
London recorded spread volume of 20,288 contracts, equivalent to 69.1% of total trading activity. December was again the most active contract with 6,358 spread contracts, followed by March with 4,455 and September with 4,394.
US–UK Spread
(Sep Contract)
$5,206 − (£3,911 x 1.328$/£) =$12ton (down from $60ton)
Volume and Open Interest
New York Cocoa
| TRADE DATE | TOTAL VOLUME | TOTAL OPEN INTEREST |
|---|---|---|
| 22 Jul 2026 | 40,347 | 200,429 |
| 23 Jul 2026 | 34,602 | 200,269 |
| 24 Jul 2026 | 46,210 | 199,322 |
| 27 Jul 2026 | 44,052 | 200,321 |
| 28 Jul 2026 | 42,500 | Not available |
In New York, open interest increased from 199,322 contracts on 24 July to 200,321 on 27 July while prices declined sharply. A falling price combined with rising open interest is generally consistent with new short positions entering the market rather than existing longs simply liquidating. This gave the 27 July decline greater bearish significance.
On 28 July, September cocoa recovered by 0.97% on volume of 42,500 contracts. Turnover was 3.5% below the previous session but remained relatively healthy compared with recent activity. The rebound therefore attracted meaningful participation, although it was not accompanied by a clear increase in trading intensity.
London Cocoa
| TRADE DATE | TOTAL VOLUME | TOTAL OPEN INTEREST |
|---|---|---|
| 22 Jul 2026 | 27,061 | 228,134 |
| 23 Jul 2026 | 21,204 | 227,960 |
| 24 Jul 2026 | 18,744 | 227,976 |
| 27 Jul 2026 | 25,486 | 229,839 |
| 28 Jul 2026 | 29,354 | Not available |
London presented a somewhat stronger short-term signal. September recovered by 2.01%, while total volume increased by 15.2% to 29,354 contracts. The combination of a stronger price advance and higher volume indicates greater conviction behind the London recovery. However, London open interest had also increased during the preceding decline, rising from 227,976 contracts on 24 July to 229,839 on 27 July. This suggests that new positions, potentially including new shorts, were established as prices weakened.
The missing open-interest figures for 28 July are therefore critical. The next interpretation depends on how open interest changed during the rebound.
The data support a short-term stabilisation signal and a meaningful rejection of the session lows, particularly in London. Nevertheless, because open interest rose during the preceding sell-off and the 28 July open-interest figures are unavailable, the recovery should currently be treated as a possible short-covering rebound rather than a confirmed change in trend. A continued price advance accompanied by rising open interest would provide the strongest confirmation that fresh buying is replacing bearish positioning.
Exchange Trading Volume
| EXCHANGE | 27 JUL 2026 | 28 JUL 2026 | CHANGE | % CHANGE |
|---|---|---|---|---|
| ICE U.S. Cocoa | 3,361,762 | 3,375,119 | +13,357 | +0.40% |
| ICE Europe Cocoa | 1,150,313 | 1,150,313 | 0 | 0.00% |
| Combined | 4,512,075 | 4,525,432 | +13,357 | +0.30% |
The measure is not a complete regional stock-to-grind ratio, as it includes only exchange-certified cocoa held at U.S. and EU delivery ports and excludes commercial inventories outside the ICE warehouse system. North America NCA grindings cover processors across North America, while ICE U.S. certified stocks are stored at U.S. delivery ports. ECA reports bean usage in European countries and London-certified cocoa is held in European and UK delivery locations.
Readers can explore detailed cocoa market datasets, futures statistics, and historical indicators in the CocoaIntel Data Hub:
 Cocoa Intel
Tomorrow's Outlook
New York September cocoa is likely to begin the next session with a mild upward bias, supported by the strong recovery from the 4,992 intraday low and the close near 5,200. The hourly stochastic has turned sharply higher from oversold territory, while the short-term MACD is improving, suggesting that the rebound may initially continue.
The first important resistance area is 5,225–5,250, including the latest session high and nearby moving-average resistance. A sustained break above this zone could extend the recovery toward 5,300–5,350. However, the daily indicators remain mixed: MACD momentum is still weakening, the stochastic has not produced a convincing bullish reversal, and price remains below several short-term moving averages. This is likely to restrict the strength of any advance.
The most probable scenario is therefore a range-bound session with a modest bullish bias, potentially involving an early attempt above 5,200 followed by consolidation. Initial support is located around 5,150, followed by 5,100. A move below 5,100 would weaken the rebound and expose the psychological 5,000 level again.
If you notice any discrepancies in these figures or have extra information, please email hello@cocoaintel.com or leave a comment – corrections and additional insights are always welcome.