Cocoa Reverses Lower as Selling Pressure Builds Ahead of September Expiry (11 September 2026)


Cocoa futures ended Friday with a pronounced intraday reversal, particularly in New York. Dec-26 initially rallied toward $6,200/t, but the advance failed to hold and was followed by a sustained sequence of lower highs and lower lows through the remainder of the session. Selling intensified after the market broke below $6,000, taking the contract to a $5,892 low before it closed at $5,913, near the bottom of the day’s range. The deterioration in momentum indicators, declining OBV and heavier volume during the sell-offs suggest that the move reflected genuine selling pressure rather than a simple late-session drift, leaving the market technically weak into the weekend.
Côte d’Ivoire: producer dispute broadens
Tensions within Côte d’Ivoire’s cocoa sector intensified on 11 September after seven producer organisations said they would boycott an OIA Café-Cacao consultation in Divo. The groups questioned the representativeness of the interprofessional body, called for greater transparency over inventoried cocoa, including an independent audit of stocks they estimate at around 100,000 tonnes and reiterated dissatisfaction with the CFA1,200/kg producer price for the 2026/27 main crop.
The development is more significant than another criticism of the farmgate price because it points to a widening institutional divide between parts of the producer base and the OIA. The OIA has separately urged farmers to reject calls for strikes, product retention and boycotts and planned to begin a producer outreach campaign in Divo on 12 September.
Indonesia: government targets large-scale cocoa rehabilitation
Indonesia’s Agriculture Ministry said on 11 September that its 2025–27 cocoa programme targets 247,260 hectares of smallholder land for rehabilitation and expansion. Officials put current national production at around 200,000 tonnes, with average yields of only 700–800 kg/ha, and attributed the decline in output partly to ageing trees.
Ecuador: local weather risk emerges in Santo Domingo
Local reporting from Santo Domingo de los Tsáchilas on 11 September warned that El Niño-related rainfall and high humidity could cause waterlogging and increase agricultural disease pressure, including risks to cocoa. Producers are being advised to improve drainage and undertake preventive crop management.
September futures expiry
September expiry moves into focus next week. Both New York and London Sep-26 cocoa futures reach their last trading day on 15 September, with final settlement and notice procedures following on 16 September. New York is already within its physical delivery period, which began on 9 September. As a result, liquidity and open interest should continue migrating from September into December, and movements in the expiring contract may increasingly reflect delivery mechanics rather than the broader directional market. The Sep/Dec spread will therefore be more informative than the outright September price: strengthening in September relative to December would indicate tighter nearby deliverable supply, while further weakening would point to more comfortable short-term availability. Dec-26 should now be treated as the principal benchmark for directional analysis.
Weather
Weather conditions across the major cocoa-producing origins remain mixed rather than uniformly threatening. Recent rainfall has reduced immediate moisture stress across much of West Africa, but important differences remain between origins. Ghana has benefited from relatively consistent moisture, while Côte d’Ivoire remains more exposed to irregular rainfall and weaker underlying soil moisture in some areas. Outside West Africa, excessive-rainfall risk is becoming more relevant in Ecuador, while Indonesia and parts of Peru are moving toward a drier weather profile as El Niño strengthens.
Ghana
Rainfall conditions improved across Ghana’s cocoa-producing belt during the week to 11 September. NOAA RFE2 estimates indicate broadly 50–100 mm across much of the producing region, with several western and central areas receiving above-normal rainfall. Month-to-date moisture conditions therefore remain broadly adequate for crop development.
The rainfall is particularly important because August was unusually warm. NOAA temperature indicators place large parts of Ghana around the 95th–98th percentile, increasing evaporative demand. Recent rainfall has therefore been replenishing moisture against a relatively warm background rather than building on exceptionally wet soil conditions.
Ghana Meteorological Agency forecasts late last week and over the weekend continued to indicate cloud cover, intermittent rain, drizzle and thunderstorms across parts of the forest, coastal and middle belts. This should help maintain soil moisture and support pod development.
However, GMet’s broader September outlook continues to favour below-normal to normal rainfall across much of the country. Continued regular rainfall will therefore remain important through the second half of September.
Côte d’Ivoire
Côte d’Ivoire received a more variable rainfall pattern than Ghana during 5–11 September. NOAA RFE2 estimates indicate generally around 25–75 mm across the main cocoa regions, with wetter pockets but larger areas remaining closer to or below climatological rainfall levels.
Underlying moisture conditions also appear less comfortable than in Ghana. August soil-moisture indicators show relatively weak reserves across parts of the cocoa belt, while exceptionally high temperatures increased evaporation and crop-water demand.
SODEXAM placed several regions under heightened rainfall vigilance through 13 September because of the potential for locally heavy precipitation. The immediate issue is therefore not a complete absence of rainfall but its uneven geographic and temporal distribution.
Regular showers would remain beneficial in relatively dry producing areas. Conversely, sustained heavy rainfall could raise fungal-disease pressure and interfere with harvesting, fermentation and bean drying as the 2026/27 main crop approaches.
Nigeria
Rainfall across Nigeria’s southern cocoa belt remained generally adequate through the week ending 11 September. NOAA RFE2 imagery indicates approximately 50–100 mm across much of southern Nigeria, with wetter pockets in parts of the south-central belt.
Month-to-date rainfall totals are also substantial across many producing areas, although anomalies remain uneven. Parts of the southwest and southeast are closer to or below normal, while some central-southern regions have experienced above-normal rainfall.
These conditions broadly support crop development in major producing states including Ondo, Edo, Ogun, Osun and Cross River. NiMet’s updated seasonal assessment also places increasing emphasis on the developing El Niño background and above-normal temperature risks.
The principal concern is rainfall distribution rather than the national total. Extended dry intervals in western producing areas could become more important under elevated temperatures, while excessive moisture in the southeast could increase black-pod and other fungal-disease pressure.
Cameroon
Southern and western Cameroon received useful rainfall during 5–11 September, generally around 25–75 mm across much of the cocoa belt, with locally higher totals. However, NOAA anomaly maps indicate that parts of the producing region remain below their climatological rainfall levels.
The August background remains important. Temperature indicators show exceptionally warm conditions across much of Cameroon, while soil-moisture and runoff data point to relatively weak moisture reserves across several southern areas.
Recent rainfall is therefore improving conditions, but it is replenishing moisture against a warm and locally dry background rather than adding to uniformly favourable reserves.
Regular rainfall would largely neutralize the current risk. A return to hot, irregular showers would increase concern over moisture stress and bean development, while persistent heavy rainfall would raise disease and drying risks.
Ecuador
Ecuador is currently one of the more important non-African weather risks. Recent forecasts have indicated rainfall of varying intensity across the coastal region, particularly northern and central areas relevant to cocoa production.
Localized stronger rainfall has affected areas including Esmeraldas, Los Ríos and Santo Domingo, with precipitation also extending toward Guayas and Manabí.
Moderate rainfall is beneficial for cocoa because it maintains soil moisture and supports pod development. The risk changes if rainfall becomes persistent. Repeated wet days, high humidity and saturated soils can increase monilia and black-pod pressure, interfere with field work and slow fermentation and bean drying.
The developing El Niño environment adds uncertainty to the rainfall pattern and means that conditions should be monitored as an evolving risk rather than treated as a one-off rainfall episode.
Brazil
Brazil presents a split cocoa-weather picture between Bahia and Pará. Recent forecasts indicate relatively limited rainfall across the Northeast, with precipitation concentrated mainly along the Bahia coastline, while interior areas remain predominantly dry and warm.
Southern Bahia can tolerate short dry periods provided underlying soil moisture remains adequate, but prolonged warmth and limited rainfall would gradually increase evapotranspiration and crop-water requirements.
Pará also warrants attention. The September climate outlook favours below-normal rainfall across substantial parts of northern Brazil, although local areas may still remain near or above normal.
There is currently no indication of a major production-threatening event, but persistent dryness would make moisture conditions progressively more relevant in both producing regions.
Indonesia
Indonesia currently presents the clearest dry-weather risk among the major secondary cocoa origins. BMKG’s atmospheric outlook indicates generally low-to-moderate rainfall through September, with parts of Sulawesi repeatedly identified among areas likely to receive less than 50 mm per ten-day period.
The signal is particularly relevant because Sulawesi remains Indonesia’s principal cocoa-producing region. Short dry periods can assist harvesting, fermentation and drying, but prolonged rainfall deficits become increasingly negative for tree condition, flowering and pod development.
El Niño represents the larger medium-term concern. NOAA’s latest assessment indicates a greater than 90% probability of a very strong El Niño during Northern Hemisphere autumn and winter 2026/27.
Indonesia is historically one of the cocoa origins where El Niño can produce a clearer drying response than in West Africa. The magnitude and geographic distribution of the effect remain uncertain, but sustained below-normal rainfall into October would materially increase crop risk.
Peru
Peru’s cocoa regions warrant monitoring because the seasonal rainfall signal remains tilted toward normal-to-below-normal conditions across parts of the northern and central Amazon.
This includes important producing areas such as San Martín, Huánuco, Junín and Ucayali. The probability of below-normal rainfall is elevated across several northern and central jungle zones.
Temperatures are also expected to range from normal to above normal in parts of the northern Amazon, increasing evaporative demand and making persistent rainfall deficits more relevant.
Moderately below-normal rainfall remains manageable across humid Amazonian areas, but prolonged dryness combined with higher temperatures could eventually affect flowering, pod setting and bean development.
Futures performance
New York cocoa
| Contract | 10 Sep | 11 Sep close | Change | Change % |
|---|---|---|---|---|
| Dec-26 | $5,941 | $5,913 | -$28 | -0.47% |
| Mar-27 | $6,068 | $6,036 | -$32 | -0.53% |
| May-27 | $6,122 | $6,092 | -$30 | -0.49% |
| Jul-27 | $6,129 | $6,087 | -$42 | -0.69% |
| Sep-27 | $6,095 | $6,034 | -$61 | -1.00% |
| Dec-27 | $5,978 | $5,923 | -$55 | -0.92% |
| Mar-28 | $5,898 | $5,841 | -$57 | -0.97% |
New York cocoa declined across every comparable listed maturity on 11 September. Dec-26 fell $28 to $5,913, while the weakness became more pronounced further along the curve, with Sep-27 down 1.00%, Dec-27 down 0.92% and Mar-28 down 0.97%. The session also finished with a distinctly weak tone, as Dec-26 closed only $21 above its $5,892 low and several deferred contracts settled at or very near their session lows.
This indicates that selling pressure was broad and persistent rather than concentrated in the nearby contract. The heavier losses in late-2027 maturities show that the market was also reducing confidence further along the forward curve, while the concentration of closes near the daily lows suggests buyers failed to regain control into the end of the session. That leaves the market vulnerable to further downside unless prices can quickly reclaim nearby resistance, although the weak close also raises the possibility of a short-covering rebound if sellers fail to extend the move.
New York Futures curve
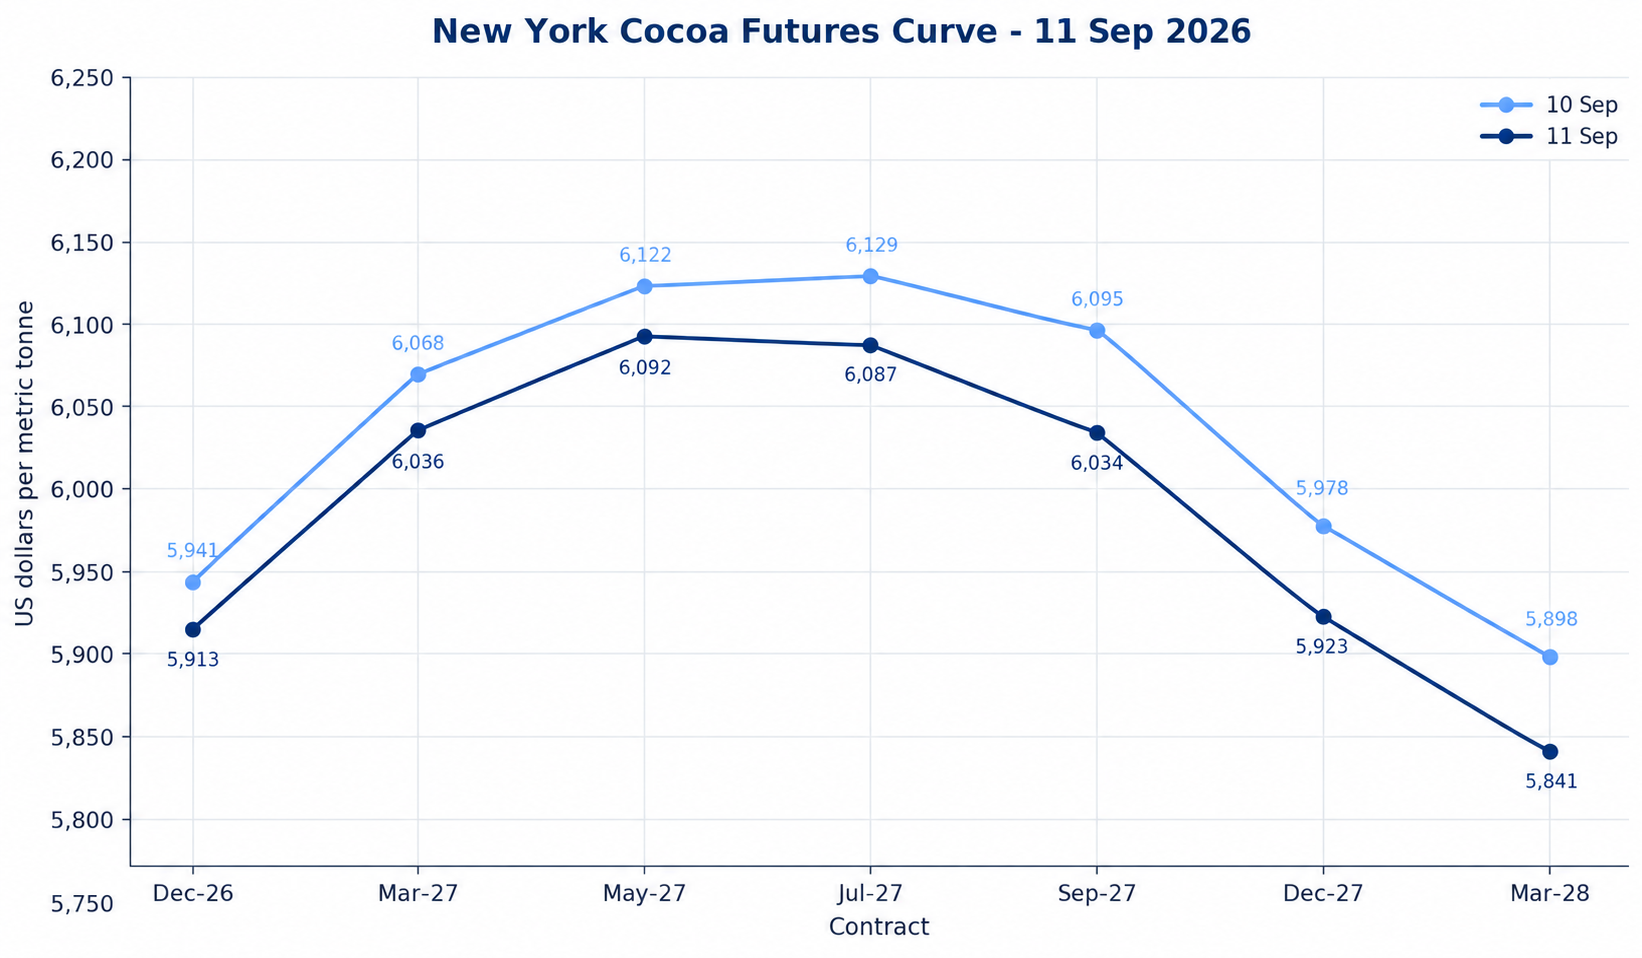
The entire New York curve shifted lower on 11 September, but the decline was uneven. Selling pressure became progressively stronger from Jul-27 onward, causing the peak of the curve to move forward. Jul-27 had been the highest-priced contract on 10 September at $6,129, but by 11 September May-27 had become the peak at $6,092, slightly above Jul-27 at $6,087. The May-27/Jul-27 relationship also moved from a $7 contango to a $5 backwardation, while Jul-27/Sep-27 backwardation widened from $34 to $53. Further out, the Dec-26/Dec-27 contango compressed sharply from $37 to just $10 as Dec-27 weakened more than the nearby contract.
The curve is showing that the sell-off was not simply a front-month or expiry-related move. The heavier losses in late-2027 contracts indicate that the market was also marking down expectations further into the future, while the shift of the curve peak from July to May suggests that relative support is moving toward earlier 2027 maturities. The widening Jul/Sep backwardation is particularly notable because it shows Sep-27 losing value rapidly relative to July. At the same time, the collapse in the Dec-26/Dec-27 contango means the market is assigning much less premium to cocoa one year forward than it was only a day earlier. Overall, the curve is becoming more defensive: nearby and mid-2027 contracts retain comparatively better support, while late-2027 pricing is deteriorating more aggressively, reinforcing the broader bearish signal from outright prices.
London cocoa
| Contract | 10 Sep | 11 Sep close | Change | Change % |
|---|---|---|---|---|
| Sep-26 | £4,142 | £4,109 | -£33 | -0.80% |
| Dec-26 | £4,333 | £4,313 | -£20 | -0.46% |
| Mar-27 | £4,484 | £4,477 | -£7 | -0.16% |
| May-27 | £4,503 | £4,493 | -£10 | -0.22% |
| Jul-27 | £4,495 | £4,491 | -£4 | -0.09% |
| Sep-27 | £4,435 | £4,422 | -£13 | -0.29% |
| Dec-27 | £4,332 | £4,300 | -£32 | -0.74% |
| Mar-28 | £4,318 | £4,311 | -£7 | -0.16% |
London cocoa also declined across every comparable maturity on 11 September, but the move was less uniform than in New York. Sep-26 recorded the largest percentage decline, falling £33 per tonne, or 0.80%, while Dec-27 lost £32, or 0.74%. The centre of the curve was comparatively resilient, with Mar-27 down only 0.16%, May-27 down 0.22% and Jul-27 down just 0.09%. Despite the smaller outright declines in those contracts, the session still finished weakly: Sep-26 closed exactly at its £4,109 low, Dec-26 ended within the bottom 8% of its daily range, and most contracts from Mar-27 through Dec-27 finished within the lower 12–16% of their respective ranges.
London showed less aggressive outright selling than New York, particularly through the middle of the curve, but the weak closes indicate that buyers were still unable to take control into the end of the session. The relative stability in Mar-27 through Jul-27 therefore looks more like resistance to selling than genuine bullish demand. The sharper weakness in Sep-26 also suggests that front-month expiry and delivery mechanics may be exerting additional pressure on the nearby contract, while the fall in Dec-27 points to renewed weakness further along the curve. Overall, London remains better supported than New York in the mid-2027 maturities, but the price action still carries a bearish tone because contracts consistently finished near their session lows rather than recovering into the close.
London curve structure
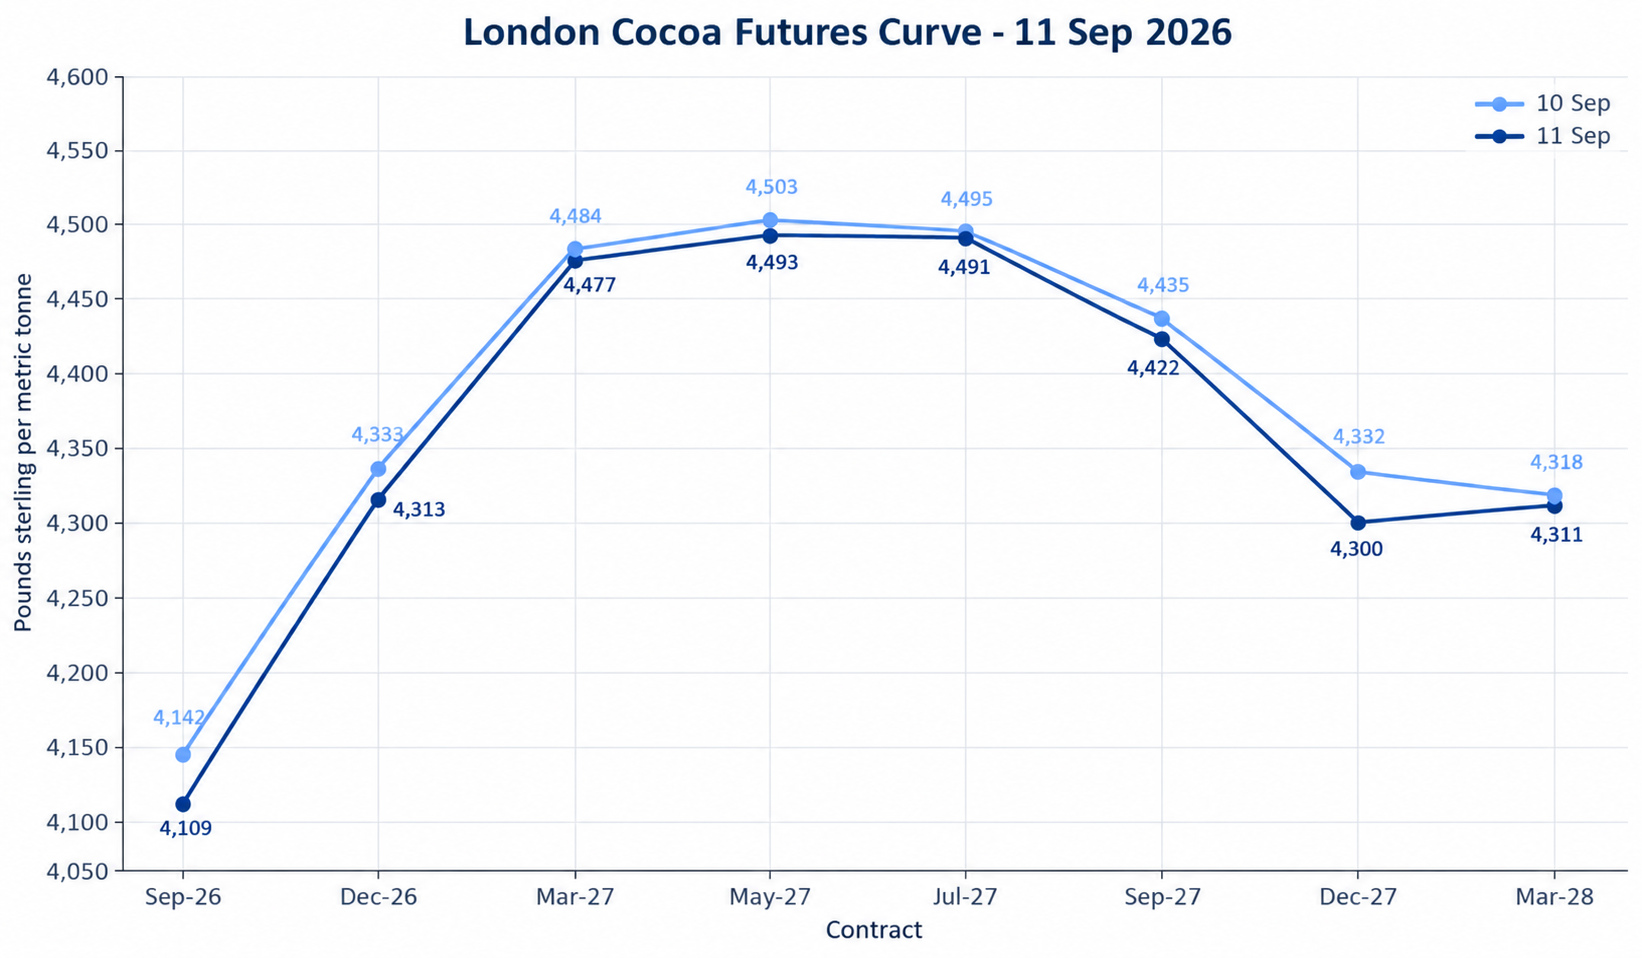
London’s curve structure remained more stable than New York’s, with the mid-2027 peak unchanged. May-27 remained the highest-priced contract at £4,493, only slightly above Jul-27 at £4,491, leaving the May/July section effectively flat. The front of the curve steepened as Sep-26/Dec-26 contango widened from £191 to £204 per tonne and Dec-26/Mar-27 contango increased from £151 to £164. In the centre, Mar-27/May-27 contango narrowed modestly from £19 to £16, while May-27/Jul-27 backwardation compressed from £8 to just £2. Further out, however, weakness became more pronounced: Jul-27/Sep-27 backwardation widened from £60 to £69, Sep-27/Dec-27 backwardation increased from £103 to £122, and the Dec-26/Dec-27 relationship moved from a £1 backwardation to £13.
London is showing a more segmented curve than New York. The mid-2027 contracts remain relatively well supported, suggesting that the market is not broadly repricing the entire forward structure lower. Instead, weakness is concentrated at both ends: the nearby contracts are under pressure as September approaches expiry and liquidity migrates forward, while late-2027 contracts are losing relative value more quickly. The widening backwardation beyond July indicates that the market is assigning less value to later delivery periods, while the near-flat May/July relationship points to a stable mid-curve anchor. Overall, London remains structurally firmer than New York through the middle of the curve, but the deterioration in the front and late-2027 maturities still leaves the broader signal bearish.
US–UK Spread
$5,913 − (£4,313 x 1.352$/£) =$81ton
NY Dec-26 premium to London Dec-26: approximately $82/t, down from roughly $91/t on 10 September.
Volume and Open Interest
New York cocoa
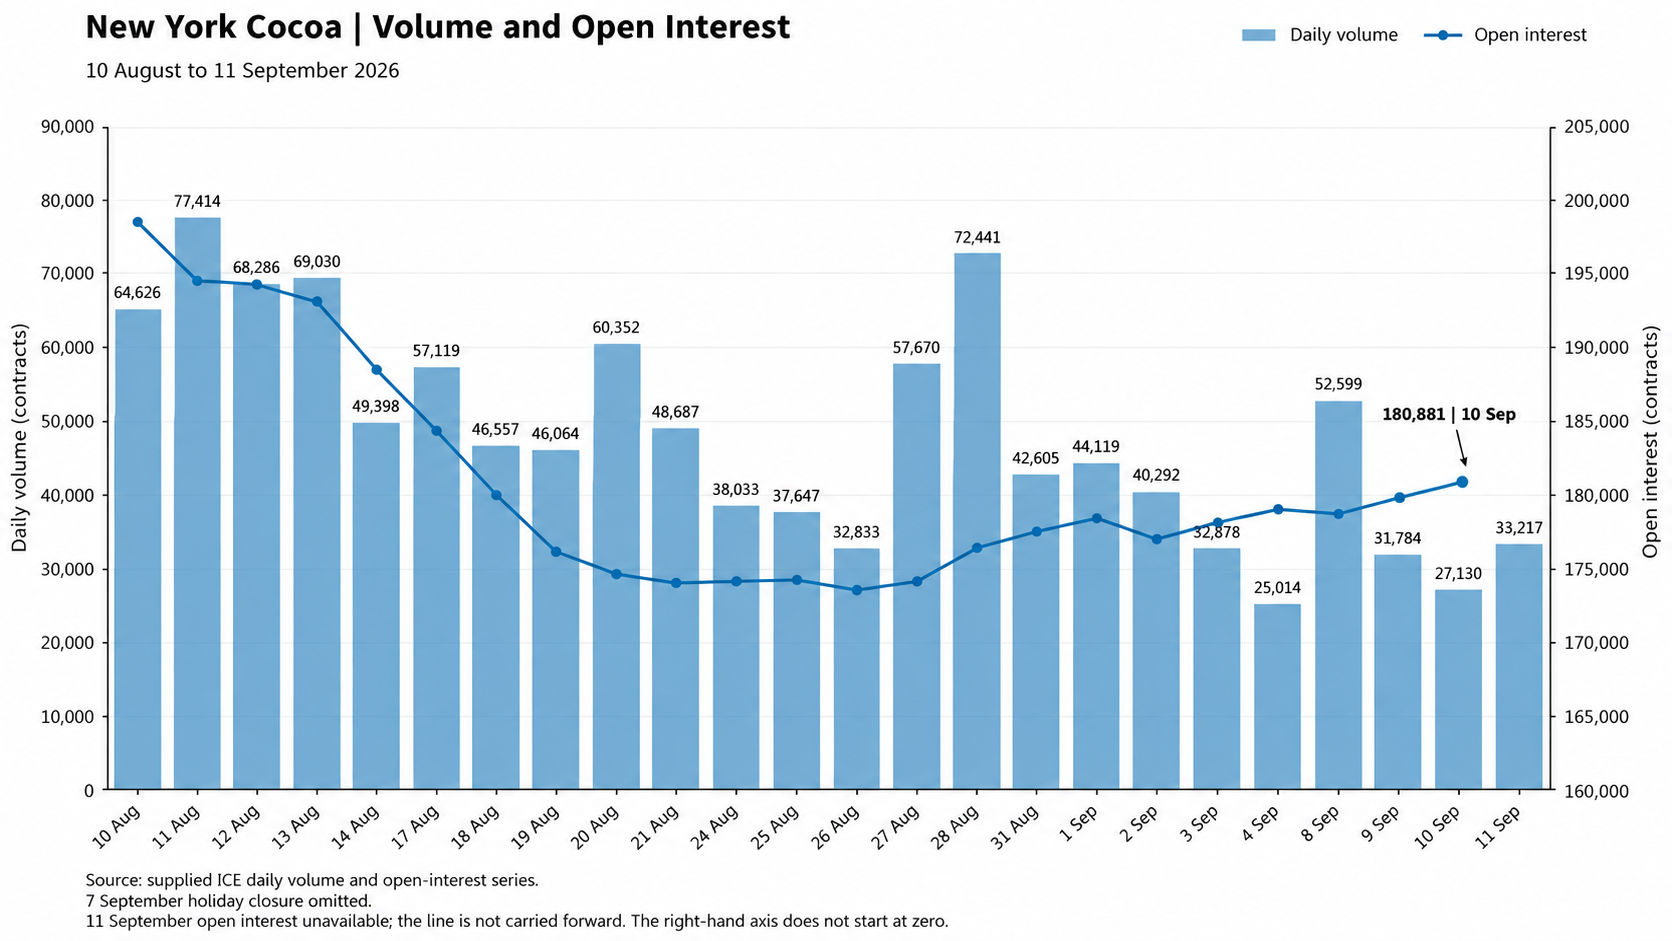
New York cocoa volume rose to 33,217 contracts on 11 September, up 22.4% from 27,130 in the previous session. The increase interrupted two consecutive days of declining turnover, but activity remained relatively subdued: volume was still 36.8% below the 8 September level, 27.2% below the preceding 20-session average and ranked only 19th among the 24 trading sessions in the observed period. The latest available open-interest reading, for 10 September, increased by 1,173 contracts to 180,881, extending the recovery from the 26 August low of 172,055. Open interest is now at its highest level since 14 August, although it remains 8.5% below the 10 August period peak.
Friday’s increase in volume shows that participation picked up as prices reversed lower, but turnover was not high enough to characterize the move as capitulation or exceptionally aggressive liquidation. The weak close therefore carries a bearish signal, but it occurred on below-average overall activity. More importantly, the recent recovery in open interest indicates that traders have gradually been rebuilding exposure after the late-August contraction. Because the latest open-interest figure predates Friday’s sell-off, however, it cannot yet tell us whether Friday’s decline was driven by new short creation or by existing longs being liquidated. If subsequent data show open interest rising alongside falling prices, that would strengthen the bearish interpretation by confirming fresh positions entering on the short side; falling open interest would instead point more toward long liquidation and position reduction.
London cocoa
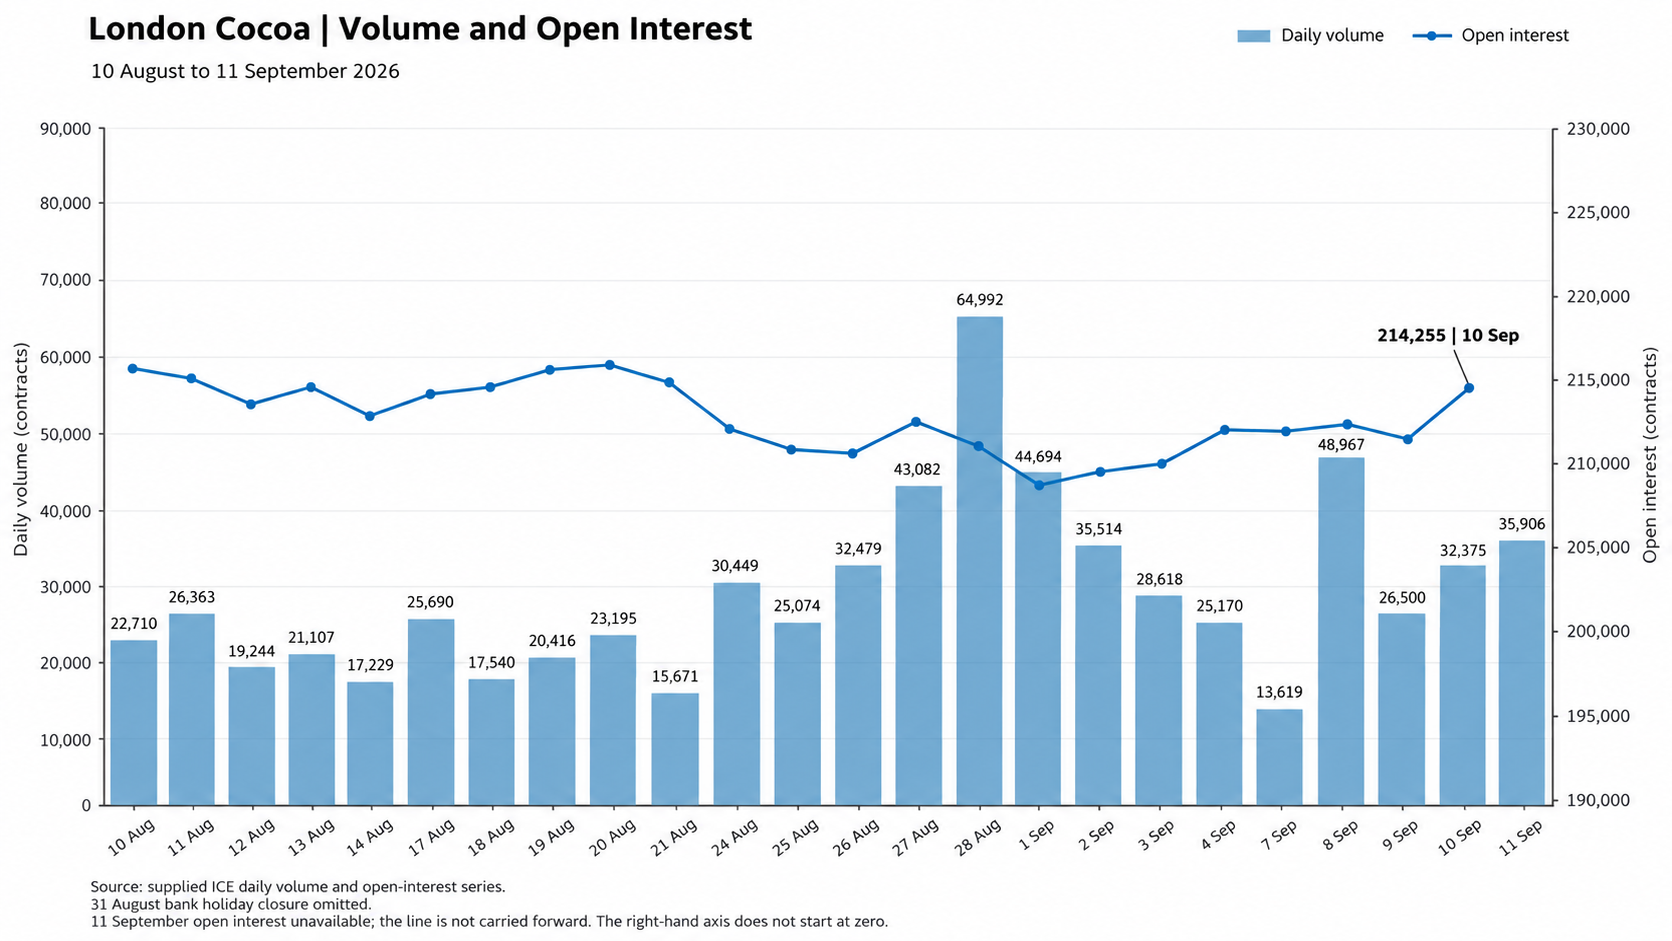
London cocoa volume rose to 35,906 contracts on 11 September, up 10.9% from the previous session and 35.5% over two days. Unlike New York, turnover was elevated relative to recent norms: Friday’s volume was 21.2% above the preceding 20-session average and ranked fifth highest among the 24 trading sessions in the observed period. The latest available open-interest reading, for 10 September, also increased sharply to 214,255 contracts, up 1.38% on the day and only 0.64% below the period high of 215,640. London’s overall position base has therefore recovered much more fully than New York’s and is again close to the upper end of its recent range.
London’s decline occurred with relatively strong participation, which gives the move more weight than the equivalent weakness in New York. Above-average volume alongside a market closing near the lower end of its range suggests that selling was well supported by active participation rather than occurring in thin conditions. The high level of open interest also shows that substantial exposure remains in the market, meaning price moves can be amplified if traders begin adding to directional positions. However, because the latest open-interest figure is from 10 September, it is still too early to determine whether Friday’s weakness reflected fresh short creation or liquidation of existing longs. If the next open-interest reading rises while prices remain under pressure, that would strengthen the bearish signal considerably; a decline in open interest would instead suggest that part of Friday’s move was driven by position reduction rather than the establishment of new bearish exposure.
COT Analysis
| New York Managed Money | 1 Sep | 8 Sep | Weekly change |
|---|---|---|---|
| Long | 20,837 | 20,388 | −449 |
| Short | 29,762 | 31,924 | +2,162 |
| Net position | −8,925 | −11,536 | −2,611 |
| Spreading | 43,749 | 38,116 | −5,633 |
Managed Money became materially more bearish in New York during the week to 8 September. Funds reduced outright longs by 449 contracts while adding 2,162 shorts, increasing the net short position from 8,925 to 11,536 contracts. The 2,611-contract deterioration represents a 29% increase in net bearish exposure and is important because the move was driven primarily by new short creation rather than simply by investors liquidating long positions.
In practical market terms, this means speculative positioning is reinforcing the current downside price trend. As long as cocoa remains below key resistance, existing profitable shorts can encourage further trend-following and momentum selling, particularly if technical support levels break. However, the overall decline in US open interest and the 5,633-contract reduction in Managed Money spread positions show that the broader market was also reducing risk. The positioning therefore reflects stronger bearish conviction within the outright fund book, rather than an indiscriminate build-up of bearish exposure across the entire market.
| London Managed Money | 1 Sep | 8 Sep | Weekly change |
|---|---|---|---|
| Long | 8,930 | 7,732 | −1,198 |
| Short | 10,245 | 12,849 | +2,604 |
| Net position | −1,315 | −5,117 | −3,802 |
| Spreading | 39,943 | 37,189 | −2,754 |
London Managed Money is also bearish, holding a net short of 5,117 contracts. However, this represents only 1.8% of total open interest, compared with 4.8% in New York. London funds also hold 37,189 spread positions, substantially larger than their outright directional exposure, indicating that a significant part of fund activity remains focused on relative value and the shape of the futures curve rather than on outright downside price exposure.
The cross-market signal is therefore more bearish in New York. US Managed Money is adding outright shorts and carrying a larger net short relative to market size, while London positioning remains less directionally concentrated. This increases the likelihood that further weakness in New York could be amplified by speculative selling. At the same time, the growing short base creates greater short-covering risk if prices reverse through key resistance levels.
Methodology: US positioning uses the CFTC Disaggregated Commitments of Traders report, Futures-and-Options Combined, with Managed Money as the hedge-fund/speculative category. London positioning uses ICE Futures Europe Managed Money, Futures-and-Options Combined. Net position = outright longs minus outright shorts; spreading positions are treated separately.
ICE Inventory stocks
| MARKET | 10 SEP 2026 | 11 SEP 2026 | CHANGE | CHANGE % |
|---|---|---|---|---|
| US | 3,417,867 | 3,415,952 | −1,915 | −0.06% |
| UK | 1,330,313 | 1,337,188 | +6,875 | +0.52% |
Exchange inventories did not tighten during the past week. U.S. warehouse stocks fell by 20,790 bags, or 0.6%, but certified stocks increased by 5,084 to 743,014, indicating that the pool of exchange-eligible cocoa actually expanded despite the headline draw. Europe moved in the opposite direction, with inventories rising by roughly 42,000 bags, or 3.25%, through 10 September, more than offsetting the U.S. decline and leaving combined exchange-linked stocks about 23,000 bags higher on a common-date basis. This is particularly relevant ahead of September expiry because genuine nearby scarcity would normally be associated with falling certified availability and tighter front-month conditions. Instead, the current data suggest that deliverable supply remains broadly comfortable. The key signals to watch next are certified-stock movements, grading results, delivery notices and the Sep/Dec spread; sustained certified-stock declines alongside a stronger September contract would be the clearest sign that physical tightness is beginning to emerge.
Readers can explore detailed cocoa market datasets, futures statistics, and historical indicators in the CocoaIntel Data Hub:
 Cocoa Intel
Monday Outlook Dec Contract
For Monday, New York Dec-26 cocoa remains technically bearish to neutral, although a short-term rebound is possible. Friday’s rejection was significant: the contract traded up to $6,203 but closed at $5,913, near the session low, showing that sellers retained control. The 5-minute indicators improved into the close, so an initial bounce toward $5,960–$6,000 is plausible, but the hourly structure remains weak, with price below the main moving averages, softer momentum and weak OBV. The key pivot is $6,000: failure below this level would keep pressure on $5,890–$5,900, and a break there would expose $5,850 and $5,800. Conversely, a sustained move above $6,000 could extend toward $6,050–$6,110, while only a recovery above roughly $6,200 would materially improve the broader technical picture. Overall, the most likely setup is an early stabilization or bounce, followed by renewed selling unless $6,000 is decisively reclaimed.
If you notice any discrepancies in these figures or have extra information, please email hello@cocoaintel.com or leave a comment – corrections and additional insights are always welcome.