Cocoa Stabilises After Sell-Off as West Africa Weather Risks Build (7 August 2026)


New York cocoa experienced another highly volatile session on Friday. September opened at $5,764 and initially came under renewed selling pressure, falling to an intraday low of $5,613. Buyers subsequently emerged and triggered a sharp recovery, with prices accelerating higher during the late morning and reaching a session high of $5,890. The rally, however, failed to hold, and prices gradually retreated through the remainder of the session, finishing at $5,724. The wide $277 trading range, strong recovery from the lows and subsequent rejection from the highs highlighted continued aggressive two-way trading, with neither buyers nor sellers able to establish sustained control.
Côte d’Ivoire completes purchase of 100,000 tonnes of unsold cocoa
Côte d’Ivoire’s Coffee-Cocoa Council announced that the government had completed its programme to purchase cocoa that had accumulated in cooperative warehouses following the slowdown in exports. Authorities said 100,000 tonnes were acquired for CFA280 billion, equivalent to CFA2,800/kg. The intervention was intended to clear unsold stocks and relieve pressure on producers and cooperatives, although industry groups continue to argue that the actual volume of cocoa awaiting buyers was considerably larger than the quantity covered by the programme.
Ghana: strong current crop contrasts with deteriorating 2026/27 outlook
Ghana continues to present a pronounced contrast between current availability and expectations for the coming crop. Around 750,000 tonnes have reportedly been harvested during 2025/26, approximately 25.6% above the previous season’s 597,000 tonnes, providing an important source of additional West African supply and contributing to pressure on cocoa prices.
The outlook for 2026/27 is considerably less favourable. COCOBOD expects production to decline by at least 16%, citing adverse weather, the natural production cycle, swollen-shoot disease, ageing farms and particularly weak pod development in Western and Western North, which together account for more than half of Ghanaian output. Excessive rainfall during May and June has already been identified as one factor behind the weaker cherelle load.
Cameroon production decline remains relevant
Cameroon also remains an important supply-side development and is worth retaining in the report despite being discussed previously. Official ONCC figures showed that marketed cocoa production fell to 247,914 tonnes in 2025/26, down 61,603 tonnes, or approximately 19.9%, from the previous season. Bean exports declined even more sharply, falling 34.65% to 125,469 tonnes, while local and industrial processing dropped to 95,946 tonnes.
West African weather remains in focus after a wet weekend
Weather remained one of the most important forward-looking factors over the weekend. Ghana Meteorological Agency forecasts showed persistent cloudy conditions, thunderstorms and rainfall across parts of the country during Saturday and Sunday. Southern Ghana was expected to remain predominantly cloudy with areas of slight to moderate rainfall, while further thunderstorms and rain affected the transition and northern sectors.
The significance for cocoa is increasingly the persistence of moisture and limited sunshine rather than rainfall totals alone. Our seven-day accumulation forecast for 10–17 August continues to indicate widespread rainfall across the West African cocoa belt, including Côte d’Ivoire and Ghana, with locally higher accumulations in surrounding producing areas. The forecast does not suggest uniformly extreme rainfall across every core cocoa district, but it does indicate that the generally wet pattern is likely to continue.
This is becoming particularly relevant for Côte d’Ivoire. Farmers reported last week that soil moisture was already sufficient to support tree development and that additional sunshine was now needed for the September-to-February main crop. They warned that prolonged cool and wet conditions could complicate crop treatment and increase disease risk as pods develop.
For Ghana, continued rainfall deserves even closer attention because excessive moisture has already been associated with weaker pod development in key Western producing areas. If persistent rainfall is accompanied by prolonged cloud cover and insufficient drying periods, the risk shifts from inadequate soil moisture toward black pod and other fungal pressure, difficulties applying fungicides, reduced sunshine and slower pod maturation.
Futures performance
New York cocoa
New York cocoa stabilised on 7 August following the broad decline recorded during the previous session. Based on final recorded close prices, four of the five nearest contracts finished above their 6 August levels, although the increases were relatively modest compared with the losses recorded a day earlier.
September 2026 was almost unchanged, rising just $1 per tonne, or 0.02%, to $5,724. Gains became progressively larger further along the curve, with December increasing $18 to $5,847, March gaining $25 to $5,936 and May rising $30 to $5,941. July was the exception, declining $6 to $5,934.
| CONTRACT | 6 AUG | 7 AUG | CHANGE | CHANGE % |
|---|---|---|---|---|
| Sep-26 | $5,723 | $5,724 | +$1 | +0.02% |
| Dec-26 | $5,829 | $5,847 | +$18 | +0.31% |
| Mar-27 | $5,911 | $5,936 | +$25 | +0.42% |
| May-27 | $5,911 | $5,941 | +$30 | +0.51% |
| Jul-27 | $5,940 | $5,934 | -$6 | -0.10% |
Despite the generally positive close-to-close performance, intraday trading remained highly volatile. The five nearest contracts traded through ranges of approximately $248–$279 per tonne during the session.
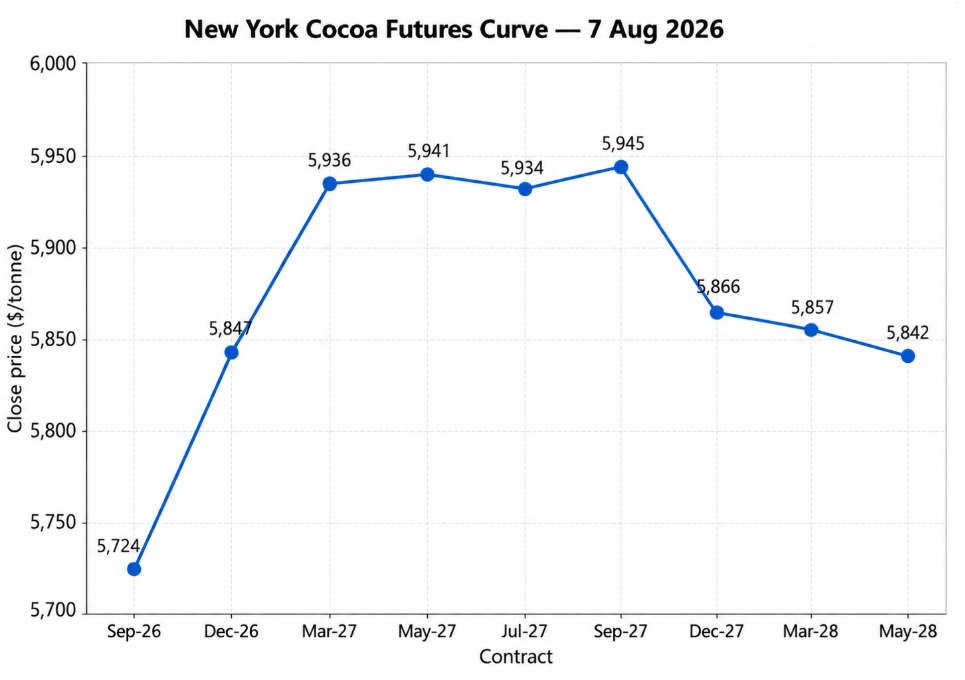
The New York futures curve continued to display contango at the front of the structure.
The September-to-May premium widened materially, increasing from $188 per tonne on 6 August to $217 on 7 August. The September-to-December contango also expanded, from $106 to $123 per tonne.
A particularly notable adjustment occurred around the middle of the curve. On 6 August, July traded at a $29 premium to May. By 7 August, July was trading $7 below May. At the same time, September 2027 moved above July by $11 per tonne, shifting the highest point of the curve from July into September.
Backwardation beyond the peak of the curve also became more pronounced. The September-to-December 2027 premium widened from $42 per tonne on 6 August to $79 on 7 August.
The structure therefore changed more significantly than the relatively small outright price movements might initially suggest. Front-end contango became wider, the previous May-to-July upward slope disappeared, and the highest point of the curve shifted into September 2027 before prices declined more sharply toward December.
London cocoa
London cocoa recorded a mixed session on 7 August following the substantial losses seen a day earlier. Unlike New York, the five nearest contracts did not move uniformly higher on a close-to-close basis.
September 2026 declined by £10 per tonne, or 0.24%, to £4,238, while December slipped £4 to £4,276. March and May recovered modestly, gaining £5 and £6 respectively, before July declined £6 to £4,370.
| CONTRACT | 6 AUG | 7 AUG | CHANGE | CHANGE % |
|---|---|---|---|---|
| Sep-26 | £4,248 | £4,238 | -£10 | -0.24% |
| Dec-26 | £4,280 | £4,276 | -£4 | -0.09% |
| Mar-27 | £4,373 | £4,378 | +£5 | +0.11% |
| May-27 | £4,372 | £4,378 | +£6 | +0.14% |
| Jul-27 | £4,376 | £4,370 | -£6 | -0.14% |
Despite the limited close-to-close movements, intraday volatility remained substantial. The five nearest London contracts traded through remarkably similar daily ranges of approximately £183–£189 per tonne.
Final recorded prices finished around 56–63% of the way through their respective daily ranges. The contracts closed £102–£118 above their session lows while remaining £69–£81 below their highs.
This indicates that a meaningful intraday recovery developed after prices reached their lowest levels. Unlike New York, all five of the nearest London contracts finished above their opening prices. Nevertheless, September, December and July remained below their 6 August closing levels.
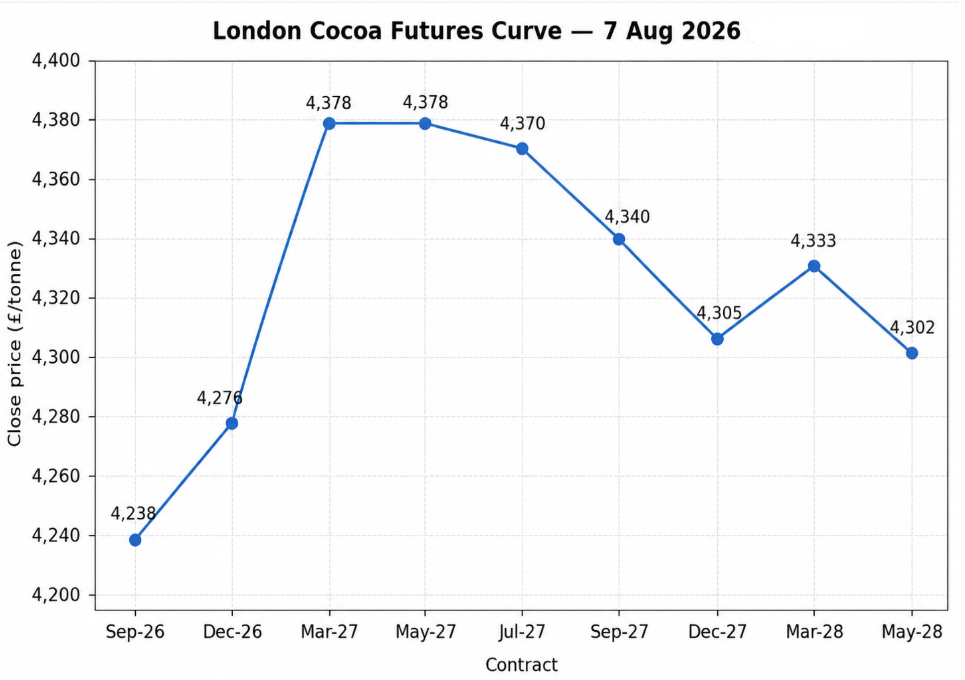
The front of the London futures curve remained in contango. September closed at £4,238 and December at £4,276 before the curve rose sharply to £4,378 in March. May also closed at £4,378, leaving the two contracts effectively flat at the highest point of the nearby curve.
July subsequently declined slightly to £4,370, followed by September 2027 at £4,340 and December at £4,305.
The September-to-May premium widened from £124 per tonne on 6 August to £140 on 7 August. The September-to-December contango also increased, from £32 to £38 per tonne.
As in New York, an adjustment occurred between May and July. On 6 August, July traded £4 above May. By 7 August, July had moved to an £8 discount, shifting the peak of the nearby curve back to March and May.
Backwardation remained evident through the second half of 2027, although it became marginally less pronounced. The May-to-December 2027 premium narrowed from £77 per tonne to £73.
Further along the curve, however, the recorded closes changed considerably. March 2028 closed at £4,333 compared with £4,249 on 6 August, while May 2028 increased from £4,161 to £4,302. These deferred contracts should be interpreted cautiously because liquidity becomes considerably thinner further along the curve, particularly in May 2028, where only 22 contracts traded during the session.
US–UK Spread
(Sep Contract)
$5,724 − (£4,238 x 1.347$/£) =$15ton (up from $9 ton )
Volume and Open Interest
New York cocoa
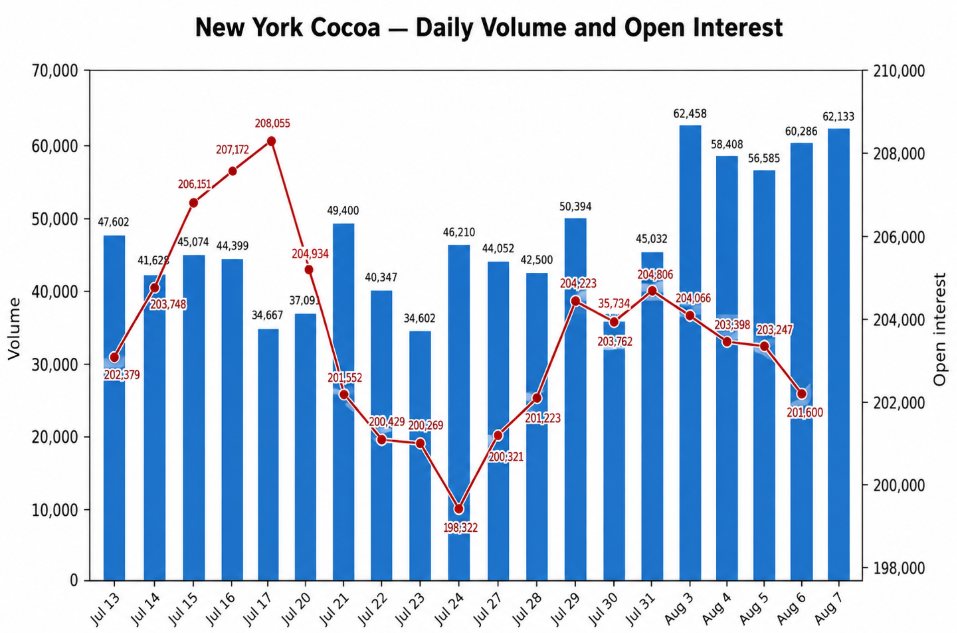
New York cocoa trading activity increased further on 7 August even as outright prices stabilised following the sharp losses recorded earlier in the week. Daily volume reached 62,133 contracts, up 1,847 contracts, or 3.1%, from 60,286 on 6 August.
This was the second-highest daily volume for the past month and only 325 contracts, or 0.5%, below the recent peak of 62,458 contracts recorded on 3 August. Volume also stood approximately 34.0% above the average of the preceding 15 sessions, confirming that market participation remained exceptionally strong.
The combination of very high turnover and relatively limited close-to-close price changes is notable. Unlike the previous two sessions, when heavy trading accompanied substantial price declines, 7 August saw the market absorb another large amount of activity without extending the sell-off materially. September was almost unchanged, while December through May recovered modestly.
This suggests that Friday's session involved substantial repositioning and two-way participation rather than a simple continuation of liquidation pressure. The market remained highly active, but the increase in volume was accompanied by greater price stability, potentially indicating that selling interest was being met by stronger buying demand around the lower price levels reached during the session.
The latest available observation of Open Interest was 201,600 contracts on 6 August, compared with 203,247 contracts on 5 August. This represents a decline of 1,647 contracts, or 0.8%.
Open interest has now declined for four consecutive sessions from 204,806 contracts on 31 July to 201,600 on 6 August, a cumulative reduction of 3,206 contracts, or approximately 1.6%. When considered alongside the very high trading volumes recorded during the week, this points to at least some position liquidation or closing of existing exposure rather than the activity being driven entirely by the establishment of new positions.
London cocoa
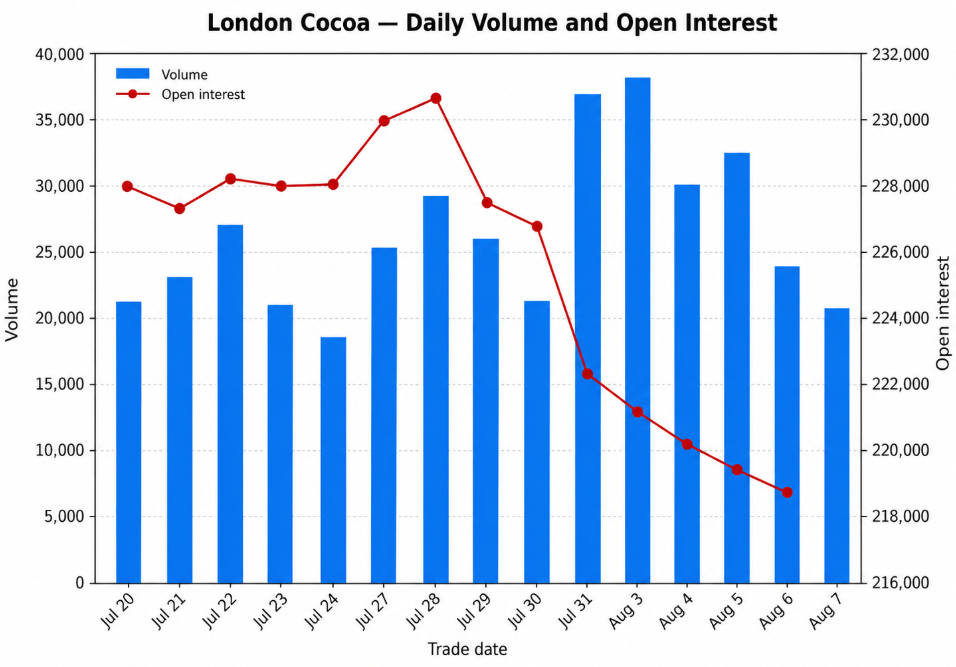
London cocoa trading activity moved in the opposite direction on 7 August. Daily volume fell to 20,915 contracts, down 3,115 contracts, or 13.0%, from 24,030 on 6 August.
This was one of the weakest trading sessions in the recent sample. Only the 18,744 contracts recorded on 24 July were lower, while volume on 7 August stood approximately 22.2% below the average of the preceding 14 available sessions.
The decline in activity is particularly notable when compared with the elevated turnover seen earlier in the week. London volume reached 38,327 contracts on 3 August, 30,170 on 4 August and 32,696 on 5 August before falling sharply during the final two sessions of the week.
Friday's mixed close-to-close price performance therefore occurred against considerably lighter participation than the earlier moves. September, December and July finished marginally lower, while March and May recorded small gains. This suggests that the market was moving into a period of consolidation following the earlier volatility, with fewer participants actively repositioning by the end of the week.
The latest reported Open interest figure was 218,344 contracts on 6 August, down 575 contracts, or 0.3%, from 218,919 on 5 August.
More importantly, London open interest has been declining persistently since reaching 230,455 contracts on 28 July. By 6 August it had fallen by 12,111 contracts, or approximately 5.3%, across seven consecutive sessions.
The sustained decline in open interest, combined with the sharp reduction in trading volume toward the end of the week, suggests that a meaningful part of the recent market activity has involved positions being reduced or closed. Compared with New York, where turnover remained exceptionally strong on Friday, London showed clearer signs of declining participation as the week came to an end.
Commitments of Traders – 4 August 2026
The latest COT data showed that speculative positioning remained bearish in both cocoa markets, although the U.S. report indicated some reduction in outright bearish exposure. In New York, non-commercial traders held 25,956 long contracts against 39,276 shorts, leaving them net short 13,320 contracts. This represented an improvement of 2,107 contracts from the previous week, as speculative longs increased by 973 while shorts were reduced by 1,134. The largest change, however, came from spread positions, which increased by 8,206 contracts to 111,024, suggesting that much of the increase in market participation was concentrated in relative-value and spread strategies rather than outright directional exposure. Total open interest rose sharply by 14,188 contracts to 277,024, an increase of approximately 5.4%.
Commercial positioning moved in the opposite direction. U.S. commercial traders remained net long, with 128,481 longs against 117,072 shorts, but their net long position declined from approximately 14,215 to 11,409 contracts as commercial shorts increased faster than longs. Overall, the U.S. data therefore showed a market in which funds remained bearish but had begun to reduce some of their net short exposure while broader positioning and spread activity expanded substantially.
In London, Managed Money also remained net short, holding 6,134 longs against 11,013 shorts for a net short position of 4,879 contracts. Directional fund exposure was relatively small compared with the 38,937 contracts held as spreads, again indicating substantial non-directional positioning. Producer/Merchant/Processor/User participants were considerably net short at 26,955 contracts, while Swap Dealers were strongly net long by 29,446 contracts, largely offsetting the commercial producer exposure. Other Reportables were almost balanced directionally, with a modest net long position of 347 contracts, while their spreading exposure remained substantial at 50,869 contracts.
Exchange Trading Volume
| EXCHANGE | 6 AUG 2026 | 7 AUG 2026 | CHANGE | % CHANGE |
|---|---|---|---|---|
| ICE U.S. Cocoa | 3,365,988 | 3,360,640 | -5,348 | -0.16% |
| ICE Europe Cocoa | 1,145,938 | 1,145,938 | 0 | 0.00% |
| Combined | 4,511,926 | 4,506,578 | -5,348 | -0.12% |
The measure is not a complete regional stock-to-grind ratio, as it includes only exchange-certified cocoa held at U.S. and EU delivery ports and excludes commercial inventories outside the ICE warehouse system. North America NCA grindings cover processors across North America, while ICE U.S. certified stocks are stored at U.S. delivery ports. ECA reports bean usage in European countries and London-certified cocoa is held in European and UK delivery locations.
Readers can explore detailed cocoa market datasets, futures statistics, and historical indicators in the CocoaIntel Data Hub:
 Cocoa Intel
Monday Outlook
Monday may open with a cautious stabilisation bias after Friday’s volatile but largely unchanged close. If September holds the $5,700–$5,613 support zone, short-covering and bargain buying could lift prices back toward $5,780 and potentially $5,890. However, momentum remains fragile, and a break below $5,613 would suggest that Friday’s recovery was temporary, exposing the market to another move toward $5,550–$5,500. The near-term bias is neutral to slightly constructive, but confirmation requires a sustained move above Friday’s upper range.
If you notice any discrepancies in these figures or have extra information, please email hello@cocoaintel.com or leave a comment – corrections and additional insights are always welcome.