Cocoa Stabilizes as Strong Ivorian Grinding Meets Ghana Financing Risk (16 September 2026)


Cocoa futures rebounded across both markets on 16 September, although the closing profiles differed. New York Dec-26 gained $91, or 1.55%, to a last-trade close of $5,951 after trading between $5,876 and $6,047, a 2.91% intraday range. The contract remained above its previous close throughout the session and traded as much as 3.19% higher, but it finished 1.59% below the daily high and only 44% of the way up its range. Gains across the New York curve ranged from 1.43% to 1.88%. London Dec-26 rose £68, or 1.58%, to £4,378 within a £4,289–£4,424 range. It initially traded 0.49% below the previous close before rising as much as 2.65% above it and finishing approximately 66% up the range. London gains ranged from 1.41% to 1.72%, giving the market a firmer late-session profile than New York.
Côte d’Ivoire Grinding: Industrial Throughput Remains Strong
Côte d’Ivoire’s cocoa grind rose 21.3% year on year in August to 47,646 tonnes, according to exporters’ association GEPEX. This implies comparable processing of approximately 39,300 tonnes in August last year.
Season-to-date grindings reached 601,172 tonnes by the end of August, up 8.4% from 554,430 tonnes a year earlier. This was equivalent to approximately 79% of Côte d’Ivoire’s stated annual grinding capacity of 758,800 tonnes. Annualising the eleven-month total produces an indicative 655,800 tonnes, or 86% of capacity, while processing at August’s pace would place the season near 649,000 tonnes. These comparisons are directional rather than precise utilisation measures because GEPEX covers six major processors, whereas the capacity figure represents the entire national industry.
Strong throughput continues to support domestic bean demand and the production of liquor, butter and powder. Q4 derivative availability may therefore be more comfortable than nearby bean availability. However, with arrivals expected to remain below 15,000 tonnes per week in September and 25,000 tonnes per week in October before accelerating later, the immediate risk concerns timing, inventories and competition for beans rather than a confirmed national shortage.
Côte d’Ivoire Producer Unrest: Political Risk, Not Yet a Supply Shock
Seven producer organisations have backed strike action over the CFA1,200/kg farm-gate price, while SYNAP-CI’s separate ultimatum expired on September 16. Complaints include delayed payments, unsold cocoa, electronic producer-card problems and the additional burden of new traceability requirements.
No nationwide strike or confirmed physical-flow disruption had been reported at the time of writing. The August grinding data predate the escalation and therefore cannot establish whether September collection or deliveries have been affected. For now, the dispute remains an elevated political and operational risk rather than a demonstrated supply shock.
The market should watch farm selling, cooperative collection, truck movements, port deliveries and processing activity for evidence of disruption. Incomplete deployment of payment terminals and traceability equipment could amplify even limited protests when larger new-crop volumes begin moving in October.
Ghana: Financing Risk Moves Closer to the Physical Market
Ghana’s licensed cocoa buyers say COCOBOD owes them approximately GH¢4 billion, equivalent to about $349 million, for cocoa delivered during the previous season. The Chamber of Cocoa Marketers has warned that buyers need the arrears resolved and dependable financing established before they can purchase and deliver cocoa when the new season opens.
COCOBOD has not yet communicated an official opening date to licensed buyers. This adds to the uncertainty surrounding the purchasing system, particularly after Ghana and Côte d’Ivoire agreed to work toward harmonising their producer prices and season-opening dates. Côte d’Ivoire opened its new season on September 1, while Ghana’s buyers are still waiting for clarity.
COCOBOD maintains that the outstanding amounts form part of the normal reimbursement cycle and says licensed buying companies can initially finance purchases themselves before being reimbursed. The practical difficulty is that buyers already carrying unpaid balances may have limited capacity to secure additional credit and restart the purchasing cycle.
COCOBOD is reportedly exploring a GH¢2 billion bridge-financing facility on the domestic market. If the entire amount were used to settle existing obligations, it would cover only around half of the reported GH¢4 billion balance. In practice, financing would also be required to support new-season purchasing rather than simply clear historic arrears.
The central question is therefore not whether financing discussions are taking place, but whether sufficient ring-fenced liquidity reaches the purchasing system before farmers begin marketing larger volumes. Without dependable and prompt reimbursement, licensed buyers may be unable to recycle their working capital quickly enough to maintain normal purchasing activity.
Ecuador: El Niño Raises Flood and Disease Exposure
Ecuador’s National Action Plan for the 2026–27 El Niño event, approved in July, identifies 494,274 hectares of crops as highly exposed to flooding. The largest areas are concentrated in the coastal provinces of Guayas, Los Ríos, El Oro, Manabí and Esmeraldas, which include several of the country’s principal cocoa-producing zones.
Guayas alone accounts for 268,761 hectares of exposed agricultural land, encompassing crops such as rice, industrial sugar cane, bananas and cocoa. Los Ríos follows with 121,289 hectares, while El Oro, Manabí and Esmeraldas account for a further 43,858, 32,006 and 26,776 hectares respectively.
A separate 606,584 hectares of agricultural land are classified as highly exposed to landslides and other mass movements. The flood and landslide areas may overlap and should therefore not be combined into a single national exposure figure.
Colombia: Reference Cocoa Price Pulls Back
Colombia’s official weekly reference buying price for cocoa declined to COP15,520 per kilogram for September 14–20, according to AgroNET and UPRA. This represents a 4.0% decrease from COP16,162/kg during the previous week and a 4.9% decline from COP16,311.70/kg two weeks earlier.
Despite the latest pullback, the reference price remains approximately 3.3% above the COP15,027.50/kg recorded during August 24–30 and almost 7% above its mid-August level. The movement therefore represents a correction following several weeks of strengthening rather than a collapse in Colombian origin prices.
The benchmark is based on purchasing indications supplied by domestic industry and exporters. It provides a useful measure of the direction of Colombian origin prices, but it is not a direct indicator of production, physical bean availability or export volumes. Weekly movements may also reflect changes in international futures, exchange rates and commercial purchasing conditions.
The latest decline consequently represents a softer origin-price signal, but it does not by itself demonstrate that Colombia is experiencing either an emerging surplus or an absence of nearby physical demand.
Futures performance
New York cocoa
| Contract | 15 Sep close | 16 Sep close | Change | Change % |
|---|---|---|---|---|
| Dec-26 | $5,860 | $5,951 | +$91 | +1.55% |
| Mar-27 | $5,987 | $6,080 | +$93 | +1.55% |
| May-27 | $6,040 | $6,140 | +$100 | +1.66% |
| Jul-27 | $6,048 | $6,140 | +$92 | +1.52% |
| Sep-27 | $6,000 | $6,086 | +$86 | +1.43% |
| Dec-27 | $5,853 | $5,963 | +$110 | +1.88% |
| Mar-28 | $5,759 | $5,864 | +$105 | +1.82% |
New York cocoa rebounded across every comparable maturity on 16 September, partially reversing the previous session’s broad decline. Dec-26 rose $91, or 1.55%, to $5,951, while gains across the curve ranged from 1.43% to 1.88%. The strongest increases occurred toward the back of the curve, where Dec-27 gained $110 and Mar-28 advanced $105. The recovery regained approximately 54%–69% of the losses recorded on 15 September, but all seven contracts remained below their 14 September closes. The rebound therefore repaired part of Tuesday’s decline without fully reversing it.
The intraday ranges confirm that the rebound held throughout the session: every comparable contract remained above its 15 September close, even at the day’s low. Dec-26 traded between $5,876 and $6,047 before closing at $5,951, approximately 44% of the way up its daily range. Mar-27 through Mar-28 finished between roughly 47% and 59% of their respective ranges. Prices therefore held above Tuesday’s closes, but the final positions around the middle of the ranges show that buyers did not sustain the strongest levels reached during the session.
New York cocoa futures curve
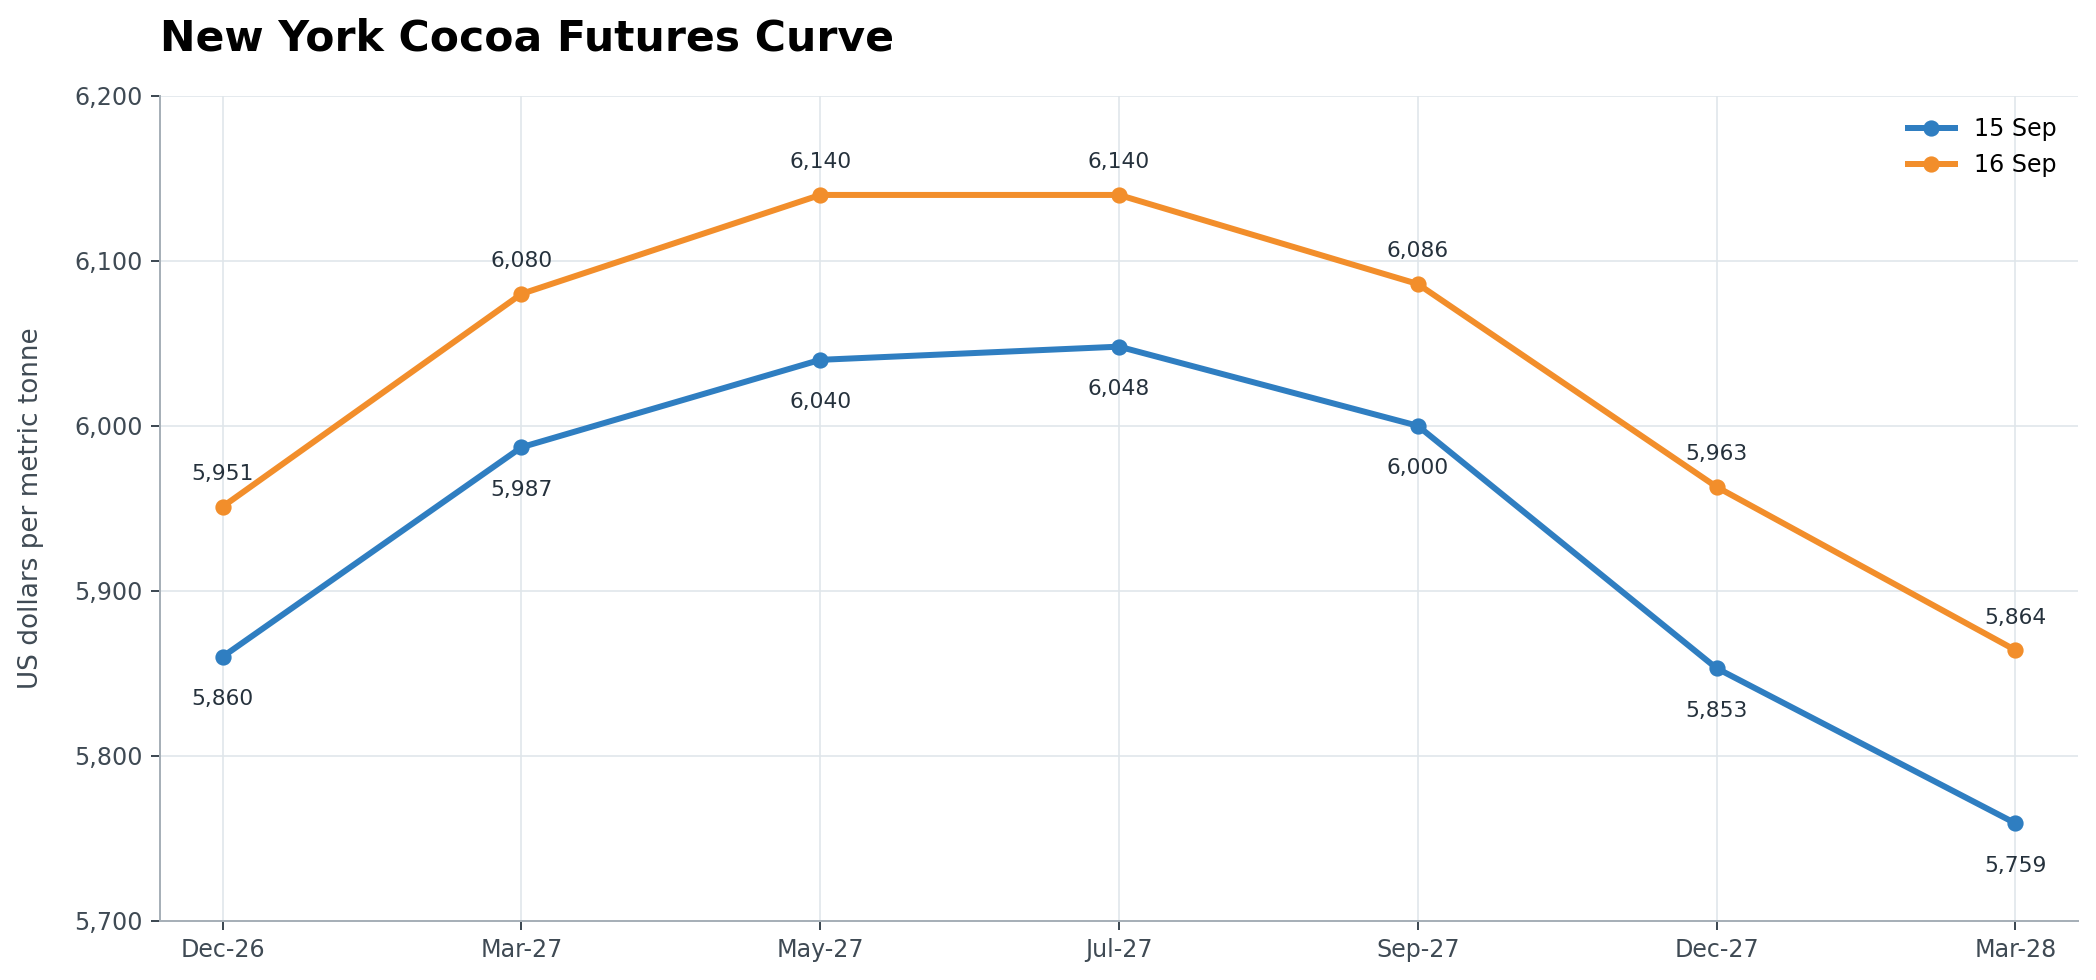
The entire comparable New York curve shifted higher, with the largest absolute gains concentrated in late 2027 and early 2028. Dec-27 and Mar-28 outperformed the front of the curve, while Sep-27 recorded the smallest increase. The highest closing price moved from Jul-27 at $6,048 on 15 September to a flat May-27/Jul-27 plateau at $6,140 on 16 September.
There were also meaningful changes in the curve structure. Dec-26/Mar-27 contango widened slightly from $127 to $129, while the May-27/Jul-27 relationship moved from $8 contango to flat. Jul-27/Sep-27 backwardation widened from $48 to $54. Farther out, Sep-27/Dec-27 backwardation narrowed from $147 to $123 as Dec-27 outperformed, while the Dec-26/Dec-27 relationship flipped from $7 backwardation to $12 contango. The session therefore provided proportionally greater support to the back of the curve than to nearby Dec-26.
London Cocoa
London cocoa also advanced across every comparable maturity on 16 September. Dec-26 gained £68, or 1.58%, to £4,378, while increases along the curve ranged from 1.41% to 1.72%. Sep-27 recorded the largest advance, rising £76, while Mar-27 posted the smallest percentage gain.
London’s rebound was more complete than New York’s when measured against the previous session’s decline. Mar-27 returned exactly to its 14 September close, while May-27, Jul-27 and Sep-27 finished above their 14 September levels. Dec-26, Dec-27 and Mar-28 remained modestly below them. The middle of the London curve therefore fully recovered Tuesday’s losses, whereas the nearby and deferred ends recovered only part of the decline.
The intraday ranges also show a firmer recovery than in New York. Every comparable London contract traded below its 15 September close at some point, but all recovered to finish higher. Dec-26 traded between £4,289 and £4,424 before closing at £4,378, approximately 66% of the way up its daily range. The other comparable contracts finished between roughly 66% and 72% of their respective ranges. London therefore sustained a stronger late-session position than New York, although prices still closed below the day’s highs.
London Futures Curve
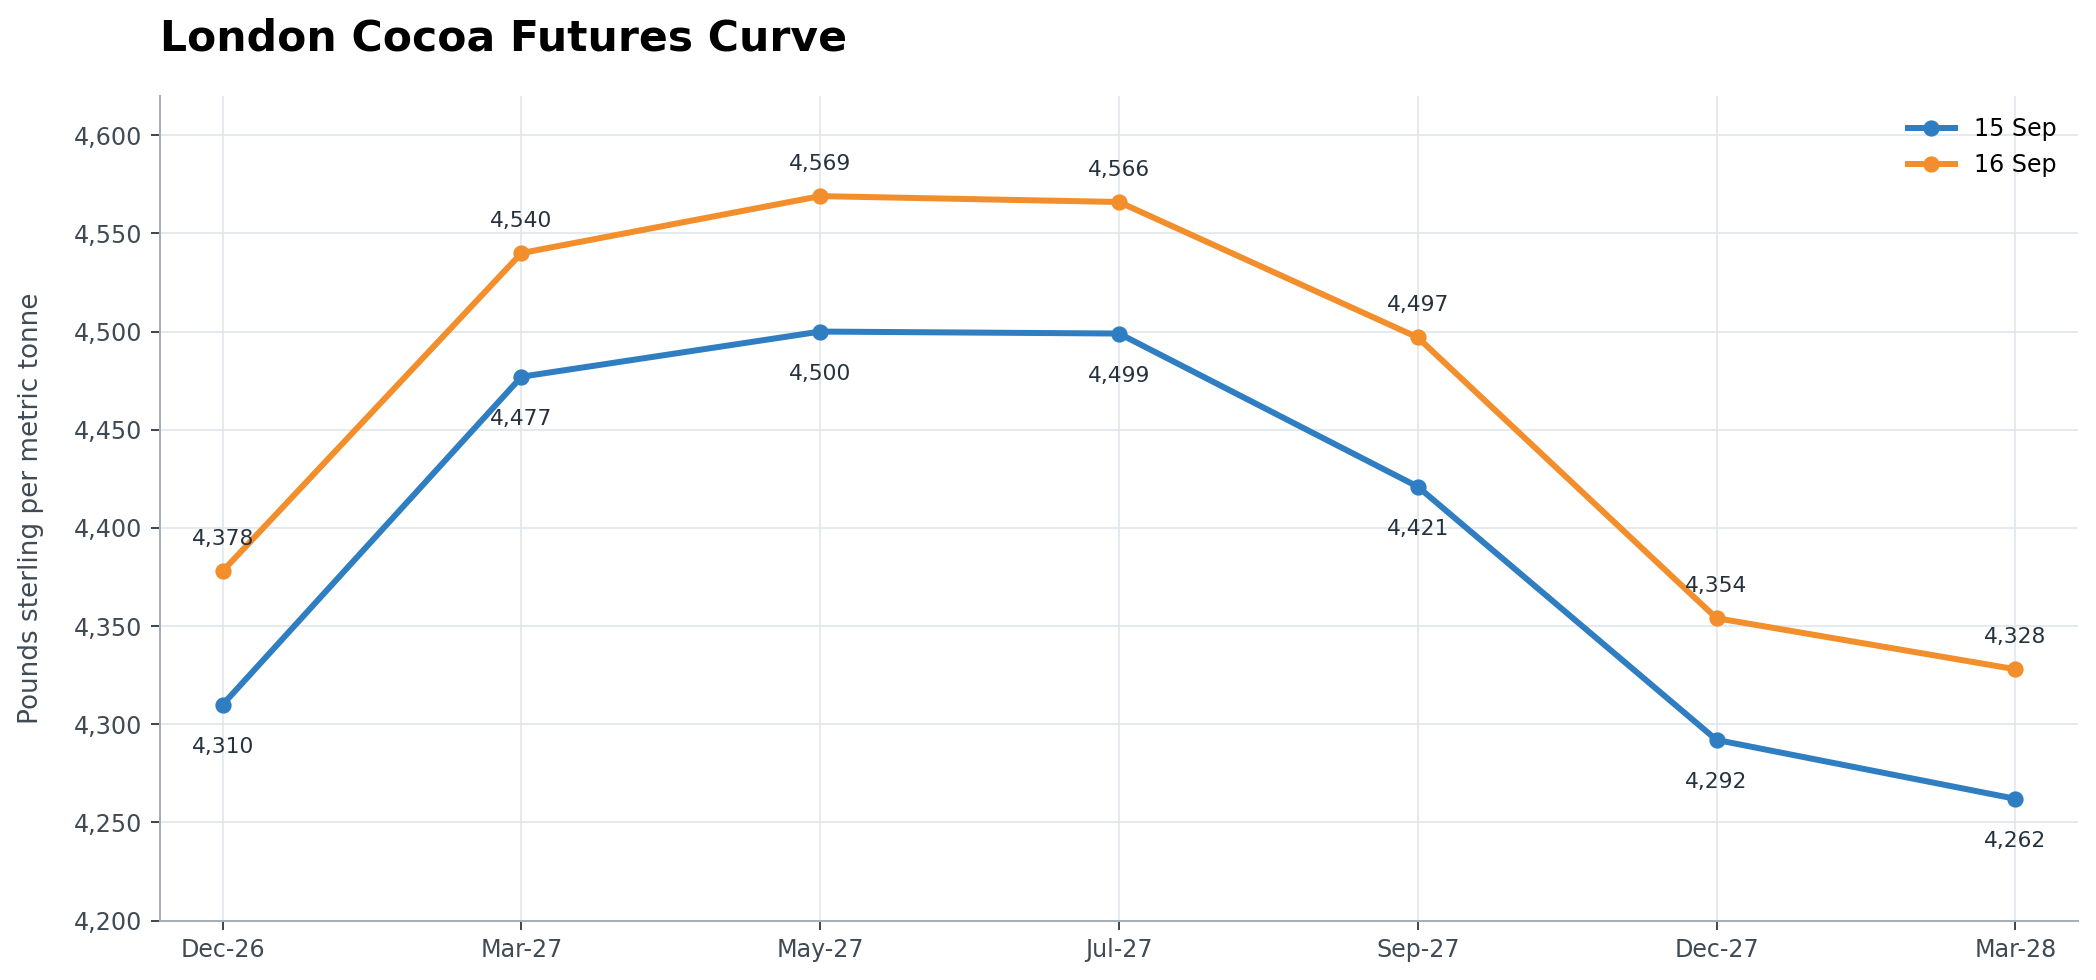
The London curve shifted higher while retaining its May-27 peak. May-27 closed at £4,569, only £3 above Jul-27 at £4,566. Relative strength was concentrated around the middle of the curve, where May-27 through Sep-27 recovered all of the previous session’s decline.
Dec-26/Mar-27 contango narrowed from £167 to £162, while Mar-27/May-27 contango widened from £23 to £29. May-27/Jul-27 backwardation increased slightly from £1 to £3, leaving the curve almost flat around its high point. Jul-27/Sep-27 backwardation narrowed from £78 to £69, but Sep-27/Dec-27 backwardation widened from £129 to £143 as Sep-27 outperformed. Dec-26/Dec-27 backwardation also widened from £18 to £24. These changes show that the rebound strengthened the middle of the curve more than deferred Dec-27.
NY–London Dec-26 Spread
$5,951 − (£4,378 x 1.338$/£) =$93ton
NY Dec-26 premium to London Dec-26: approximately $93/t, up from roughly $54/t on 10 September.
Volume and Open Interest
New York Cocoa
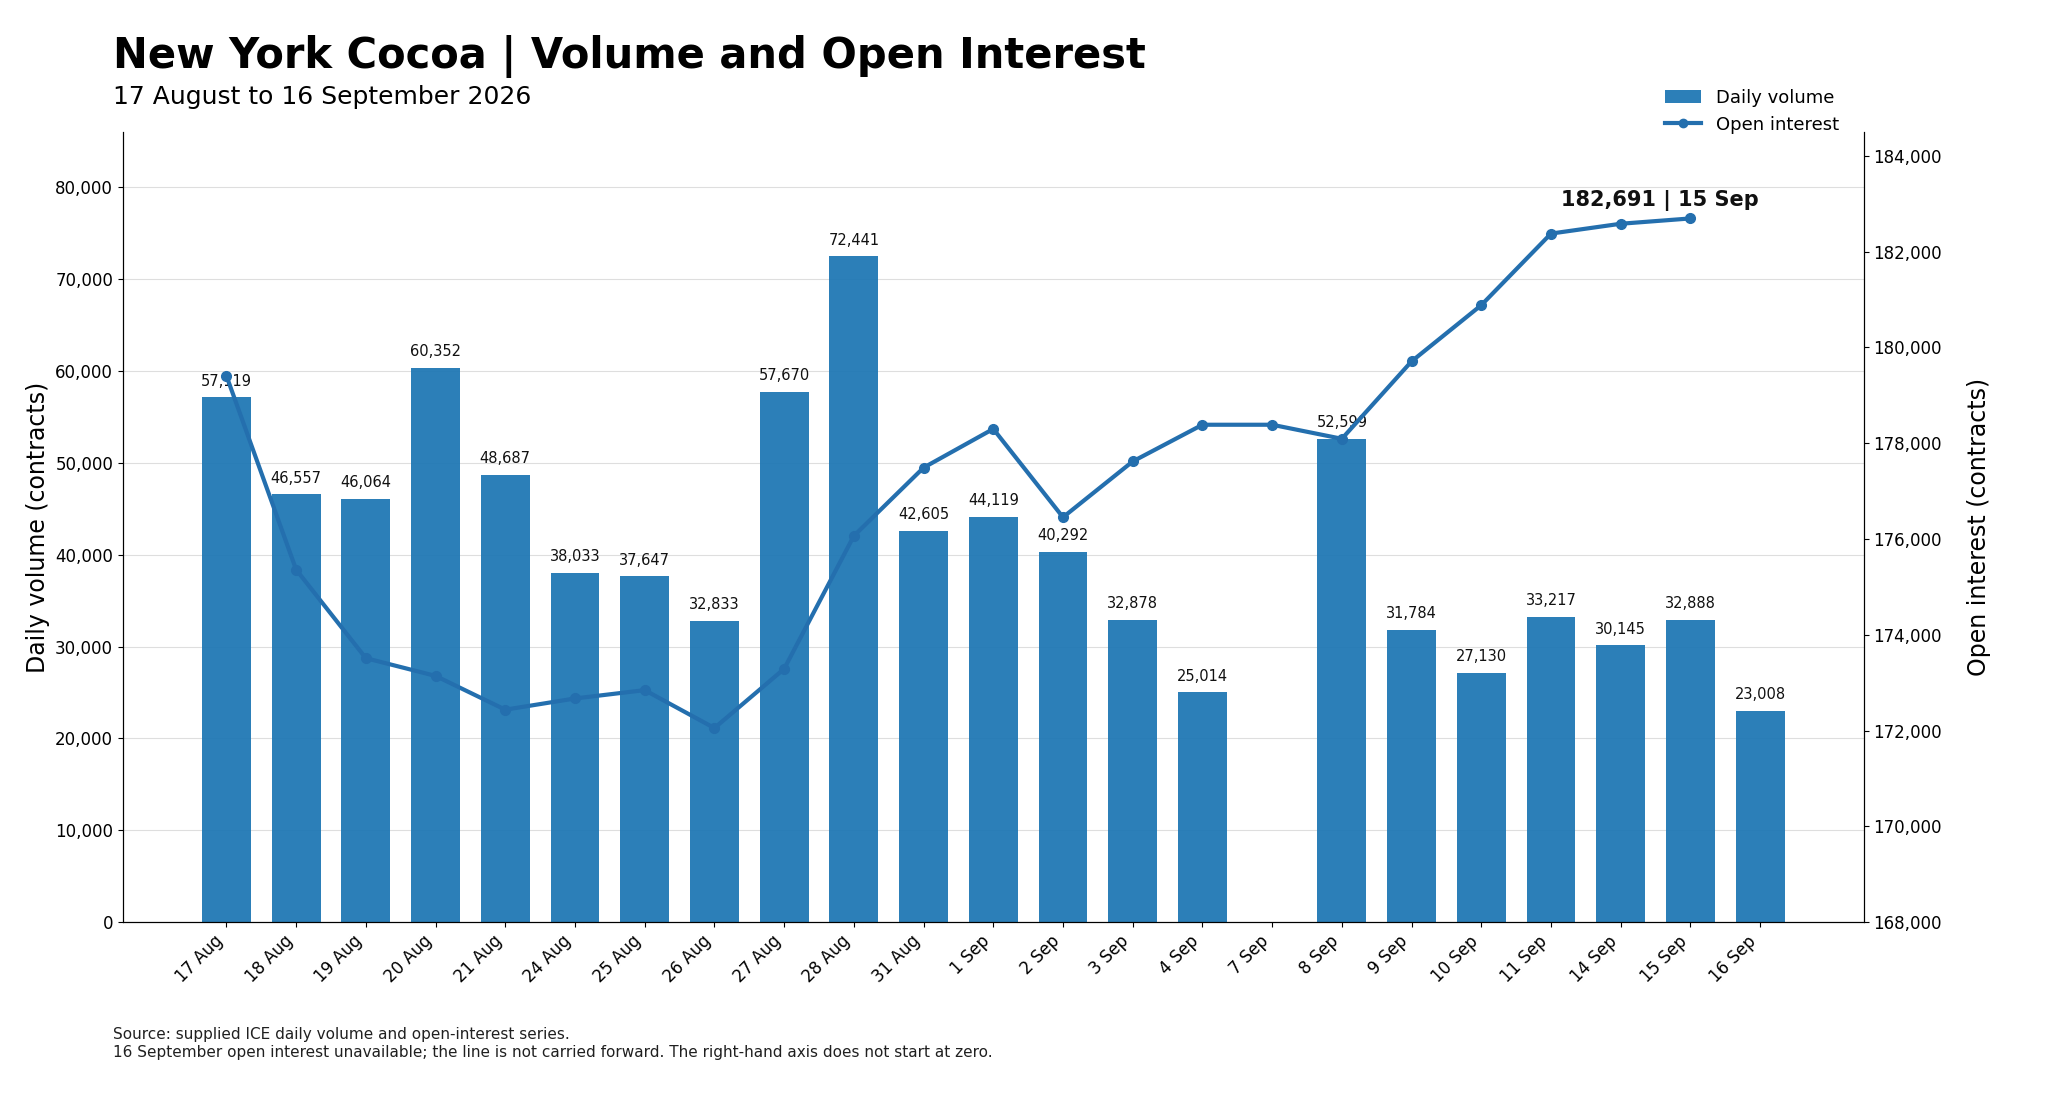
New York cocoa volume fell to 23,008 contracts on 16 September, down 30.0% from 32,888 contracts on 15 September. Turnover was 43.1% below the recent 20-session average of 40,470 contracts and 68.2% below the 28 August peak of 72,441. It was the lowest non-holiday volume in the period shown.
The latest valid open-interest reading is 182,691 contracts for 15 September, up only 111 contracts from the previous session but still the highest level in the series. OI has risen 10,636 contracts, or 6.2%, from its 26 August low. Because Tuesday’s falling prices were accompanied by a marginal increase in OI, the decline involved at least some new positioning rather than being driven entirely by long liquidation.
Wednesday’s price rebound consequently occurred with considerably weaker participation. The low volume does not invalidate the recovery, but it provides limited evidence of a decisive change in direction. If the next OI figure declines, the rebound would look more consistent with short covering; another increase would suggest that fresh long exposure accompanied the higher prices.
London Cocoa
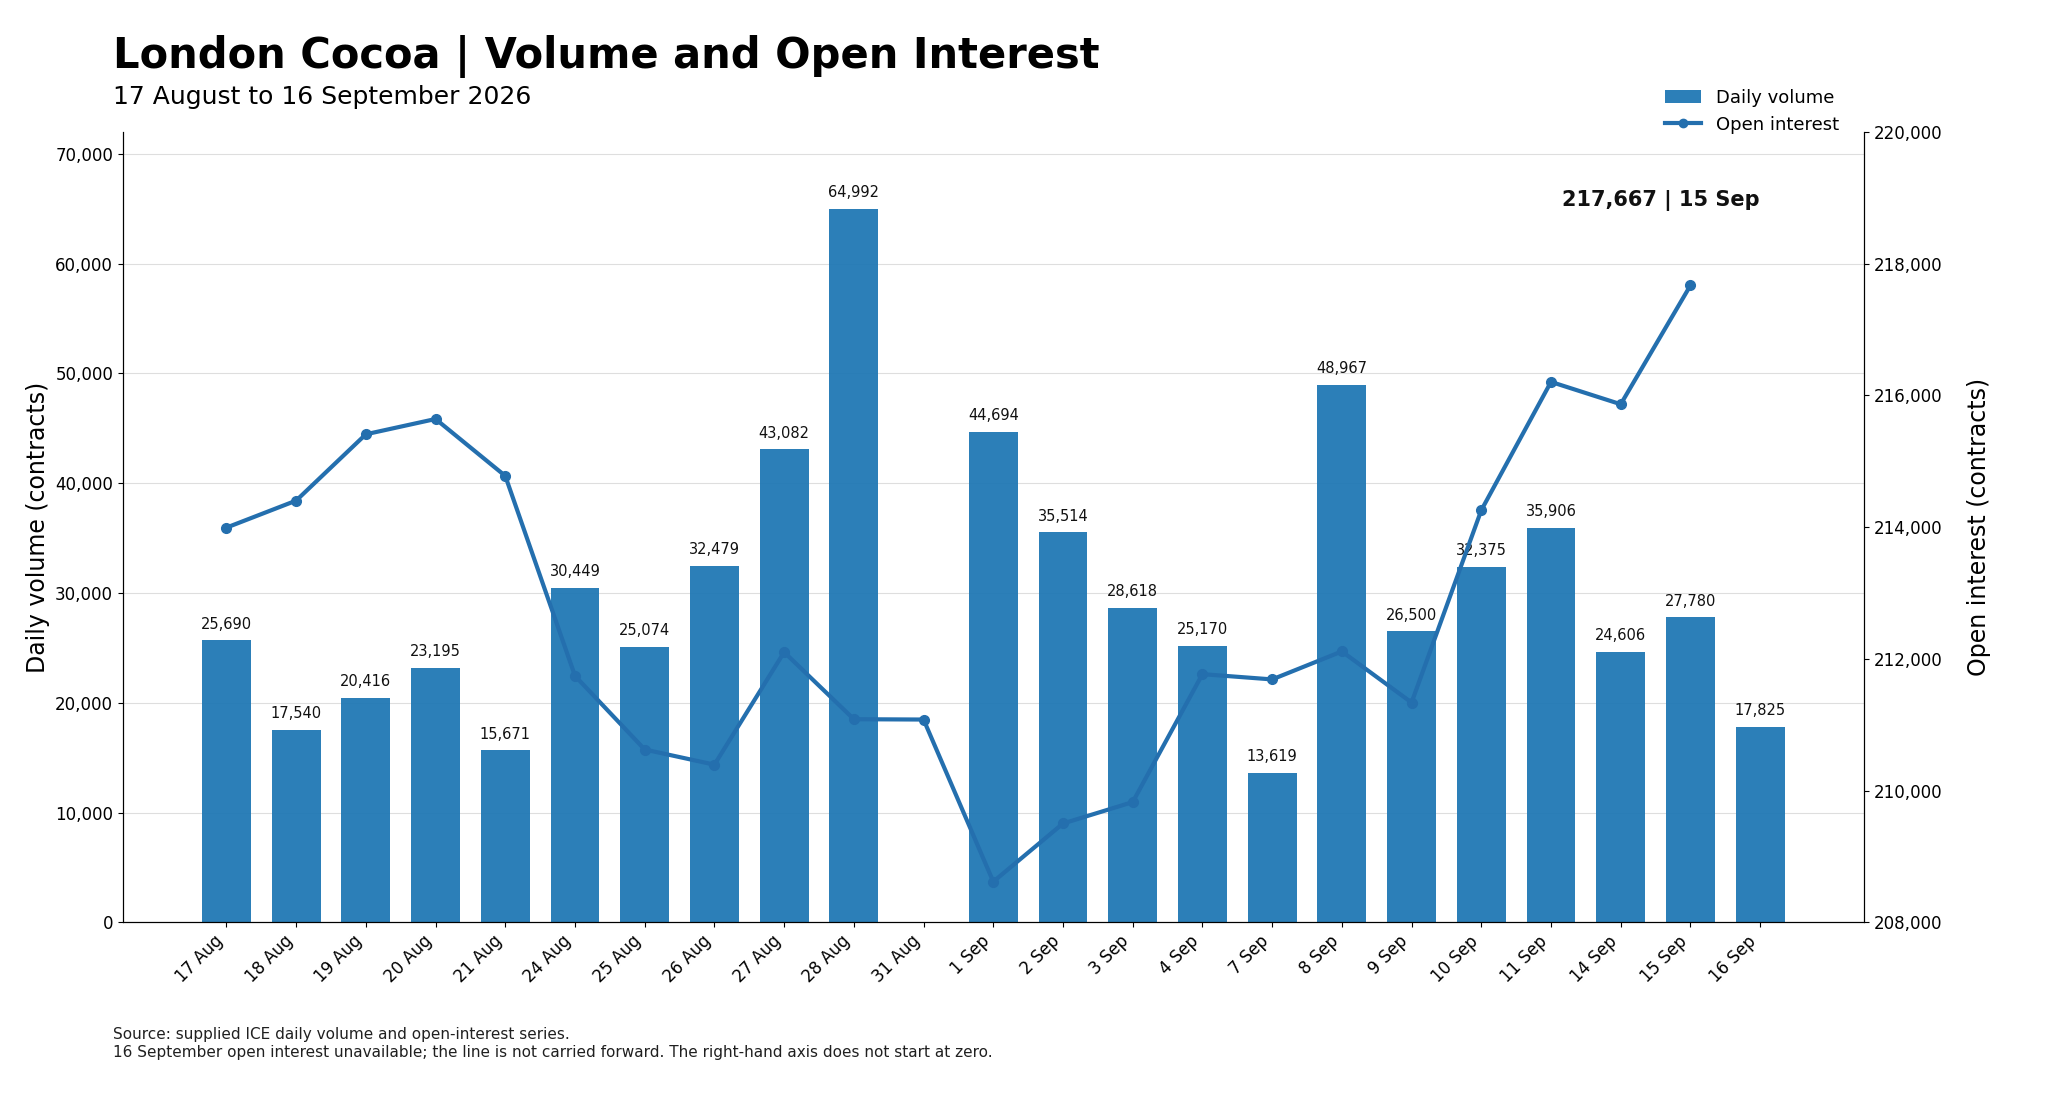
London cocoa volume declined to 17,825 contracts, down 35.8% from 27,780 contracts on 15 September. Turnover was 42.2% below the recent 20-session average of 30,847 contracts and 72.6% below the 28 August peak of 64,992. It was the fourth-lowest non-zero volume in the period.
The latest available London OI reading is 217,667 contracts for 15 September, up 1,803 contracts, or 0.8%, and the highest level in the series. Open interest has increased by 9,050 contracts, or 4.3%, from its 1 September low. The sizeable OI increase alongside Tuesday’s falling prices provides stronger evidence than in New York that the decline attracted fresh short positioning, producer hedging or other new exposure.
London’s subsequent rebound occurred on sharply reduced volume. A fall in the next OI reading would suggest that short covering contributed materially to the recovery, while another increase would provide firmer evidence that buyers established new length. For now, the rebound is constructive in price terms but weakly confirmed by participation.
Spread trading represented 63.2% of New York volume and 63.7% of London volume. The New York zero and London blank for 16 September OI have correctly been treated as unavailable data.
ICE Cocoa Stocks
| Market | 15 Sep 2026 | 16 Sep 2026 | Change | Change % |
|---|---|---|---|---|
| US | 3,421,650 | 3,429,334 | +7,684 | +0.22% |
| UK | 1,465,313 | 1,481,719 | +16,406 | +1.12% |
Reported cocoa stocks increased in both markets. US stocks rose modestly by 7,684 bags to 3.429 million, while UK stocks increased by 16,406 bags to 1.482 million. Combined visible stocks grew by 24,090 bags, or 0.49%, with the UK contributing approximately 68% of the increase.
The continued UK build marginally improves the visible European availability picture. Against the 16 September futures rebound, the stock increase suggests that higher prices were not driven by an immediate tightening in exchange-visible supply. However, a single daily increase is insufficient to confirm a sustained rebuilding trend.
Readers can explore detailed cocoa market datasets, futures statistics, and historical indicators in the CocoaIntel Data Hub:
 Cocoa Intel
Thursday Trading Setup Dec Contract
The broader structure remains mixed. Price is below its short-term daily averages but above its longer-term trend measures; RSI is neutral and MACD remains negative. Hourly resistance is concentrated at $6,000–$6,047, followed by $6,090–$6,150.
The base case is two-way trade between approximately $5,870 and $6,040, with a slight bearish bias below $5,958. Initial weakness could test $5,925–$5,900 and the $5,876–$5,860 gap. A volume-backed break above $6,040–$6,047 would target $6,085–$6,105 and then $6,129. An hourly break below $5,869–$5,860 would expose $5,804–$5,787 and potentially $5,700. Confirmation requires an hourly close and stronger volume, not simply an intraday probe.
Strong Ivorian grinding, slow arrivals and Ghana’s financing difficulties provide underlying support, while rising exchange stocks, comfortable processed-product availability and a stronger dollar limit the upside. Below $5,958 sellers retain a modest tactical advantage; above $6,047 momentum turns constructive; below $5,860 Wednesday’s recovery has failed.
| Catalyst | Current signal | Horizon | Market implication |
|---|---|---|---|
| Price structure | Corrective rebound | Immediate | Broad gains, but New York failed to retain the move above $6,000 and closed well below $6,047 |
| Volatility | Compression | Immediate | Inside day and declining ATR increase the risk of range expansion once $5,860 or $6,047 breaks |
| Volume | Weak confirmation | Immediate | NY and London volumes fell 30.0% and 35.8%; directional participation was thinner still |
| Open interest | Elevated; 16 Sep unavailable | Next release | The next reading is needed to distinguish new buying from short covering |
| Côte d’Ivoire | Supportive nearby risk | Days to weeks | Strong grinding and slow arrivals maintain competition for beans; disruption remains unconfirmed |
| Ghana | Supportive supply-chain risk | Weeks | Financing constraints could delay purchasing and official deliveries without reducing production |
| Exchange stocks | Mildly bearish | Near term | Combined US and UK stocks increased 0.49%, weakening the immediate scarcity argument |
| US dollar | Mildly bearish | Immediate | Dollar strength may restrict upside in New York cocoa |
| Overall balance | Neutral to slightly bearish below $6,047 | Immediate | Expect rotation unless price leaves $5,860–$6,047 with stronger outright volume |
If you notice any discrepancies in these figures or have extra information, please email hello@cocoaintel.com or leave a comment – corrections and additional insights are always welcome.