Cocoa Surges Above $6,000 as EUDR Compliance Risks Threaten West African Supply (17 August 2026)


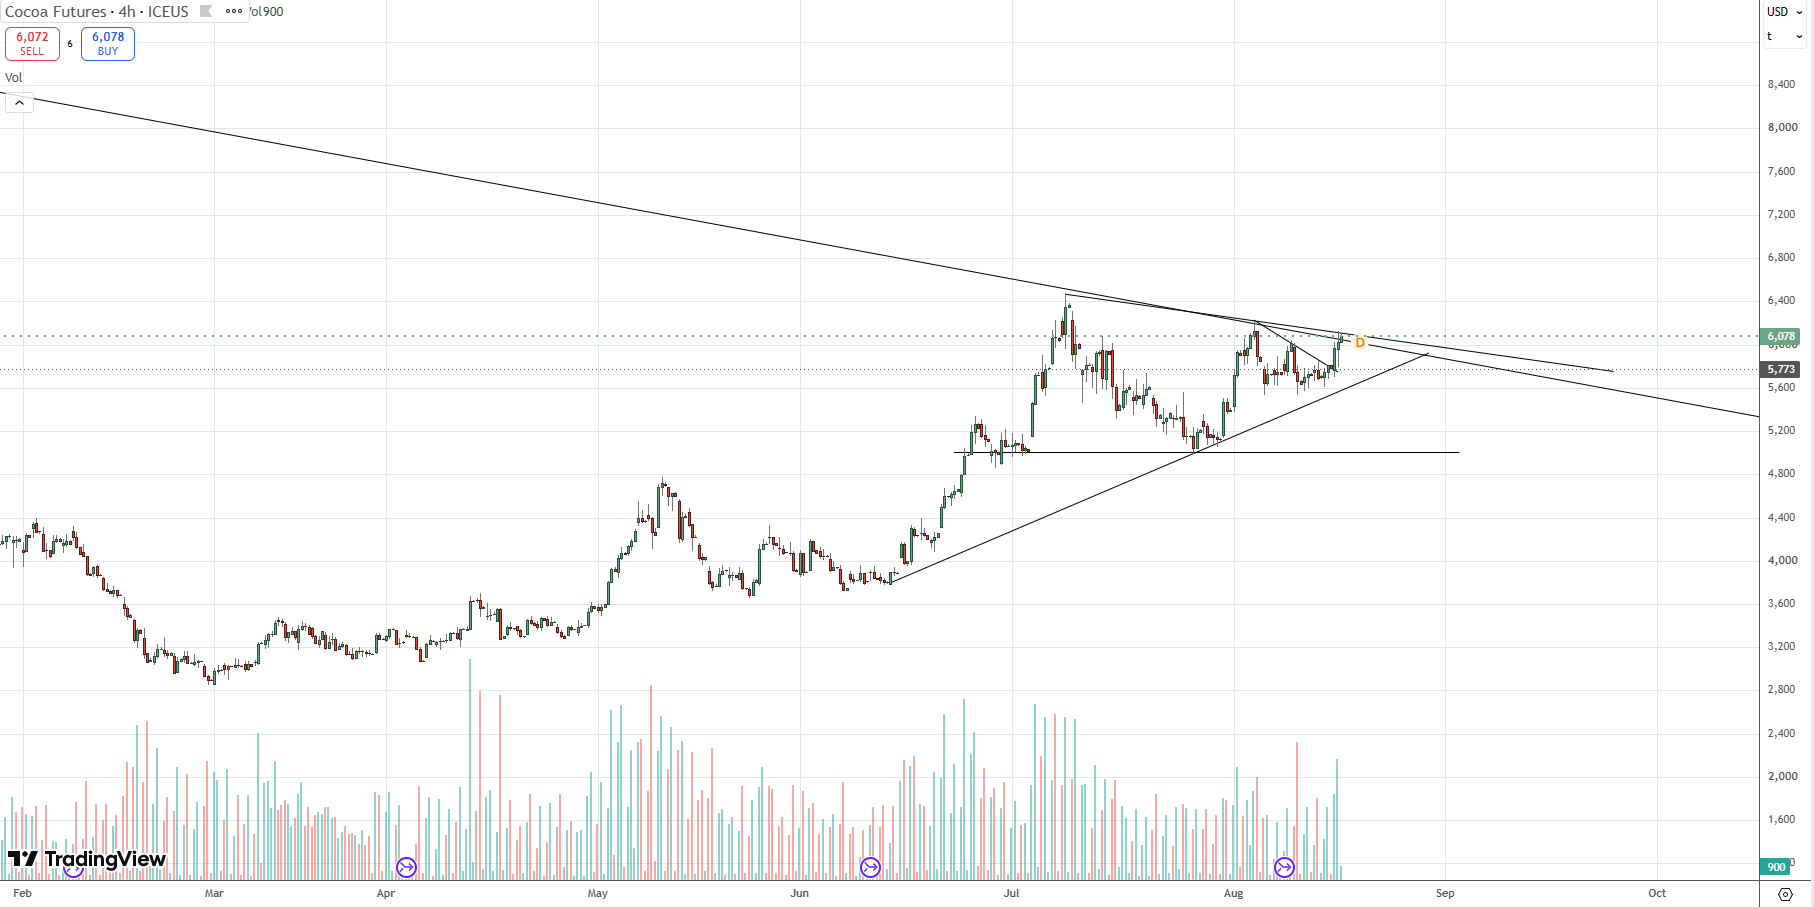
New York cocoa rallied sharply on Monday as the December 2026 contract confirmed its breakout above the descending trendline around $5,750/tonne. After opening at $5,764 and briefly falling to an intraday low of $5,696, the contract attracted sustained buying, moved decisively through the psychological $6,000 level and reached a session high of $6,126. Prices eased modestly from the peak but remained firm into the close, with Dec-26 ending at $6,078, up $292/tonne, or 5.05%, from the previous session. Total volume increased to 57,119 contracts, indicating strong participation in the advance.
Improving weather supports Ivory Coast’s main-crop development
According to Reuters weather conditions across much of Ivory Coast’s cocoa belt became more favourable during the previous week, as below-average rainfall was accompanied by prolonged sunny periods. Farmers reported that soil moisture remained adequate, foliage was healthy, and the combination of light rain and sunshine was supporting flowers and small-to-medium pods expected to be harvested between October and December. The drier intervals may also reduce disease pressure. Conditions were not uniformly favourable, however, as farmers in Daloa, Bongouanou and Yamoussoukro said additional rainfall before the end of August would be needed to improve pod filling. The report is therefore moderately bearish for prices from a supply perspective, although continued crop improvement remains dependent on timely rainfall during the remainder of the month.
Cumulative arrivals remain strong despite slower weekly deliveries
Ivory Coast cocoa arrivals reached an estimated 1.996 million tonnes by 16 August, an increase of 20.8% compared with the same stage of the previous season. The cumulative figure continues to indicate substantially stronger marketed supply during the 2025/26 season. However, only around 4,000 tonnes were delivered to Abidjan and San Pedro between 10 and 16 August, compared with 10,000 tonnes during the equivalent week last year. Weekly arrivals were therefore down 6,000 tonnes, or 60%, year on year.
The data present a mixed signal: the strong cumulative total remains bearish for the broader supply assessment, while the latest weekly flow has slowed sharply. However, the decline should not be interpreted solely as evidence that physical availability is being exhausted. It may also reflect the transition to the new marketing calendar, under which the 2026/27 cocoa season is scheduled to begin on 1 September rather than 1 October, effectively bringing the seasonal changeover forward by one month. Some farmers may also be delaying deliveries ahead of the new season in anticipation of the new farmgate price. Reuters previously reported that Ivorian farmers had withheld cocoa because they were unwilling to sell at the lower prevailing farmgate price.
EUDR compliance problems create risks for EU-bound cocoa supply
The West African cocoa sector continues to face significant difficulty preparing for the European Union’s anti-deforestation regulation. Industry estimates cited by Reuters suggest that more than half of Nigeria’s cocoa could initially fail to satisfy the new requirements, with similar traceability problems affecting Ivory Coast and other regional producers. In Ivory Coast, only around half of cocoa production is currently traceable to its farm of origin, while the remaining supply frequently passes through several intermediaries.
Exporters must map individual farms, verify land use, demonstrate compliance with domestic legislation and maintain detailed digital traceability records. Nigerian exporters reported compliance and mapping costs of approximately $30–$80 per tonne, with uncertainty over whether European buyers will absorb those expenses. The shortage of fully compliant cocoa could cause qualifying beans to trade at a premium, restrict the volume readily available to European importers and increase procurement costs for processors and chocolate manufacturers. The regulation does not directly reduce cocoa production, but it could temporarily reduce the amount of cocoa eligible for delivery into the EU market. This represents a medium-term bullish risk for compliant cocoa, European differentials and regional supply-chain costs.
Ghana tightens rules on cocoa purchases made on credit
A late-Friday development that carried into the weekend was COCOBOD’s warning to Licensed Buying Companies not to take cocoa from farmers without immediate payment. Repeat violations could result in the withdrawal of an LBC’s operating licence. The directive is linked to a new financing system planned for the 2026/27 season, which COCOBOD says should provide year-round liquidity, accelerate payments and reduce the debt accumulated by buying companies. The immediate implication is mixed: cash-only purchasing could temporarily restrict collections where an LBC lacks funding, but a successfully implemented financing model should improve farmer payments and make Ghana’s cocoa-marketing system more efficient.
Ghana’s Cocoa Board Bill received mixed farmer reactions
Weekend reporting showed divided views on Ghana’s new Cocoa Board Bill. A survey reported by Cocoa Media Hub found support among some farmers for provisions linked to farm protection and a minimum producer share of gross FOB value, although those farmers demanded transparent distribution of benefits and agricultural inputs. Reuters had separately reported that Ghana’s principal cocoa-farmer umbrella organisation wanted President John Dramani Mahama to delay signing the bill until contentious land-use restrictions and possible penalties were reviewed and better explained. The policy may help protect cocoa acreage from mining and conversion over the longer term, but the disagreement over implementation means its immediate market impact is limited
Olam results indicate normalising cocoa input costs
Olam Group’s H1 2026 results, published late on 14 August, showed group revenue falling 18.3% to S$12.5 billion, mainly because of lower cocoa and coffee input prices. Revenue at ofi declined 18.1%, although EBIT fell by a much smaller 4.9% to S$509.7 million. The company also reported that lower cocoa and coffee prices materially reduced its working-capital requirements. The results suggest that the financial burden associated with exceptionally high cocoa prices has eased for a major processor, although Olam did not provide a standalone cocoa-volume figure that would allow the report to be interpreted as direct evidence of stronger or weaker global grindings demand. This is useful as an industry note but is not a major short-term futures catalyst.
Futures performance
New York cocoa
| Contract | 14 Aug | 17 Aug | Change | Change % |
|---|---|---|---|---|
| Sep-26 | $5,740 | $6,049 | +$309 | +5.38% |
| Dec-26 | $5,786 | $6,078 | +$292 | +5.05% |
| Mar-27 | $5,859 | $6,158 | +$299 | +5.10% |
| May-27 | $5,870 | $6,164 | +$294 | +5.01% |
| Jul-27 | $5,883 | $6,152 | +$269 | +4.57% |
New York cocoa surged on 17 August, with every contract closing above the previous session. Sep-26 recorded the largest rise, gaining $309/tonne, or 5.38%, to $6,049. Mar-27 advanced $299 to $6,158, while May-27 gained $294 to $6,164. The rally was broad across the curve, although the larger gain in Sep-26 than in Jul-27 made the move modestly front-loaded.
Liquidity remained concentrated at the front of the curve. Sep-26, Dec-26 and Mar-27 generated 51,076 contracts, or 89.4% of total volume. Dec-26 was the most active maturity with 29,752 contracts, representing 52.1% of total volume. Aggregate volume reached 57,119 contracts.
Spread volume was 37,101 contracts, equivalent to 65.0% of total activity. EFP volume amounted to 1,202 contracts, while EFS volume was 1,118 contracts.
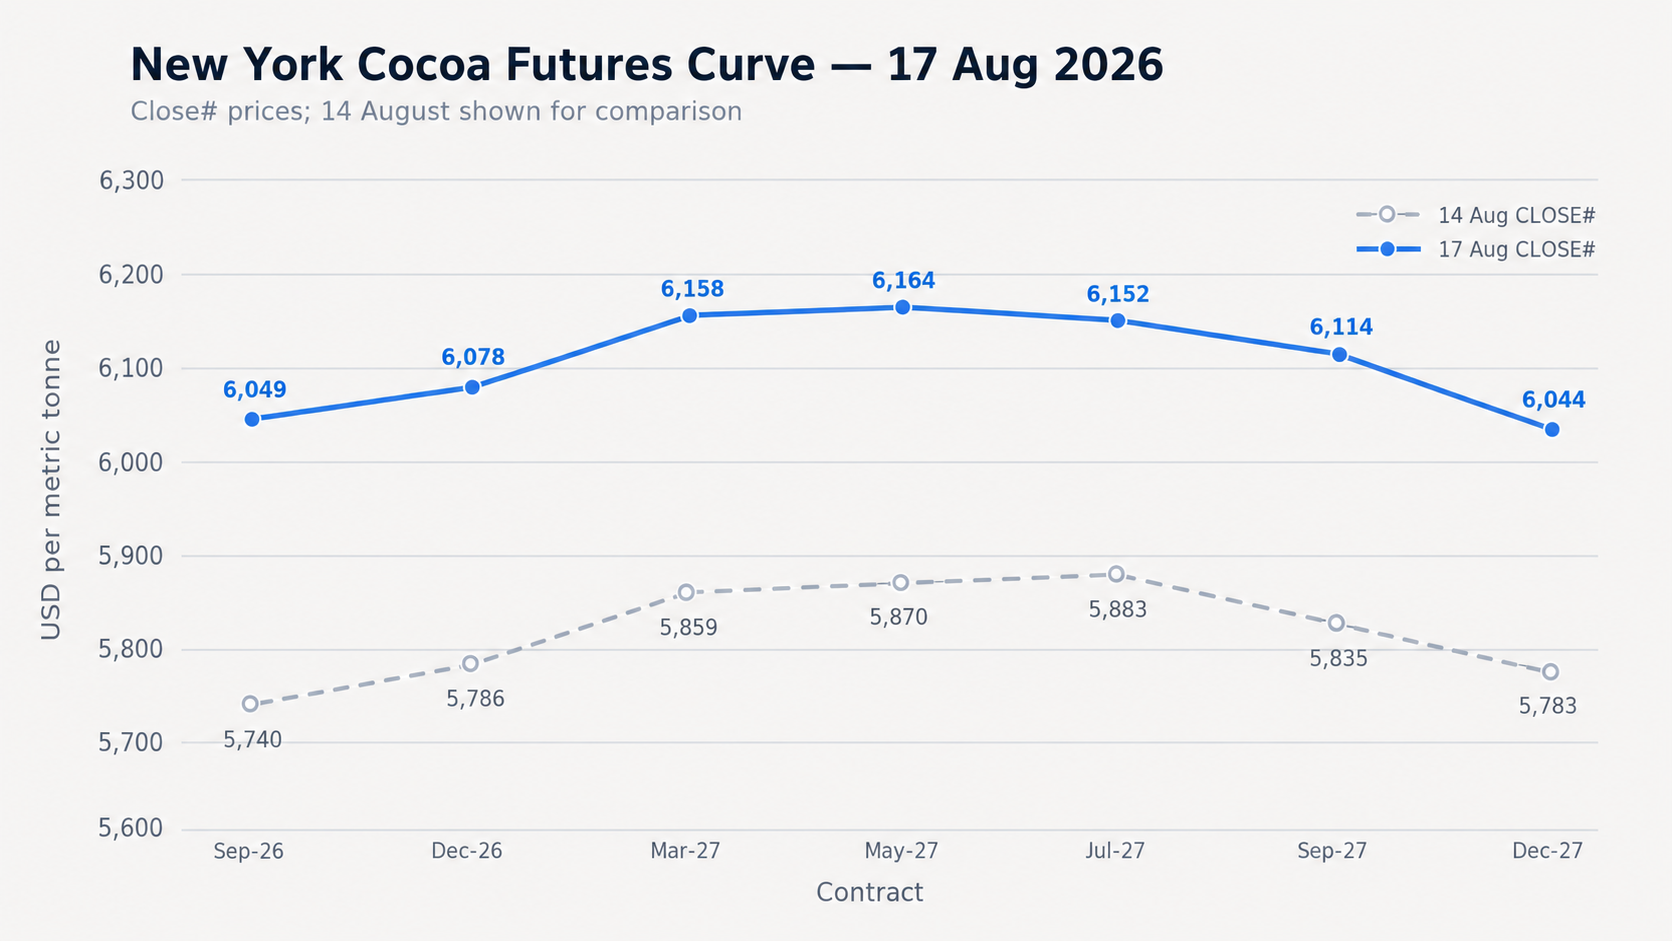
The front of the New York curve flattened. Sep-to-Dec contango narrowed from $46 to $29 because Sep-26 outperformed Dec-26 by $17. Dec-to-Mar moved in the opposite direction, widening from $73 to $80, as Mar-27 gained slightly more than Dec-26.
The most significant structural movement occurred between May and July. The May-to-July structure moved from $13 contango on 14 August to $12 backwardation on 17 August. The relative shift was therefore $25/tonne, with May-27 replacing Jul-27 as the highest-priced displayed maturity.
The broader Sep-26-to-Jul-27 spread narrowed from $143 to $103. More importantly, the Sep-26-to-Dec-27 structure moved from $43 contango to $5 backwardation. This confirms that the nearby contract strengthened relative to the back of the curve even though all maturities rallied.
Beyond May-27, the curve remained inverted. Jul-to-Sep backwardation narrowed slightly, but Sep-to-Dec backwardation deepened from $52 to $70. The resulting structure combines a flatter front end with a more pronounced inversion between the September and December 2027 contracts.
London cocoa
| Contract | 14 Aug | 17 Aug | Change | Change % |
|---|---|---|---|---|
| Sep-26 | £4,133 | £4,298 | +£165 | +3.99% |
| Dec-26 | £4,176 | £4,360 | +£184 | +4.41% |
| Mar-27 | £4,290 | £4,484 | +£194 | +4.52% |
| May-27 | £4,295 | £4,492 | +£197 | +4.59% |
| Jul-27 | £4,302 | £4,481 | +£179 | +4.16% |
London cocoa also rallied sharply across the curve. May-27 registered the strongest gain, rising £197/tonne, or 4.59%, to £4,492. Mar-27 gained £194 to £4,484, while Dec-26 rose £184 to £4,360. Sep-26 increased £165 to £4,298.
Relative performance was strongest around the March-to-May portion of the curve rather than at the nearby contract.
Trading activity was distributed more broadly across maturities than in New York. Sep-26, Dec-26 and Mar-27 generated 17,993 contracts, or 70.0% of total volume. Dec-26 was the dominant maturity with 8,784 contracts, equivalent to 34.2% of total volume. Aggregate volume was 25,690 contracts.
Spread volume reached 17,637 contracts, representing 68.7% of total activity. EFP volume was 668 contracts, while EFS volume amounted to 65 contracts.
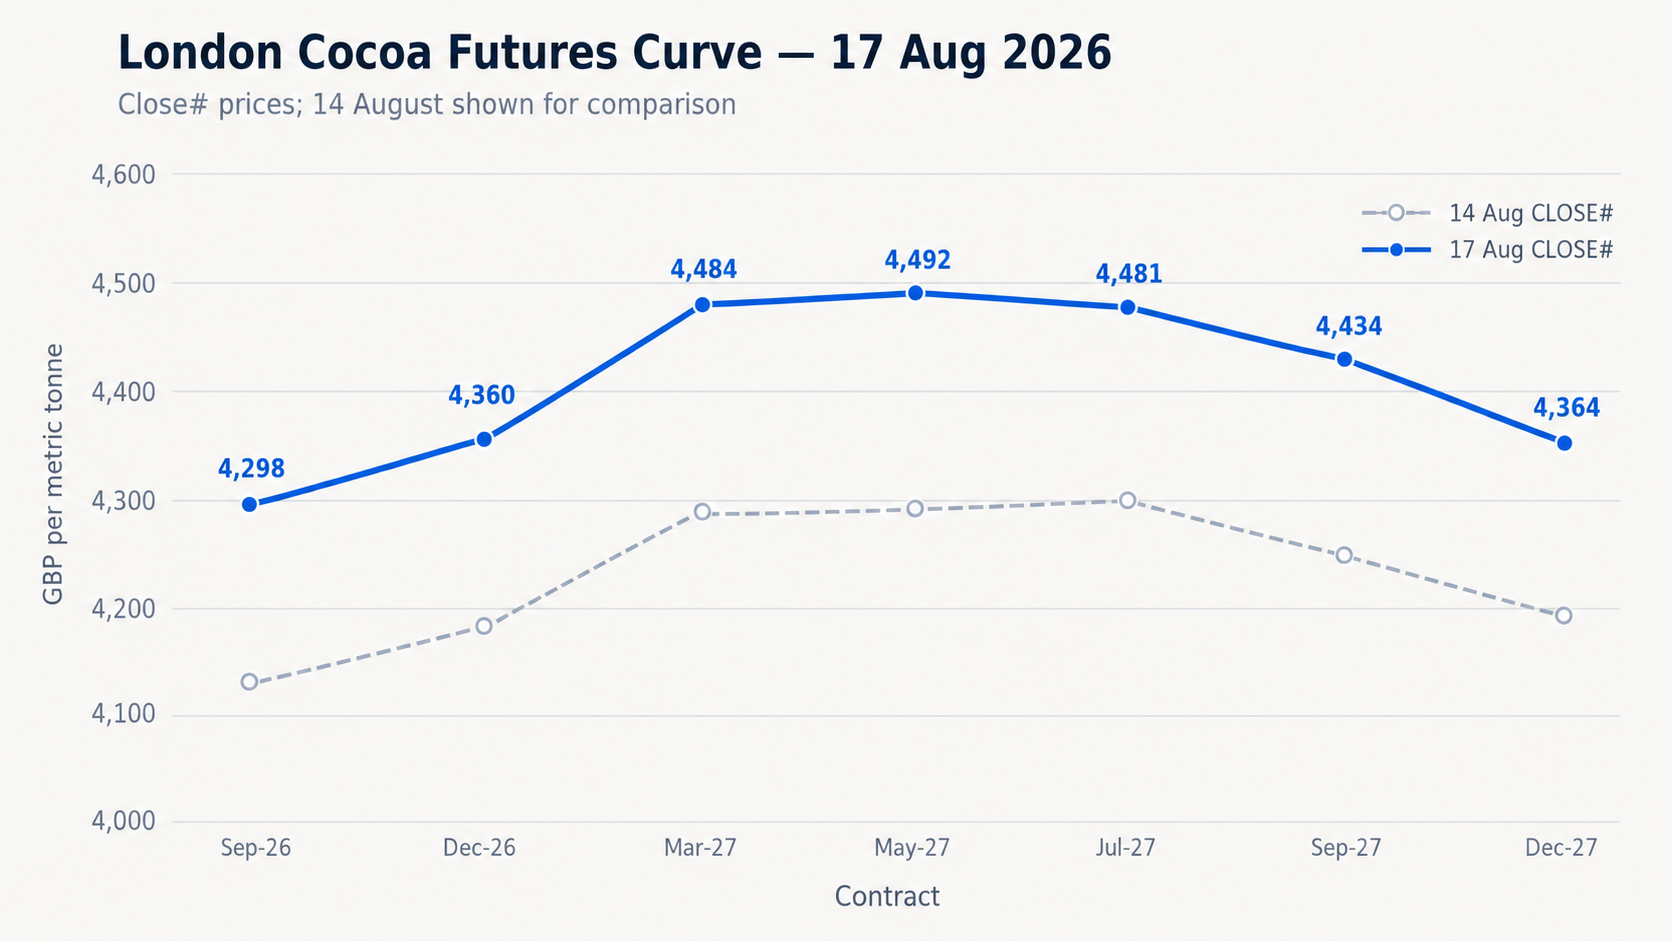
The London curve steepened into May-27. Sep-to-Dec contango widened from £43 to £62, while Dec-to-Mar increased from £114 to £124. Mar-to-May contango also widened slightly from £5 to £8.
As in New York, the May-to-July relationship changed materially. It moved from £7 contango on 14 August to £11 backwardation on 17 August. The curve therefore reached its highest point at May-27 before becoming inverted.
The Sep-26-to-May-27 spread widened from £162 to £194, showing that the middle of the curve materially outperformed the nearby contract. The Sep-26-to-July spread also widened from £169 to £183.
Beyond July, Jul-to-Sep backwardation narrowed marginally from £51 to £47. However, Sep-27-to-Dec-27 backwardation deepened from £56 to £70. The total Sep-26-to-Dec-27 structure remained in contango and widened slightly from £62 to £66.
US–UK Spread
(Dec Contract)
$6,078 − (£4,360 x 1.354$/£) =$174ton (up from $135 ton)
Volume and Open Interest
New York cocoa
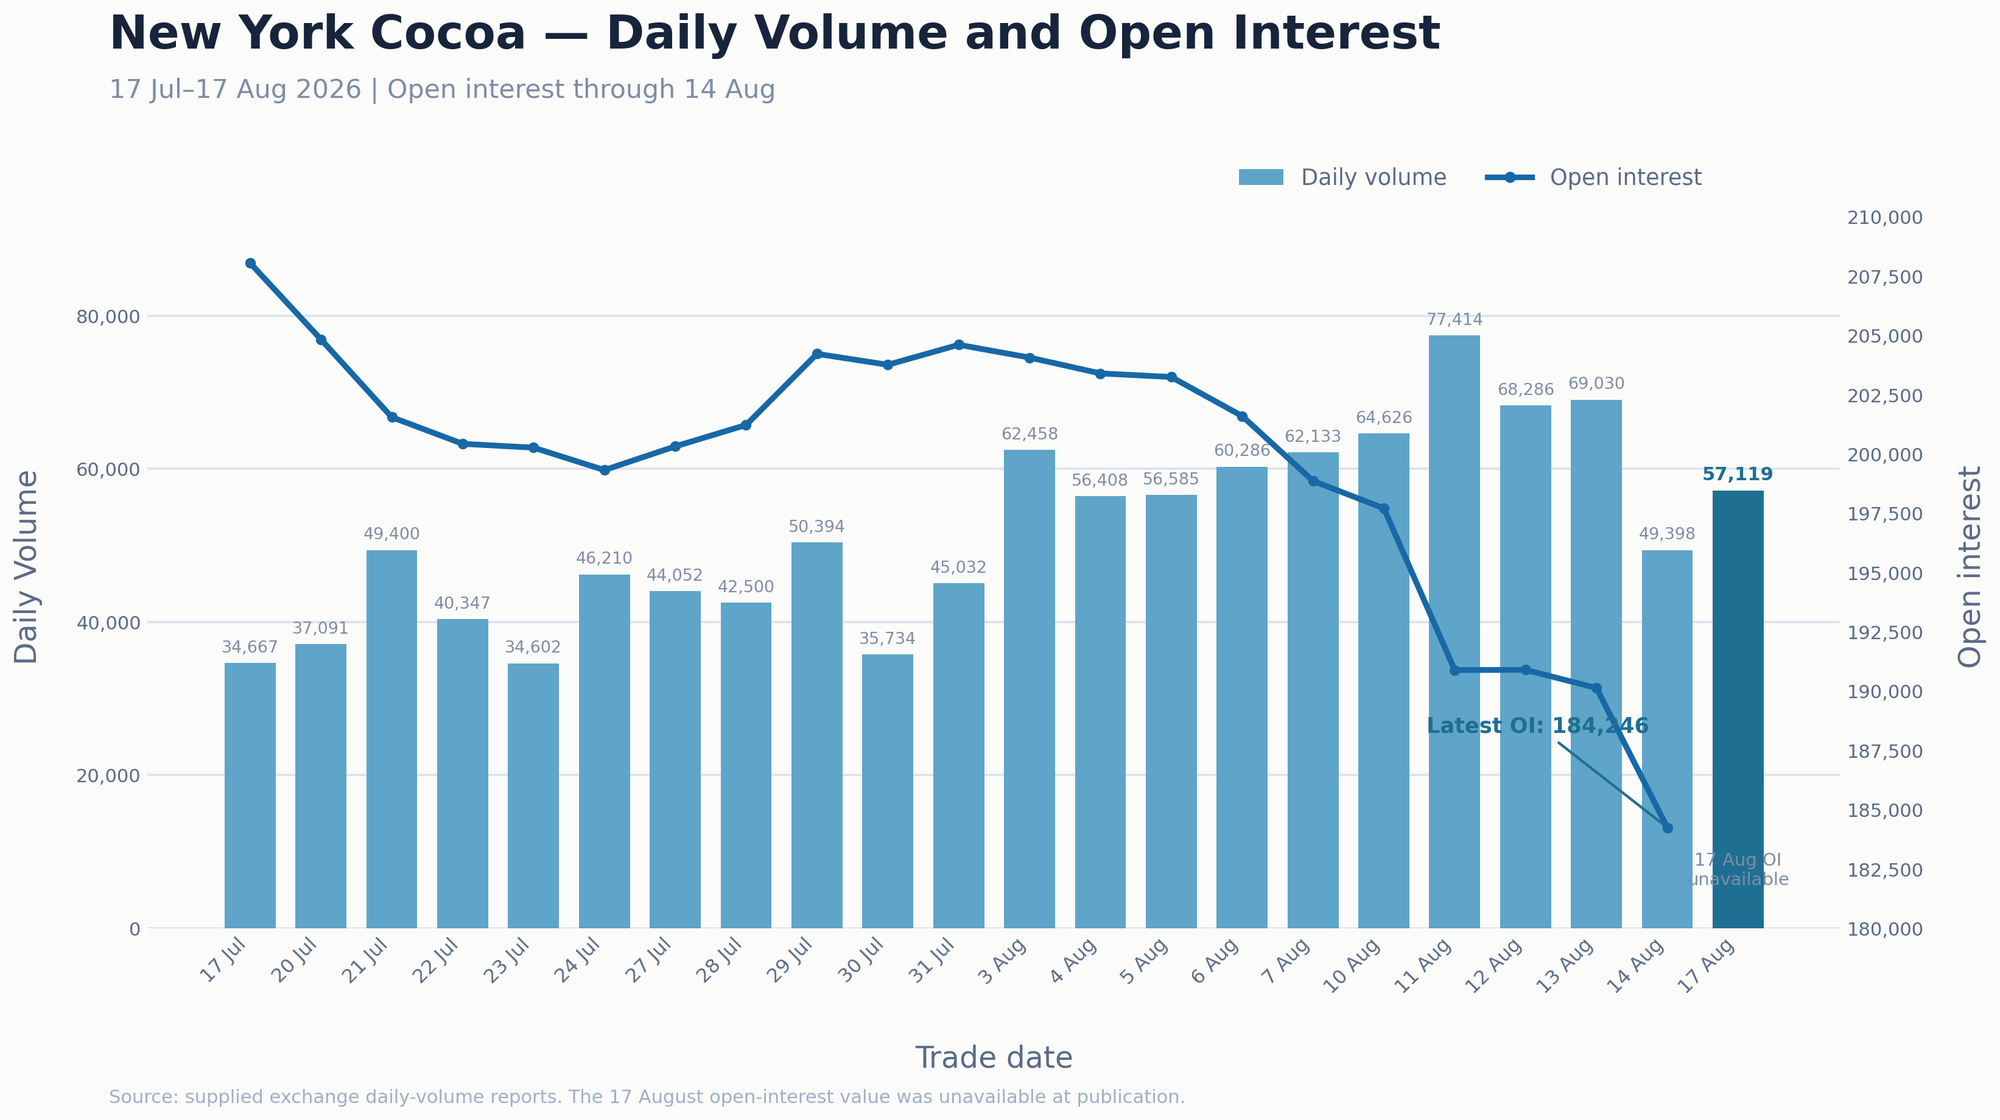
New York cocoa volume recovered on 17 August to 57,119 contracts, an increase of 7,721 contracts, or 15.6%, from 49,398 on 14 August.
Activity was 8.6% above the preceding 20-session average of 52,599 contracts, indicating that participation returned to an above-normal level after the slowdown recorded in the previous session. Volume nevertheless remained 20,295 contracts, or 26.2%, below the recent peak of 77,414 contracts reached on 11 August.
The latest available open interest was 184,246 contracts on 14 August, down 5,888 contracts, or 3.1%, from 190,134 on 13 August. This was the largest one-day open-interest contraction in the final part of the displayed period.
Since 17 July, New York open interest has fallen by 23,809 contracts, or 11.4%, from 208,055. The decline intensified during the second week of August: between 10 and 14 August alone, open interest dropped by 13,462 contracts, or 6.8%.
The combination of lower open interest through 14 August and persistently active volume indicates that a considerable amount of position reduction had been taking place before the 17 August rally. This may reflect outright liquidation, contract-roll effects, or a combination of the two.
The preceding contraction in open interest raises the possibility that short covering contributed to the rally, but this remains an inference rather than a confirmed positioning signal.
London cocoa
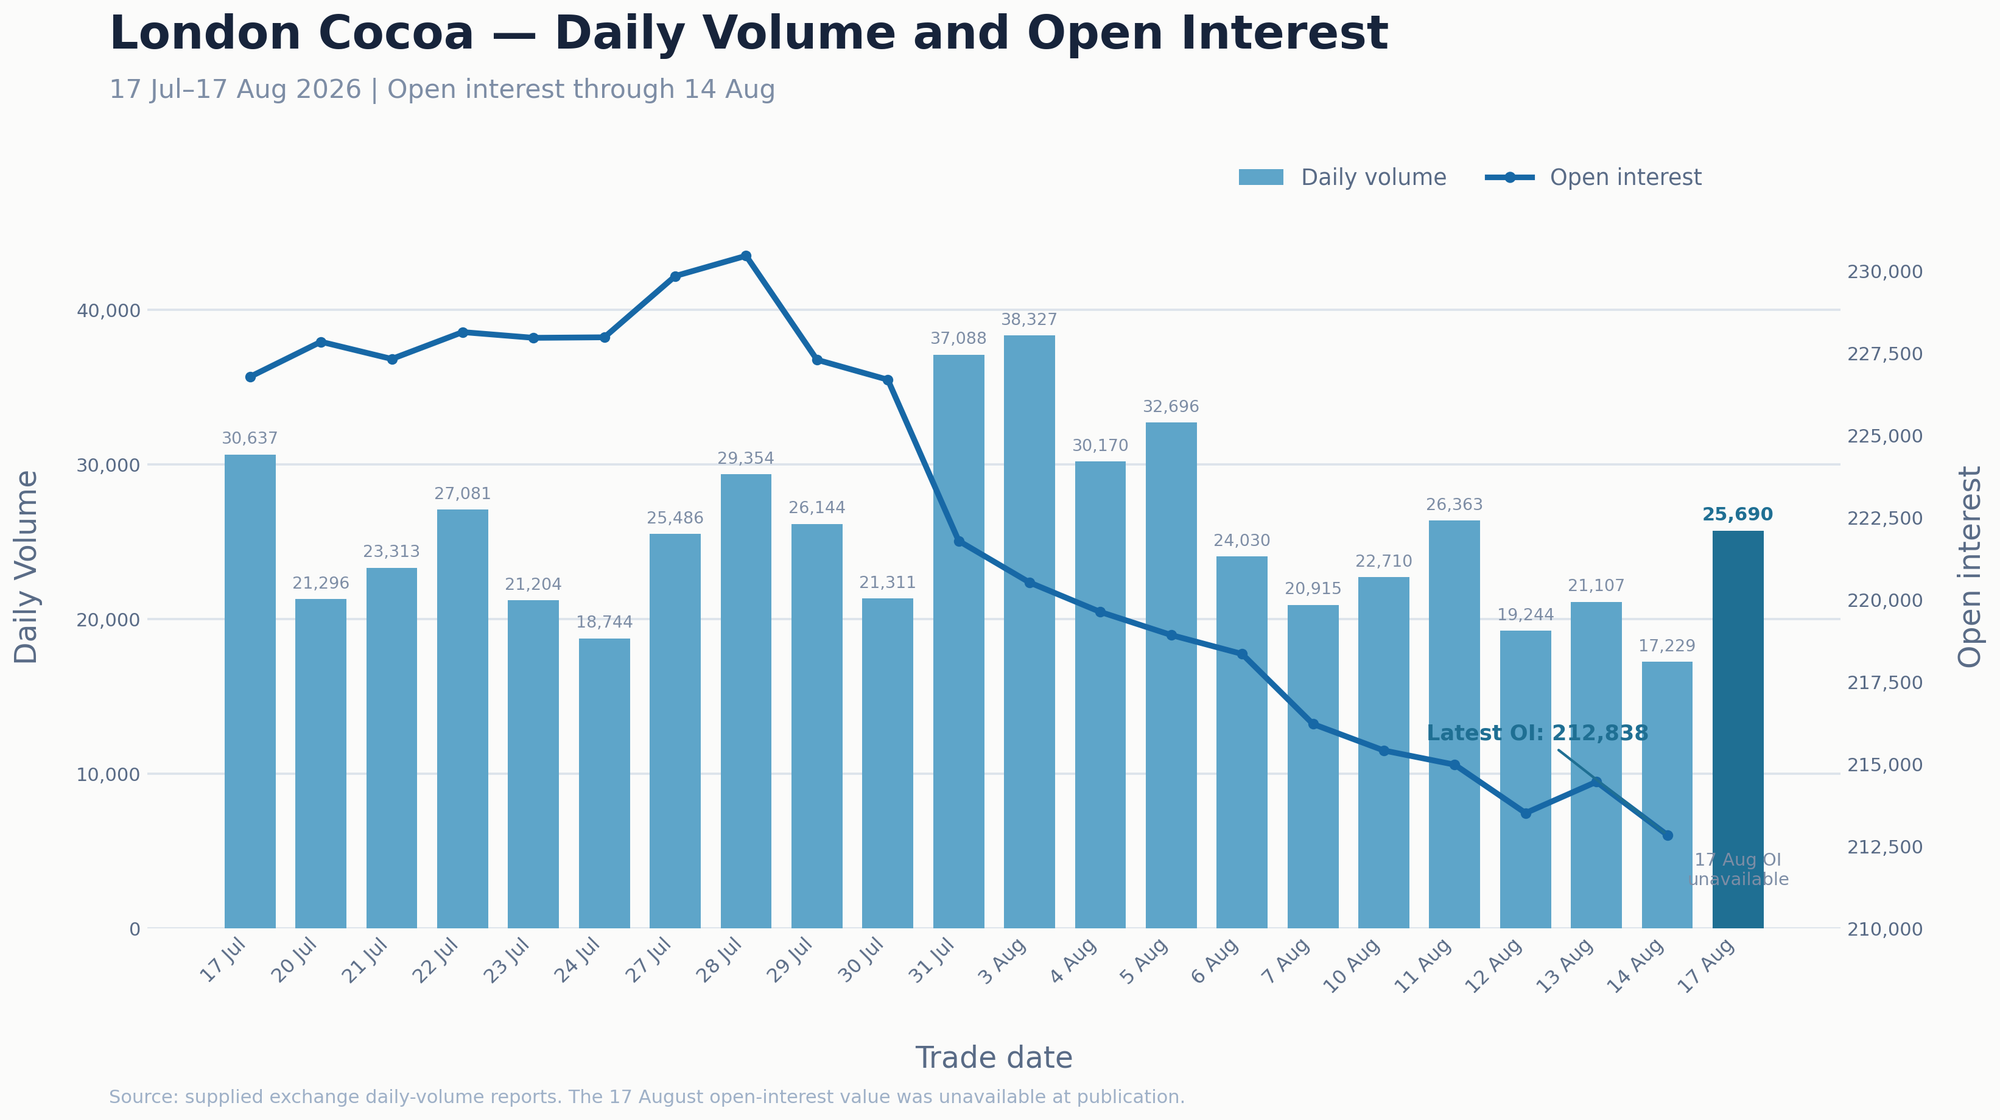
London cocoa volume rebounded strongly on 17 August to 25,690 contracts, up 8,461 contracts, or 49.1%, from 17,229 on 14 August.
Despite the large percentage increase, activity was only 2.0% above the preceding 20-session average of 25,191 contracts. The result therefore represents a return to approximately normal participation after an unusually quiet session, rather than an exceptionally high-volume day.
Volume remained 12,637 contracts, or 33.0%, below the period peak of 38,327 contracts recorded on 3 August.
The latest available London open interest was 212,838 contracts on 14 August, down 1,617 contracts, or 0.8%, from 214,455 on 13 August.
Compared with 17 July, open interest declined by 13,937 contracts, or 6.1%, from 226,775. From the displayed-period peak of 230,455 contracts on 28 July, the contraction reached 17,617 contracts, or 7.6%.
London open interest followed a particularly persistent downward trajectory after the end of July. There was a small increase on 13 August, but this was reversed on 14 August. The broader pattern remains one of declining outstanding exposure.
Exchange Trading Volume
| Market | 14 Aug 2026 | 17 Aug 2026 | Change | Change % |
|---|---|---|---|---|
| US | 3,332,604 | 3,339,996 | +7,392 | +0.22% |
| UK | 1,145,938 | 1,146,719 | +781 | +0.07% |
The measure is not a complete regional stock-to-grind ratio, as it includes only exchange-certified cocoa held at U.S. and EU delivery ports and excludes commercial inventories outside the ICE warehouse system. North America NCA grindings cover processors across North America, while ICE U.S. certified stocks are stored at U.S. delivery ports. ECA reports bean usage in European countries and London-certified cocoa is held in European and UK delivery locations.
Readers can explore detailed cocoa market datasets, futures statistics, and historical indicators in the CocoaIntel Data Hub:
 Cocoa Intel
Tuesday Outlook Dec Contract
On Monday, New York cocoa confirmed its break above the shorter-term descending trendline around $5,750/tonne and extended the advance toward the broader falling trendline on the daily and hourly charts. The market tested the $6,100 resistance zone and finished above the important psychological level of $6,000, preserving the constructive short-term structure.
The technical indicators generally support the bullish move. Price is trading above the principal moving averages on the daily and hourly charts, while the daily RSI is near 65, indicating positive momentum without yet reaching an extreme overbought reading. MACD remains positive, volume expanded during the advance, and OBV recovered sharply, providing additional confirmation of buying participation.
However, the stochastic oscillator is above 80, indicating that the market is becoming stretched in the short term. This increases the probability of a temporary consolidation or pullback to $6,000 before another attempt to break resistance.
The primary scenario remains moderately bullish. A limited pullback toward $6,000 or $5,950 would not damage the structure and could represent a normal retest of the breakout area. Holding this zone would keep the market positioned for another attempt at $6,100.
A confirmed break above $6,100 would strengthen the bullish signal. The psychological $6,750 level would become a credible target only after the market decisively clears previous high.
Conversely, rejection from $6,100–$6,150 would initially expose $6,000, followed by the former breakout area around $5,750.